MY NOT SO MINIMALIST ANALYSIS FOR EOSIO$EOS
11.01.21
0920H +8 SINGAPORE
THROWBACK THURSDAYS
ALERT: ENTRIES, PARTIAL EXITS, EXITS, and MAXIMIZED AREAS OF VALUE
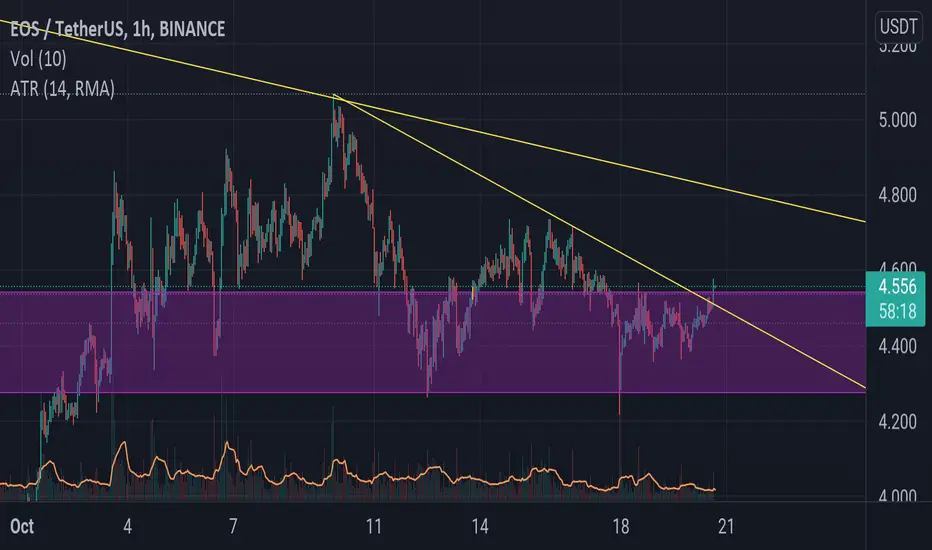
THIS IS AN AREA OF OPPORTUNITY: A ZONE FOR AN ENTRY.
We must watch out for a PIGS TAIL (COIL.)
I call this accumulation maturity just like wine. hehe. It must not break below the bottom of a major and minor box (SUPPORT), but be aware that coils often take a plunge low and go parabolic or simply achieve our EXIT ARE OF VALUE.
We saw a failed AB=CD Pattern but now RSI is almost OVERBOUGHT.
Disclaimer:
The findings of the following analysis are the sole opinions of the publisher of this idea and should not be taken as a piece of investment advice.
"FOLLOW THE WHITE RABBIT!"
HOW TO USE THIS MINIMALIST CHART
Created on a MONTHLY, WEEKLY & DAILY Analysis (The Dynamics of the Market.)
It is designed for SWING TRADES at the BOTTOM. I do not SHORT, though, you can still use it.
TARGET ZONES IDENTIFICATION
The LARGE BOXES (Tops and Bottoms) are MAJOR pivot points that will occur sometime in the future. While the SMALL BOXES (Tops and Bottoms) are MINOR pivot points.
These can be entries to a BUY/ SELL POSITION, EXIT/PARTIAL EXIT/TOP-UP AREAS
and if you wish to hold longer for a MAXIMUM TARGET EXIT AREA OF VALUE -CONSERVATIVE (If price action conditions are right.)
At times I include WAY BEYOND PARABOLIC Price TARGETS depending on The Character of the Market.
Watch out for your Volume, Chart Patterns, Candlestick Math, FIB COILS (ABC), Price Action, FIB LEVELS, Market Dynamics, and especially trading psychology.
Wishing you all The Best Trades and Thank you all for your Appreciation and Support of My Work.
Much thanks to My 3 Mentors!
Note:
Master your Trading Discipline
and Trader's Psychology
Vive Le Austist!
EOSUSD


₿ EOSUSDT 1D ₿ : 26.Oct.2021This analysis is a check of the chart in a Daily time frame and everything is clear on the chart and does not need additional explanation ... However, if you have any questions, feel free to ask .
⚠️ This Analysis will be updated ...
👤 Arman Shaban : @Ar_M_An_4
📅 26.Oct.2021
⚠️(DYOR)

EOSUSDT +200% - In a Few MonthsEOSUSDT +200% - In a Couple of Months.
Analyse EOS vs BTC. Check Out my Ideas EOSBTC In the links below.

EOS - is going to breakout this trendline 🤯🧨A trend line has now formed on the EOS chart. The price is already close to this line. A breakout could be a good buying opportunity.
Write in the comments all your questions and instruments analysis of which you want to see.
Friends, push the like button, write a comment, and share with your mates - that would be the best THANK YOU.
P.S. I personally will open entry if the price will show it according to my strategy.
Always make your analysis before a trade.

Eos (EOS) - October 25Hello?
Welcome, traders.
By "following", you can always get new information quickly.
Please also click "Like".
Have a nice day.
-------------------------------------
(EOSUSD 1W Chart) - Mid-Long-Term Perspective
Above section 5.1-6.4053: Expected to make a new wave.
(1D chart)
It is important to keep the price above the 5.1 point.
In particular, it is necessary to check whether it can break through the volume profile section formed near the 6.4053 point upward.
If the price is maintained above the 6.4053 point, the uptrend is expected to accelerate.
If it falls from the 3.6732-4.0849 range, it may touch near the 2.8250 point, so trade cautiously.
------------------------------------------
(EOSBTC 1W Chart) - Mid-Long-Term Perspective
Above 0.0003040 point: expected to continue uptrend
(1D chart)
It is important to maintain the price by rising above the 0.0000856 point.
A rise above the 0.0001470 point is expected to continue the uptrend.
------------------------------------------
We recommend that you trade with your average unit price.
This is because, if the price is below your average unit price, whether it is in an uptrend or in a downtrend, there is a high possibility that you will not be able to get a big profit due to the psychological burden.
The center of all trading starts with the average unit price at which you start trading.
If you ignore this, you may be trading in the wrong direction.
Therefore, it is important to find a way to lower the average unit price and adjust the proportion of the investment, ultimately allowing the funds corresponding to the profits to regenerate themselves.
------------------------------------------------------------ -----------------------------------------------------
** All indicators are lagging indicators.
Therefore, it is important to be aware that the indicator moves accordingly with the movement of price and volume.
However, for the sake of convenience, we are talking in reverse for the interpretation of the indicator.
** The MRHAB-O and MRHAB-B indicators used in the chart are indicators of our channel that have not yet been released.
(Because it is not public, you can use this chart without any restrictions by sharing this chart and copying and pasting the indicators.)
** The wRSI_SR indicator is an indicator created by adding settings and options to the existing Stochastic RSI indicator.
Therefore, the interpretation is the same as the traditional Stochastic RSI indicator. (K, D line -> R, S line)
** The OBV indicator was re-created by applying a formula to the DepthHouse Trading indicator, an indicator disclosed by oh92. (Thanks for this.)
** Support or resistance is based on the closing price of the 1D chart.
** All descriptions are for reference only and do not guarantee a profit or loss in investment.
(Short-term Stop Loss can be said to be a point where profit and loss can be preserved or additional entry can be made through split trading. It is a short-term investment perspective.)


EOS EOSUSD - Rounding bottom + Next Target- This is my analysis for EOS , a lot of poepole asking about why EOS is not pumping.
- So be careful and consider if the EOS is a good choice or not, maybe it is too risky.
- On the chart we can see a rounding bottom or cap and handle formation, which is bullish .
- After a rectangle consolidaton, the price started with an Impulse Elliott wave .
- First target 1:1 / below all time high.
- RSI is ready and volume favors bulls.
- For expected duration of the trade, probability, stop loss, profit target, entry price and risk to reward ratio ( RRR ) - please check my signature below ↓
- If you want to see more of these ideas, hit "Like" & "Follow"!

EOSUSD end of year bullish breakif price can get above this yellow trend line of resistance i think we will see EOS capture previous highs of the year.
and depending on how mad the bull market gets, bitcoin can really pull a lot of the alts USD value.
buy the break and retest of this yellow trendline. was super bullish on EOS earlier this year but until it proves otherwise, not sold on new ATH this year

EOSUSDT - Take entry here is great!BYBIT:EOSUSDT
4H trend chart
-
EOS just broke out the upper downtrend line in 4H chart
If price can keep breaking out this downtrend line without long upper shadow line in 4H chart
It's a nice timing for entry, and trading strategy as below
Here we can gain good R-R ration around 2
-
Profit Targets:
a) 5.071---Fib(1)
b) 5.462~5.620----Fib(1.272~1.382)
c) 5.789----Fib(1.5)
Stop losses:
a) 4.386-----Red horizontal ray
-
If you like this analysis, smash the "like button" and leave a comment below to share your thoughts
or let me know what crypto you want to see!
Trading is a reflection of yourself. Learn more daily and be ready for every opportunity.
Have a nice trading!

EOS new leg up? ⬆️After a correction now EOS has broken the local trendline and closed a candle above the resistance area. As bitcoin dominance is going down alt coins like EOS can fly.
☑️EOSUSD: best is yet to comeThere are many ideas and forecasts for this instrument, that portend growth to the level of $20 and above. Maybe it is so. To be in the role of an investor and quietly wait for your "dividends" after half a year, a year, and so on.
At the moment, a potential SELL-position has formed for the coin with a risk / reward ratio = 1/3 . The price area 4.5830 - 4.4875 acts as a SELL-zone, in which the entry should be found. An entry is expected by a signal (for example, a false breakdown of the resistance line of a downtrend channel). This is an individual matter.
It is not planned to delay sales too much, and after the ratio of 1/3 has been worked out, it would be possible to close. For more aggressive traders, you can consider the potential two zones indicated on the chart (in green: 1) price area 4.1840 - 4.2485 ; 2) price area 3.9360 - 4.0555 ), where the instrument can still go down. Around the $4 level, it is not recommended clinging to sales.
🔔 Proposed deal for this tool 🔔:
🔴Entry Point - 4.5517
⛔️Stop Loss - 4.6382
✅Take Profit - 4.2919
Thanks for your comments and likes 👍

Eosusdt long biasHey guys hope you doing good.
Eosusdt showing me bullish. In this bull run we can easily predict it around 22$.
Good luck for the bullish traders.

EosusdtEos have a good pump for this week
Look the candles of last days just look doji & doji and doji...

EOSUSD LONGEOS has gotten a high uptrend and got a resistance of 6.53 although it hit the 3.59 support level but buyers are strong and has set the asset on another bull run. Do you think it will break pass the 6.53 resistance?

EOS on an strong support 💡Eos now is on an strong long term support which price has bounced on it many times before. If this level is hold we'll have a good rising up.

eos triangeleos formed a triandel for a long time and thats mean that we will have a huge move based on btc condition so take care and be careful of fake outs

EOS/USD: The next altcoin to explode soonEOS it's showing us an interesting bull market that could to change your perspective if you want to make trading or hold EOS in your trading app in cryptocurrency.
Now, you can to put a long position by position trading to hold this cryptocurrency like trading opportunity during weeks to months. I believe the lot potential of this cryptocurrency, it's an undervalued and cheapest altcoin that you can to buy now or starting to invest in it.
EOS it's showing us strenghten during the next weeks.

EOSUSD - BullTrend : ConfirmedHello there,
Take a look on EOSUSD Chart, It's look amazin, he broke the descending triangle then confirmed and now he is ready for pushups.
And the indicators looks bullish, one more day for the RSI to close above 50.
Consider that is not a trading advice,
St.Gex

EOSUSD - Close For BreakoutHello everyone,
Considering that $80,000 is still in play for Bitcoin, I am looking for Alts Markets buying opportunities also.
EOS already prove that is a resilient project in this field, and, with most awaited Bullish Global announcement by Block One, we can find the price of EOS at a decent level on ~$20.
This is not a trading advice,
St.Gex

Eos (EOS) - October 6Hello?
Welcome, traders.
By "following", you can always get new information quickly.
Please also click "Like".
Have a nice day.
-------------------------------------
(EOSUSD 1W Chart) - Mid-Long-Term Perspective
Above the 2.8250 point: The uptrend is expected to continue.
Above 6.4053 point: Expected to create a new wave.
However, the trend is expected to change depending on how it can break through the psychological resistance section formed in the 8.1435-9.0500 section.
(1D chart)
Volume profile section: 2.8250-6.4053 section. (It is formed over a fairly wide section)
Resistance section: 8.1435-9.05 section.
It is expected that the trend will be determined according to how it deviates from the volume profile section.
If the BTC price rises to the end, it is expected that circulation pumping will start as a priority among alpcoins.
If not, you will most likely be promoted to a lower priority.
I think the resistance zone is actually a psychological resistance zone.
Therefore, if there is a sharp uptrend, it is expected to break through the upwards immediately.
However, whipsaw may occur, so you should think about how to deal with it.
------------------------------------
(EOSBTC 1W Chart) - Mid-Long-Term Perspective
(Enlarge: )
I need to see if I can keep the price above the 0.0000856 point.
If the price is maintained above the 0.0001470 point, it is expected to turn into an uptrend.
However, we expect it to rise above the 0.0003040 point to continue the uptrend and create a new wave.
(1D chart)
It is necessary to check if there is support and upward movement in the 0.0000856-0.0000979 section.
If it declines from the 0.0000856 point, the CCI line is expected to drop below the -100 point in the CCI-RC indicator.
Such a move could lead to entry into the mid- to long-term investment realm, requiring careful trading.
However, it is possible to touch the support section formed at the 0.0000736 point and rise, so you need to think about how to respond.
------------------------------------------
We recommend that you trade with your average unit price.
This is because, if the price is below your average unit price, whether it is in an uptrend or in a downtrend, there is a high possibility that you will not be able to get a big profit due to the psychological burden.
The center of all trading starts with the average unit price at which you start trading.
If you ignore this, you may be trading in the wrong direction.
Therefore, it is important to find a way to lower the average unit price and adjust the proportion of the investment, ultimately allowing the funds corresponding to the profits to regenerate themselves.
------------------------------------------------------------ -------------------------------------------
** All indicators are lagging indicators.
Therefore, it is important to be aware that the indicator moves accordingly as price and volume move.
However, for the sake of convenience, we are talking in reverse for the interpretation of the indicator.
** The MRHAB-O and MRHAB-B indicators used in the chart are indicators of our channel that have not been released yet.
(Since it was not disclosed, you can use this chart without any restrictions by sharing this chart and copying and pasting the indicators.)
** The wRSI_SR indicator is an indicator created by adding settings and options to the existing Stochastic RSI indicator.
Therefore, the interpretation is the same as the traditional Stochastic RSI indicator. (K, D line -> R, S line)
** The OBV indicator was re-created by applying a formula to the DepthHouse Trading indicator, an indicator disclosed by oh92. (Thanks for this.)
** Support or resistance is based on the closing price of the 1D chart.
** All descriptions are for reference only and do not guarantee a profit or loss in investment.
(Short-term Stop Loss can be said to be a point where profit and loss can be preserved or additional entry can be made through split trading. It is a short-term investment perspective.)

broke the bearish trend EOS bullish Coming ?EOS broke the first resistance which was very strong, 4.5 usd and now it is needed to close the candle at least 4 h or 1 day frame above 4.5
the second resistance is 4.75 , if we exceed this resistance then we may go to 5.65 usd
MACD is giving good signal to bullish
RSI and chart show we broke the downward trend
NOT FINANCIAL ADVISE

EOSUSDTBuy here to reach the first goal
Then wait for the resistance line to break and buy it again in the money back for the second goal
........
No one but God knows the future, we only state the possibilities
_______
Good luck
