EOSUSD

Long and strongEOS clear breakout on the daily chart, long, set, forget.
Long eos = gmi
not long eos = ngmi

Simple but smartIt has a credible resistance ahead. If he reacts, I think this is a good time to sell. Especially considering the bitcoin chart.
But if it crosses this resistance, when pullback can be a good option to buy
Please follow me.

EOSUSD about to play catchup real soonIf we plot the TRXUSD chart on the EOSUSD chart we can see a clear price similarity between the two. Logically enough since the two are direct competitors of each other. This price correlation is better seen on the daily chart but i've chosen to post the 4hour chart in order to zoom in on the upcoming breakout. This may or may not signal a breakout for EOS but the similarity seems promising.

EOS/USDT 2 idea in 4hthis 2 idea for EOS is predictable in 4h chart. lets se which one will run. EOS is a good project that is not grown with market yet.

EOS/USD Break Out Coming SoonApparently my previous post on EOS was taken down. EOS is on the verge of breaking out of the wedge with initial target of $7 then $10. If you would like access to our Pro Oscillator please DM us. As always, please DYOR.

EOS about to break out! Here's a quick look at EOS 6 hr chart. As we can see, the price has printed a symmetrical triangle and is very close to breaking to the upside!
The best entry would be, when the price breaks above the symmetrical triangle with good amount of volume .
-------------------------------------------
The idea is: Buy the breakout from the symmetrical triangle and take profits at the levels shown in the chart.
Targets:
1. 5.94$
2. 6.19$
3. 6.6$
- Profits can also be taken in the resistance zone .
-------------------------------------------
If you like the content, then make sure to comment and like the post :D
Follow me for daily profitable trading setups
BTC dictates the market. If BTC falls, then Alts will fall as well. Trade safe!

EOS Just mark here for future reff
.
Eos potential 55%-175%
.
EOS/USDT
Entry: 5.3747
TP 1: 8.9784
TP 2: 14.9234
ST : 4.9932


EOS: BIG PUMP COMING...can't think of a more beautiful (forming) Bullish Gartley pattern than this.
we're about to take off in next few weeks and TAKE OFF HARD!

Keeping an eye on EOS! - Long setup to $6.8Taking into account only PA. Lots else at play, but wanted to send this out as one data point ...
Descending wedge - wait for breakout and retest confirmation.
0.5 Fib retracement defense - wait for confirmation of support.
I'm in long. Will add on each 0.5 fib touch. SL just below wedge apex.
Good luck!

EOS EOSUSD - Rounding bottom + NEW ATH soon!- This is my analysis for EOS , a lot of poepole asking about why EOS is not pumping.
- On the chart we can see a rounding bottom or cap and handle formation, which is bullish .
- After a rectangle consolidaton, the price started with an Impulse Elliott wave .
- First target 1:1 / below all time high.
- RSI is ready and volume favors bulls.
- For expected duration of the trade, probability, stop loss, profit target, entry price and risk to reward ratio ( RRR ) - please check my signature below ↓
- If you want to see more of these ideas, hit "Like" & "Follow"!

EOS USDEOS USD Now is Trying to Take of Price is forming ascending Triangle in D timeframe and Second Reason to Buy is FIB Retracement D timeframe already retrace to 0.50% minimum target is 7.60 USD Good luck 99% is Bullish EOS

Trend reversal pattern in EOS* EOS in 30-mins time frame forms Inverse Head and shoulder pattern with neckline as it's resistance near $4.87.
* Inverse head and shoulder occurs during the down trend, this indicates the reverse of the trend.
* If the price breaks the it's resistance we see a bullish move till $5.050.

EOS | Monthly Outlook | The laggard catching upThe chart says it all. Interesting to see how it plays out.

Bitcoin and EOS ComparisonDuring 2017 Bitcoin reach a max point around 19k and when Bitcoin started dropping, EOS consolidated and Pump to the moon. EOS is a lagger compared to Bitcoin and other Alt coins. It also happened during this bullrun, Everything was pumping and EOS was consolidating and Once most altcoin pumped, EOS started going up and hit around 15 dollars.
Rinse and Repeat.

EOSUSDT ready to takeoffif you see my profile both EOSUSDT and EOSBTC charts are indicating an upcoming wave for this coin. do not miss out.

EOSUSDT : Good Opportunity to buy Some moreLet's buy Some #EOSUSDT (EOS) ✅ , Shall We ?? Amazing Chart , Isnt it ?? ✅
In order to buy, the SL (stop loss) and capital management must be observed.
All resistances and TPs (take profits) are marked on the chart.
(DYOR)


EOS - The Moon Cryptocurrency BreakoutRecently I was alerted to a potential break out by a fellow trader - After analysing his chart and then doing my own analysis - Thanks to this fellow trader I have discovered the next level for EOS
PREPARE FOR THE GREATEST BREAKOUT YOU'VE SEEN SINCE ALT SEASON HIT.
EOS Price $3.06
Price Change
24h $-0.03474 1.14%
24h Low / 24h High
$2.99 /$3.13
Trading Volume
24h $2,957,305,850.38 12.82%
Market Dominance 0.26%
Market Rank #18
EOS Market Cap
Market Cap $2,907,186,682.87 1.13%
EOS Price Yesterday
Yesterday's Low / High
$2.99 /
$3.12
Yesterday's Open / Close
$3.00 /
$3.06
Yesterday's Change
2.08%
Yesterday's Volume $2,585,205,674.78
EOS Price History
7d Low / 7d High
$2.66 /
$3.26
30d Low / 30d High
$2.41 /
$3.92
90d Low / 90d High
$2.03 /
$3.92
52 Week Low / 52 Week High
$1.46 /
$5.48
All Time High
Apr 29, 2018 (3 years ago)
$22.89
86.63%
All Time Low
Oct 23, 2017 (3 years ago)
$0.4802
537.1%
EOS ROI
196.64%
BINANCE:EOSUSDT
BINANCE:EOSBTC
BITFINEX:EOSUSD
KRAKEN:EOSUSD
KRAKEN:EOSEUR
FTX:EOSPERP
HUOBI:EOSUSDT
BINANCE:EOSBUSD
BITFINEX:EOSBTC
BINANCE:EOSUSDTPERP
COINBASE:EOSUSD
BINANCE:EOSUSD
KUCOIN:EOSUSDT
BINANCE:EOSETH
OKEX:EOSUSDT
BINANCE:EOSEUR
POLONIEX:EOSUSDT
BITHUMB:EOSKRW
BITFINEX:EOSTRY
CRYPTOCAP:EOS.D
KRAKEN:EOSXBT
BITFINEX:EOSGBP
BINANCE:EOSBNB
POLONIEX:EOSBTC

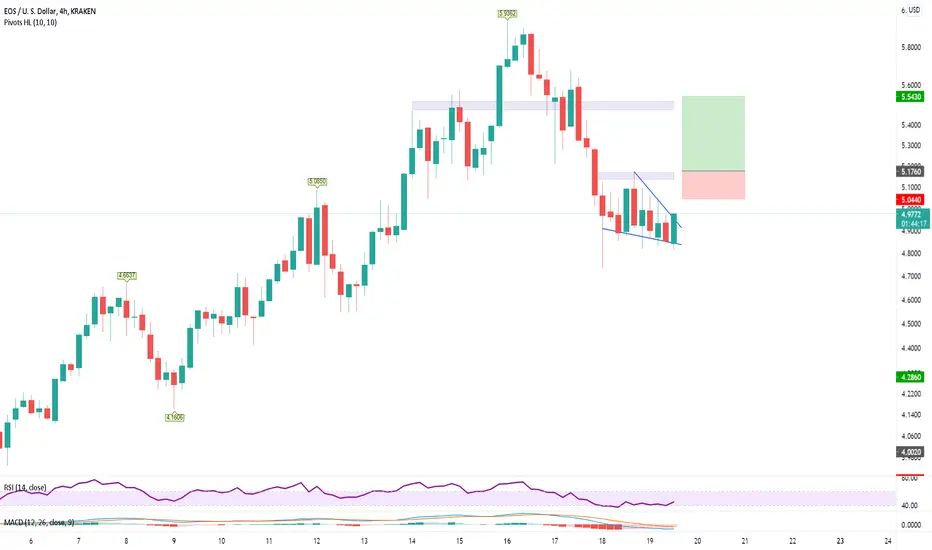
EOS Buy a break setup.EOS - Intraday - We look to Buy a break of 5.176 (stop at 5.044)
Price action has formed a bullish ending wedge formation.
The previous swing high is located at 5.168.
Daily signals are bullish.
The bias is to break to the upside.
Our profit targets will be 5.543 and 5.649
Resistance: 5.000 / 5.150 / 5.400
Support: 4.850 / 4.700 / 4.550

EOSUSD 1D TF (Update)As we can see, after breaking its downward trend, the price is gathering strength to start a strong climb.
In order to buy, the SL (stop loss) and capital management must be observed.
All resistances and TPs (take profits) are marked on the chart.
(DYOR)
