EOS in Potential Bullish Momentum!Eos is Currently sitting at strong demand zone, if momentum holds Potential gains are 27%.
Entry : At current Market Price or Retest of 5.5
Targets: 6.5 and 7
Stop Loss: Short Term 5.3, Long Term 4.4
Always practice Risk management!
Like, Follow and and Share your Views.
Stay blessed ❤️
EOSUSD

EOS is next (this one is risky bcs of btc being stupid)EOS pump is next on the waiting list of altcoin pumps, I expect atleast a 30% pump but since it is highly dependable on btc and btc is at a good resistance I would say to keep monitoring BTC while keeping EOS long, currently XRP is running

$EOS again undervalued after hitting my $15 targetEOS, after touching my $15 target, did exactly what I would have wanted it to do, which was retrace its steps. I personally did not expect him to go that deep but that has been a convergence with Bitcoin. Fortunately, I indicated several times on Twitter that I was taking a big TP at $15 because a retracement is always coming. What goes up, must come down.
Now looking forward to EOS, I am still very positive and very surprised that this coin is still valued so low. The fundamentals of EOS are also getting better with bullish exchange in sight.
Therefore, I expect EOS to show considerable price action in the coming months and weeks and possibly reach a new ATH before the end of the year.


EOSUSDT : this is amazing , isn't it ?As we can see, after breaking its downward trend, the price is gathering strength to start a strong climb.
In order to buy, the SL (stop loss) and capital management must be observed.
All resistances and TPs (take profits) are marked on the chart.
(DYOR)

EOS/USDTGood movement we can expect some growth in volume so we can go to 6 easy
buy orders should be
$4.65
$4.50
EOS - Shorterm #SM.DUNZA-EOSUSD-30min-3TP #BYBIT #EOSUSD
Close long position if opened.
OPEN NEW/ADD TO SHORT POSITION
Enter around: 4.635
TAKE PROFIT:
4.561, 4.519, 4.417,
STOPLOSS:
4.728,
We recommend moving stop loss to break even once the first TP is hit
Signal issued on 2021-08-12T21:30:00Z


I'm in love with this chartSuch a great setup.
Mind, if Bitcoin remains bullish toward September and EOS pumpers manage to invent some hot news in the upcoming period EOSUSD may fly over $10 once again.

EOSUSDT Ready for next BULL Run!EOS/USDT(12h Chart) Technical analysis Update
EOS/USDT(12h Chart) Currently trading at $4.51
Buy level : Above $4.50
Stop loss: Below $3.76
TP1: $5.36
TP2: $6.27
TP3: $7.55
Max Leverage 2x
Always keep Stop loss
Follow Our Tradingview Account for More Technical Analysis Updates, | Like, Share and Comment Your thoughts.

eosusdtIf the candlestick closes above $ 4.5 a day today, the uptrend to $ 8 will be the same as Scenario 2.
If the candle closes below $ 4.5 a day today, correction to $ 4 is possible, and with support for $ 4, the uptrend to $ 8 is the same as in Scenario 1.
And a third case is likely to occur
It all depends on the movement of bitcoin


Eos (EOS) - August 7Hello?
Welcome, traders.
By "following", you can always get new information quickly.
Please also click "Like".
Have a nice day.
-------------------------------------
(EOSUSD 1W Chart)
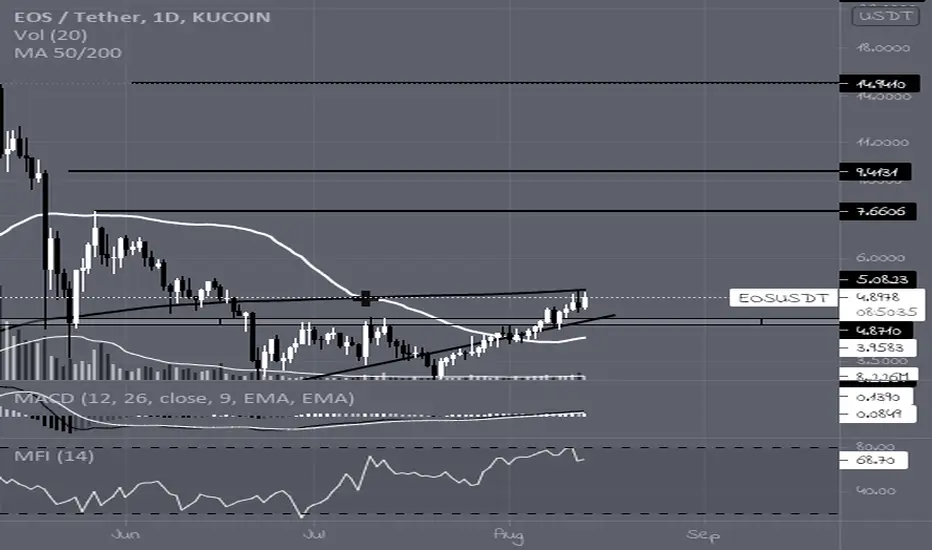
If the price is maintained above the 4.0849-5.1 range, it is expected that the uptrend will continue.
(1D chart)
If the price holds in the 3.6732-5.1 range, it is expected to turn into an uptrend.
To continue the uptrend, it must move above the critical point of 6.4053.
If it falls from the 3.6732 point, you will enter the mid- to long-term investment area, so careful trading is required.
--------------------------------------
(EOSBTC 1W chart)
If it rises in the 8560 satoshi-30400 satoshi section, which is the bottom box section, it is expected to create a new wave.
If the price holds above the critical point of 14700 Satoshi, we expect the uptrend to continue.
Looking at the big picture, if it rises above the 47210 satoshi-53210 satoshi section, it is expected to break out of the trough section.
(1D chart)
It remains to be seen if the 9970 Satoshi-11130 Satoshi section can support and rise.
If the price is maintained above the 11130 Satoshi point, it is expected to turn into an uptrend and rise.
If it falls from the 9970 Satoshi point, there is a possibility of entering the mid- to long-term investment area, so careful trading is required.
However, it is possible to touch near the 8560 Satoshi point and rise, so be prepared for this as well.
------------------------------------------
We recommend that you trade with your average unit price.
This is because, if the price is below your average unit price, whether it is in an uptrend or in a downtrend, there is a high possibility that you will not be able to get a big profit due to the psychological burden.
The center of all trading starts with the average unit price at which you start trading.
If you ignore this, you may be trading in the wrong direction.
Therefore, it is important to find a way to lower the average unit price and adjust the proportion of the investment, ultimately allowing the funds corresponding to the profits to regenerate themselves.
------------------------------------------------------------ -----------------------------------------------------
** All indicators are lagging indicators.
Therefore, it is important to be aware that the indicator moves accordingly as price and volume move.
However, for the sake of convenience, we are talking in reverse for the interpretation of the indicator.
** The wRSI_SR indicator is an indicator created by adding settings and options to the existing Stochastic RSI indicator.
Therefore, the interpretation is the same as the traditional Stochastic RSI indicator. (K, D line -> R, S line)
** The OBV indicator was re-created by applying a formula to the DepthHouse Trading indicator, an indicator disclosed by oh92. (Thanks for this.)
** See support, resistance, and abbreviation points.
** Support or resistance is based on the closing price of the 1D chart.
** All descriptions are for reference only and do not guarantee a profit or loss in investment.
Explanation of abbreviations displayed in the chart
R: A point or section of resistance that requires a response to preserve profits.
S-L : Stop Loss point or section
S: A point or section where you can buy to make a profit as a support point or section.
(Short-term Stop Loss can be said to be a point where profit and loss can be preserved or additional entry can be made through split trading. It is a short-term investment perspective.)
GAP refers to the difference in prices that occurred when the stock market, CME, and BAKKT exchanges were closed because they are not traded 24 hours a day.
G1 : Closing price when closed
G2: Opening price
(Example) Gap (G1-G2)


MOOON!!!Let's GO!! Look at NEO and other cryptos that have already broken out.
EOS is primed and ready to fly.
(Not financial advice)


1-2, 1-2, 1-2...?I see 3 bullish structures that look nearly identical.
Seeing a lot of 1-2 1-2 setups in the cryptos.
EOS is going to moon. Just wait.
(Not financial advice)

EOS Midterm trade 229% profit plus long trade Mi term and long term trade set ups for EOS.
Buying now would not be a bad idea, the price action has already popped out of the falling wedge consolidation pattern which is a continuation pattern. If we are going up and we break out of a continuation pattern to the upside you should consider the most likely price targets will be in the same direction of the over all trend.
In this chart I have charted a mid term falling wedge pattern bringing the price to $12.51 and a longer term trade of a rounded bottom to the price target of $28.60. The mid term target will be hit between 1-3 weeks, the long term target will be hit between 2-5 months.

EOS:DOWNTREND BEARISH FIBO IDEA|PRICE ACTION|SHORT SETUP 🔔Welcome back Traders, Investors, and Community!
Check the Links on BIO and If you LIKE this analysis, Please support our page by hitting the LIKE 👍 button
Traders, if you like this idea or have your own opinion about it, please write your own in the comment box . We will be glad for this.
Feel free to request any pair/instrument analysis or ask any questions in the comment section below.
Have a Good Day Trading !
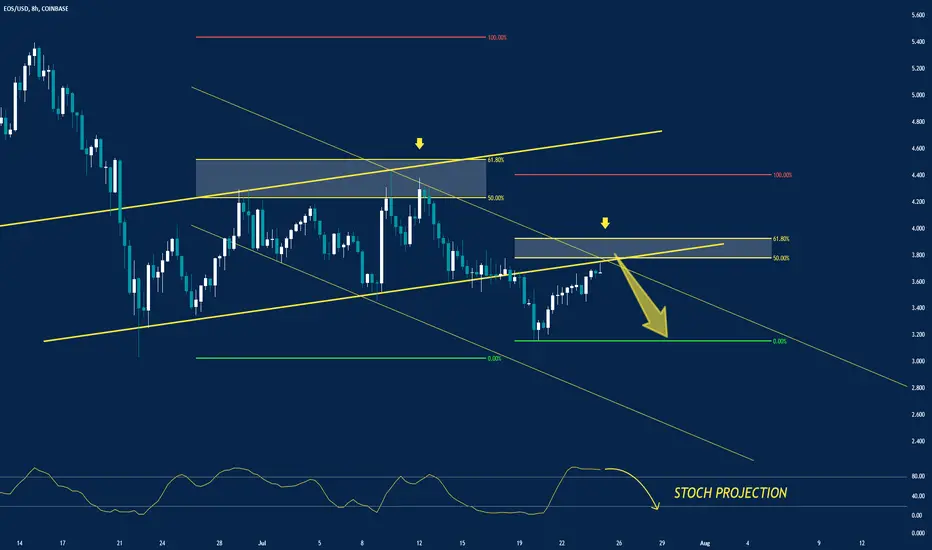

Short Vision on EOS EUR for 23/07/2021Hello Dear Traders,
You find below my analysis for EOS/EUR, the currency pair is in the sell zone. I expect the price to fall. According to my set of rules, in the M30 frame EOS/EUR will fall to 2.78 as I am showing in my chart. Our Daily Goal is 2.7.
Currently, EOS/EUR is moving towards the resistance level of 3 ,where there is some liquidity from this value we are looking for short-term selling opportunities of EOS/EUR.
Good Luck and enjoy your Bearish Market for today.
Entry:@ 2.98
TP1: @2.92
TP2: @2.82
TP3: @2.72
SL : @3.1
As mentioned on previous posting, we oscillate daily with the market based on Human Behavior and Sentiment.
Feel free to share your thoughts and opinions in the comment section below, I will be glad to discuss my friends!
