Eos (EOS) - May 8Hello?
Dear traders, nice to meet you.
By "following" you can always get new information quickly.
Please also click "Like".
Have a good day.
-------------------------------------
(EOSUSD 1W chart)
(1D chart)
We'll have to see if we can get support and climb from 10.1764-10.7363.
If it falls, we need to make sure we get support at 9.05.
It remains to be seen if it can rise above the 12.7530 point, which is an important point.
If you move down at 8.4968, you need a short stop loss.
-------------------------------------
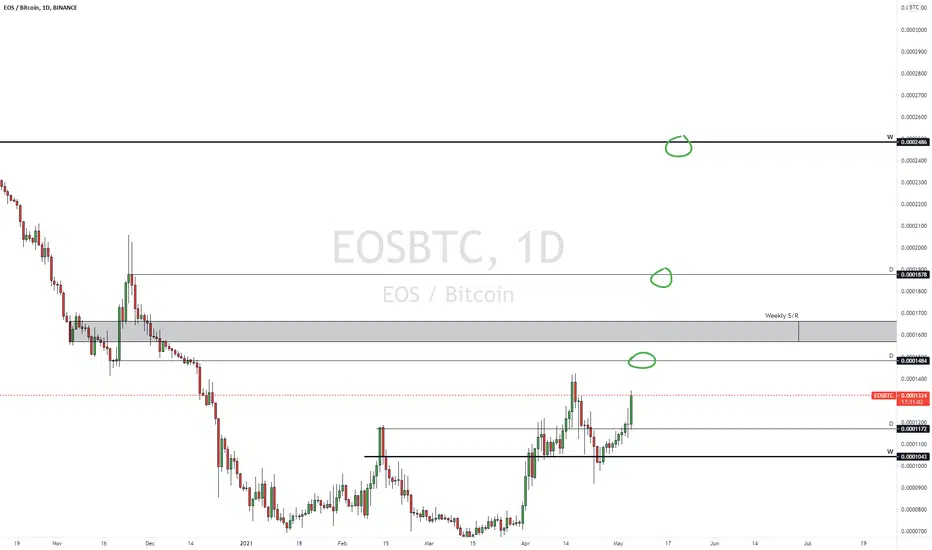
(EOSBTC 1W chart)
(1D chart)
1752 Satoshi-1874 Satoshi should be watched for any movement deviating from the section.
If it falls, we need to make sure we get support in the 1569 Satoshi-1630 Satoshi section.
--------------------------------------
It is advisable to trade at your average unit price.
This is because if the price flows below your average unit price, which was on an uptrend or downtrend, there is a high possibility that you will not be able to earn a large profit due to the psychological burden.
The center of every trade starts with the average unit price you start trading.
If you ignore this, you may be trading in the wrong direction.
Therefore, it is important to find a way to lower the average unit price and adjust the proportion of the investment, so that the money that ultimately corresponds to the profit can regenerate the profit.
-------------------------------------------------- -------------------------------------------
** All indicators are lagging indicators.
So, it's important to be aware that the indicator moves accordingly with the movement of price and volume.
Just for the sake of convenience, we are talking upside down for interpretation of the indicators.
** The wRSI_SR indicator is an indicator created by adding settings and options from the existing Stochastic RSI indicator.
Therefore, the interpretation is the same as the conventional stochastic RSI indicator. (K, D line -> R, S line)
** The OBV indicator was re-created by applying a formula to the DepthHouse Trading indicator, an indicator that oh92 disclosed. (Thank you for this.)
** Check support, resistance, and abbreviation points.
** Support or resistance is based on the closing price of the 1D chart.
** All explanations are for reference only and do not guarantee profit or loss on investment.
Explanation of abbreviations displayed on the chart
R: A point or section of resistance that requires a response to preserve profits
S-L: Stop Loss point or section
S: A point or segment that can be bought for profit generation as a support point or segment
(Short-term Stop Loss can be said to be a point where profits and losses can be preserved or additionally entered through installment transactions. It is a short-term investment perspective.)
GAP refers to the difference in prices that occurred when the stock market, CME, and BAKKT exchanges were closed because they do not trade 24 hours a day.
G1: Closing price when closed
G2: Cigar at the time of opening
(Example) Gap (G1-G2)
EOSUSD

EOS in Bearish ..Opportunity to buy in dipAs per my analysis and historical trend..opportunity to buy EOS in Dip
1st Support- at $9 (Buy here)
if this comes below $9 then,
major support- $ 6.45- Buy here ..safest point.
Soon, this will hit ATH - $18, wait till then

This thing's gonna FLY!!Long term EOS is bound for greatness.
Plus we just moved +12% straight up off of support.
Definitely want to buy a pullback maybe soonish.

EOS BREAKOUT TO NEW ATH 20% MOVEDAYTRADE Setup
Bullish on EOS for another breakout to the upside
Follow info on the chart if you want to take the trade
I personally am bullish but if we do break to the downside
which can happen then I have marked an area where i will be buying
Ensure that you monitor BTC ...Sideways is ok but we all know that a volatile move destroys all setups
Follow and Like for regular analysis ..

$EOS APPROACHING 2018 ATH$23 is the all time high for EOS in 2018
like many cryptos it will become a game of price discovery once the highs are broken
from a fib channel perspective the targets are super interesting
not financial advice

Eos support/resistance line. High potential of stronger uptrendI have drawn the support/resistance lines which will be the most important for the current trend. Predicting a strong uptrend on this crypto based on both the underlying idea as well as the technical analysis.

Eos $10 soon ... Don't sell now✅ Buy: 5.65 - 4.75 ✅
🎯TARGETS:
1- $7.000
2- $10.19
💵 Trade Size: 5-7% of Portfolio
🚫Invalidation(SL): daily candle close below $4.35
Please click LIKE button and Appreciate my hard work.
Must follow me for latest crypto real time updates.
Thank you.

EOS about to hit ATHEOS has been breaking through resistances like there are no such today. EOS is well known to follow the charts. On the bigger time frame I'm expecting that once it hits the ATH there'll be a correction in order to close the gap and then it'll fire up to even greater highs.
This is not a financial advice. Just an idea. Do your own due diligence.

EOS/USDTTrading suggestion:
Don't rush for buying this coin.
it has more long targets if want to reach but first do your risk management and buy in a safe zone!
I have it when it was in 0.37 and sold 50% in 8$ but I want to reject that 50% of profit now! so don't be rush and buy in two-step and set your stop loss 1 and 2 in short term and long term! TP 1 and 2 is suitable for futures fan ...
Send me a message for more futures and spot signals and more profit , to join in my telegram channel
Drop some feedback below in the comment!
Thanks for your attention 🙏!
Trade well, ❤️

#EOSUSD $EOS - EASY ALL TIME HIGH INCOMING! no much words to say. Look at the chart. Drop your idea.


EOSUSDT Broadening WedgeEOSUSDT (DAY CHART) Technical Analysis Update
Broadening Wedge
EOS/USDT currently trading at $10.180
Buy-level: Above $10.00 (only buy if day candle closes above $10.00)
Stop loss: Below $8.40
Target 1: $11.50
Target 2: $13.00
Target 3: $15.00
Target 4: $20.00
Max Leverage: 2X
ALWAYS KEEP STOP LOSS...
Follow Our Tradingview Account for More Technical Analysis Updates, | Like, Share and Comment Your thoughts.

EOSUSDTThe current price: 5.5
SL: around 2
targets for long terms and short terms are defined in the chart

EOS/BTC now 163% up from our entry and still potential 2000%#EOS/BTC profit update:-
#EOS currently trading at 1700 Satoshi
And this is above resistance level.
I am still super bullish on EOSBTC
Now 163% up from our entry zone.
Entry:- 700 Satoshi ✅
TP1:- 1479 Satoshi ✅
TPs :- Waiting
Now Resistance 1 became support level.
I told you #EOS is 2250% potential from my entry level.
Support:- 1500 Satoshi
Resistance:- 2565/4103/7174/10579/19442 Satoshi
My resistance = Targets
I also bought with you when I told you to enter.
Still Holding my #EOS bags.
Please click like button and Appreciate my hard work.
Must follow me for latest crypto real time updates.
Thank you.

EOSUSD - New puppet of ElOnmuSkDear All,
An investor group (actual whales) is sharing that EOS is going to be next pick puppet of Elon Musk and like DOGE has gone 100X in last 5 months, EOS is going to at least 200 USD by end of this year. I don't know if this is FUD but I have put few dollars in EOS in case this comes true.
Technically, EOS is going to 25 USD within this year.
Thanks.
EOSUSD
EOSUSDT
EOS Long
EOS Elon Muck

Here I go long on EOS and EOS will go upHere I go long on EOS. The price is testing the major resistance, so now I go 5x long and the bullish breakout will start. And EOS rocket will launch. See you up there.

EOSUSDTThe chart says it all:
be careful for you long and short positions. Don't FOMO, wait for the best entry.
if the price manages to pass 6.93 and confirms a closure on that area, then you can open long positions.
Good luck 🤞
Comment your ideas and tell your friends. 🔈

EOS Support Zones Tested- Bullish ViewEOSUSDT has tested into old support zones.
The wick here has held. have good RR trade to trade back to 7.90/ 8.40 areas from here with a low risk

$EOS flipped resistance into support and looks great vs $BTCEOS has turned bullish on high timeframes after flipping resistance into support. Stoploss should be set below the recent swing low, and the risk/reward is looking great!

EOS/USDT important spots#EOS #EOSUSDT #EOSUSD #BINANCE #ALTCOINS #CRYPTOCURRENCY #TRADING
this are EOSUSDT important spots.
These are just important points. But my guess is that the 6.4$ range should be the price floor.
However, know where the next point is after each support is broken.
5.7$ should be strong support that if it break next is 4.4$ it is depent just to btc action
7.5$ - 7.9$ It can play the role of temporary and short-term resistance. Perhaps ! dont forget This is not a weekly resistance
Note: The meaning of weekly resistance: resistance is in the weekly chart, not for a week!
target : The main target for the main wave in the current situation seems to be in the range of 11-14 $

