EOSUSD

EOS/USDTTrading suggestion:
If the orange trend breaks the correction will be ended and take an uptrend again but we can buy now .
. if you want to trade in the short term pls use the first stop loss and the first target.
SL= Break below the parallel channel
TP1 = 5
. If you want to invest in the a long term you should take the stop loss around 2.9 - 3.1 and hold it until 14 even or those targets that I determined.
TP2 = 6
TP3 = 7.8
TP4= 14
Your Support is very much appreciated!❤️
Trade well, ❤️

EOS Has a LOT Of Potential In Terms Of % GainsIn terms of percentage gains EOS has a lot to go. We probably wont see prices below $6, maybe even higher, but that is just my opinion from what i see on a chart. Where are at a beginning of a alt season so it is hard to miss a coin that would not have some kind of % gains in it, but to find the right one, you have to look from a bigger perspective so you can see what it has done in the past. History tends to repeat itself so as human psychology imo.
From the chart perspective, 4.236 fib. extension takes us as high as $93, but in my opinion prices between 50 and 70 are more likely to be reached. It could just surprise us all and go even a bit higher than $100, but quite unlikely imo. We first have to break above $8.6 resistence line, from where we were rejected and couldn't reach for almost 2 years now. Breaking above this (blue) line would confirm the explosion in price, but will see.
The predicted price is just a representation from a 2017/18 alt season and does not mean it will go exactly like that.
I am not a financial advisor so don't buy anything that a say. Wish you all successful investment.
BITFINEX:EOSUSD

EOSUSD Triangle pattern forming possible brakeout soonHi guys EOSUSD Triangle pattern forming possible brake out soon, I am leaning towards a long trade but anything could happen in the markets.
Please trade carefully and remember this is not financial advice and I am not your financial adviser, do your own research before investing this is just my opinion.


EOSUSD - 2018 Trend line is breaking out! + NEW BULL MARKET!- This is the last time we see EOS at this price (Last chance to buy cheap)
- The major trendline established in 2018 is breaking up on the weekly timeframe
- If you take a look at EOSBTC weekly chart on Binance, we can see a double bottom pattern established in 9th October 2017
- Another double bottom formation on EOSUSD chart (2018-2020)
- The price is currently breaking up the local bullish rectangle pattern!
- We have a biggest weekly volume candle in History 🎈
- RSI indicator is printing an ascending triangle pattern
- This is great news for all EOS bulls, buy as soon as possible!
- Expected duration of the trade, Stop Loss, Profit Target, Entry Price and Risk To Reward Ratio - for more information, please check my signature below ↓
- Hit "Like" & "Follow". Don't miss my upcoming updates and new ideas!


EOS/BTC still 2000% potential from here so good time to entry..?#EOS/ BTC TA Update:-
Many Followers drop message about EOS/BTC so Again I am posting EOS Chart.
#EOS/ BTC currently trading at 710 Satoshi.
And before some days it was dumped till 660 Satoshi.
I am expecting very big move from here.
Last chart was also valid. Its not mean old is not valid.
This is best entry so I posted chart now.
Be frank My Target is minimum 2000% in few months.
Entry:- 600-700 Satoshi
Resistance :- 1479/2565/4103/7174/10579/19442 Satoshi
Stop Loss:- according to me no need for stop loss.
Resistance = Targets
Please Click LIKE button and appreciate my hard work.
Don’t forget to follow me for Quality Updates.

EOS FAILING AT 55M SUPPLY AFTER TESTING WEEKLY SUPPLY MID FEB.EOS/USD IS FAILING FROM 55M SUPPLY @4.35-4.50$ THAT FORMED FEB 21ST ~20:30 PST COMING INTO THE NEW WEEK. THIS IS AFTER EOS TESTED WEEKLY SUPPLY WEEK ENDING FEB. 15. SO HERE'S WHERE PATIENCE COMES INTO PLAY! IF YOU DIDN'T SELL AT WEEKLY SUPPLY (5.56-6.17$) THEN YOU MUST WAIT FOR NEW SUPPLY TO FORM ON LOWER TIMEFRAMES. THEN WAIT FOR PRICE TO TEST THAT NEW SUPPLY, AND IN THIS CASE ABOUT A MONTH IN TOTAL OF SITTING ON HANDS. BUT PATIENCE PAYS! RISKING .15 VERSUS .60 WILL KEEP YOU SANE AND SOLVENT HAHA.
IN REGARDS TO TARGETS: TAKE OFF 1/3 OF POSITION DEPENDING ON STRAT STYLE @ OPPOSING DEMAND (AROUND 3.85$) WHICH PRICE TRADED SMARTLY THERE AROUNF ASIA OPEN. THE REMAINING TARGET(S) IS(ARE) PREVIOUS PIVOT LOW AROUND 3.25$ (COVER @3.35 FOR 6.67R!); COVER REMAINING 1/3 POSITION AT WEEKLY PIVOT LOW BELOW 2$! SO TO SUMMARIZE: T1 @ OPPOSING TIMEFRAME DEMAND (I.E 55M); T2 @ DAILY; T3 @ WEEKLY.
LAST WORDS: IF PRICE CONTINUES TO RESPECT THE WEEKLY SUPPLY AND WE TRUST THE DYNAMICS OF SUPPLY AND DEMAND THEN PRICE OF EOSUSD COULD POSSIBLY TRADE BACK DOWN TO 1$ BOB! AT THE LEAST, IF THE BEARISH FLAG FORMING ON DAILY COMES TO FRUITION AND WE PLACE A MEASURED MOVE OF THAT PATTERN PLAYING OUT, THEN WE CAN SEE 2$.
P.P.S: I DON'T UNDERSTAND AND PROBABLY NEVER WILL UNDERSTAND THE FUNDAMENTALS OF CRYPTO "CURRENCIES". THIS ANALYSIS IS PURELY TECHNICAL USING THE ELEMENTS AND FORCES OF SUPPLY AND DEMAND.
HAPPY TRADING,
TRANQUILTIMETRADER

Eos (EOS) - March 15Hello?
Dear traders, nice to meet you.
By "following" you can always get new information quickly.
Please also click "Like".
Have a good day.
-------------------------------------------------- -----
You should watch for any movement that deviates from the 3.7849-4.0849 section.
In particular, it remains to be seen if it can rise along the uptrend line (2).
If you fall from the 3.7849 point, you can touch the 2.8250 point, so you need a Stop Loss to preserve profit or loss.
Break above 4.0849 and climb over 4.7538 points to see if we can stock up on new strength.
-------------------------------------------------- -------------------------------------------
** All indicators are lagging indicators.
So, it's important to be aware that the indicator moves accordingly with the movement of price and volume.
Just for convenience, we are talking upside down for interpretation of the indicators.
** The wRSI_SR indicator is an indicator created by adding settings and options from the existing Stochastic RSI indicator.
Hence, the interpretation is the same as the traditional Stochastic RSI indicator. (K, D line -> R, S line)
** The OBV indicator was re-created by applying a formula to the DepthHouse Trading indicator, an indicator that oh92 disclosed. (Thank you for this.)
** Check support, resistance, and abbreviation points.
** Support or resistance is based on the closing price of the 1D chart.
** All explanations are for reference only and do not guarantee profit or loss on investment.
Explanation of abbreviations displayed on the chart
R: A point or section of resistance that requires a response to preserve profits
S-L: Stop Loss point or section
S: A point or segment that can be bought for profit generation as a support point or segment
(Short-term Stop Loss can be said to be a point where profits and losses can be preserved or additionally entered through installment transactions. It is a short-term investment perspective.)
GAP refers to the difference in prices that occurred when the stock market, CME, and BAKKT exchanges were closed because they do not trade 24 hours a day.
G1: Closing price when closed
G2: Market price at the time of opening
(Example) Gap (G1-G2)

EOS - 4h. We expect the price to rebound by 26% upwardsPatience, faith and passive defense. It is these three concepts that perfectly characterize EOS buyers. Over the past two weeks, the EOS market has had a difficult time . On February 22-23, the price of EOS fell by almost 40% . This event took place after an unsuccessful attempt by buyers to update the local maximum on February 19. In the previous idea , we expected such a scenario.
Sellers have carefully made sure that buyers will no longer have the strength to continue the trend. You can see it on the chart on February 20 and 21:
As you can see, only after 3 unsuccessful attempts by buyers to prolong growth, sellers became more active.
The current wave of decline is coming to an end. The falling momentum has moved to consolidation and now there is a high probability of a rebound in the price of EOS by 26%. The first local critical point is $3.92. The global goal of this idea is in the range of $4.4-4.5 . Two scenarios are possible from this range. Therefore, after reaching the EOS price of this mark, we will create a new idea.
________________________
We create both short-term ideas (for a local understanding of the market situation) and medium-term forecasts of price movements.
Subscribe to us and get daily concise analytics!


$EOS is almost ready for BreakoutIt's now way to complete Ascending Triangle Pattern.
I'm expecting breakout will happen within next 24hr - 48hr max.
Then my primary target is at least 30% from the Current Price.


EOSUSD Ascending TriangleResistances: $4.100, $4.500
Supports: $3.870, $3.700
The analysis I make is just an idea not an investment advice. Please manage your risk while trading and please make your investment decisions only by yourself.

EOSUSD D4: 600% gains BEST LEVEL TO BUY/HOLD(SL/TP)(NEW)Why get subbed to me on Tradingview?
-TOP author on TradingView
-15+ years experience in markets
-Professional chart break downs
-Supply/Demand Zones
-TD9 counts / combo review
-Key S/R levels
-No junk on my charts
-Frequent updates
-Covering FX/crypto/US stocks
-24/7 uptime so constant updates
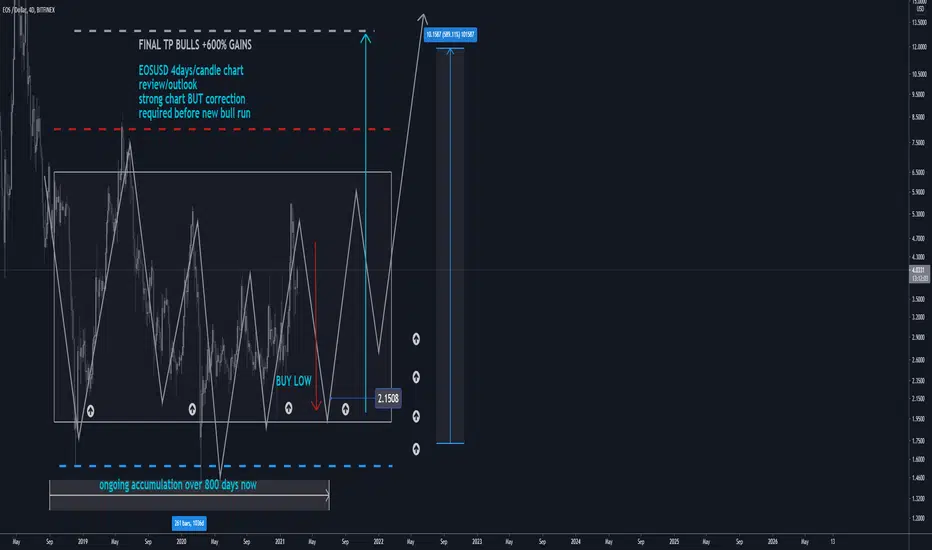
EOSUSD D4: 600% gains BEST LEVEL TO BUY/HOLD(SL/TP)(NEW)
IMPORTANT NOTE: speculative setup. do your own
due dill. use STOP LOSS. don't overleverage.
🔸 Summary and potential trade setup
::: EOSUSD 4days/candle chart review
::: accumulation in progress now
::: long-term accumulation over 800 days
::: expect strong move off the lows
::: bullish sequence (not Elliott Wave )
::: chart looks strong
::: get ready to BUY LOW later
::: BUY LOW near 2.00/2.20 USD
::: entry - April 2021
::: up to 600% gains possible later
::: short-term pullback/correction
::: correction/pullback NOW
::: however chart looks strong
::: SPECULATIVE SETUP
::: do your own due dill
::: and use proper risk management
::: TP bulls is +600% gains
::: details: see chart
::: FINAL TP is 600% gains
::: recommended strategy: BUY/HOLD after pullback
::: TP BULLS +600% gains
::: SWING TRADE: BUY/HOLD IT
::: bull run not over yet
::: good luck traders!
::: BUY/HOLD and get paid. period.
🔸 Supply/Demand Zones
::: N/A
::: N/A
🔸 Other noteworthy technicals/fundies
::: TD9 /Combo update: N/A
::: Sentiment mid-term: BULLS
::: Sentiment short-term: PULLBACK/CORRECTION NOW
RISK DISCLAIMER:
Trading Crypto, Futures , Forex, CFDs and Stocks involves a risk of loss.
Please consider carefully if such trading is appropriate for you.
Past performance is not indicative of future results.
Always limit your leverage and use tight stop loss.

#EOS possible targets for 2021#EOS possible targets for 2021
Unlike many market currencies, EOS is generally moving Sideways, and as a result, high targets for this currency may not be possible. The most likely targets are Targets 1 to 3.
target1: 5.9 $
target2: 8.2 $
target3: 12.8 $
target4: 23 $
stop loss: 3$

EOS is ready to fly BINANCE:EOSUSDT
I was tracking this chart past few weeks and now, After a long accumulation EOS broke out its resistance Channel with strong volume which is very important confirmation to open a position
i highly recommend this pair for medium-long term hold
Always Make it simple chart doesn't need to be complicated
Peace ✌🏼

EOS Chart ArtA bit of an abstract idea for EOS
Its sitting on a really strong and established support level
In this current bull market, I wouldn't be surprised to see this break-out from here

