EOSUSD

EOS going to test range resistanceHas been in a range since 2020 between 2.4 and 3.9. Breakout will send it to 5.9.


EOS LONG. BREAKOUT INC. BREAKOUT COMING, CANDLE MUST CLOSE OUTSIDE OF TRIANGLE ON THE WEEKLY (TODAY IS FRIDAY)
IF WE DO INDEED SEE A BREAKOUT, I AM EXPECTING A RETEST AT THE 3.20 RANGE ON THE NEXT WEEKLY CANDLE (FRIDAY WOULD BE 2/12) BEARISH CANDLE CLOSE. IF THIS CANDLE CLOSES BEARISH ON THE WEEKLY ON THE 2/12, WE ARE EXPECTING IT TO FILL THE RANGE AT 22$ PER, CURRENTLY 1:7 ON YOUR RETURN. AND MORE THAN LIKELY HIGHER.

EOS - 4h. The next target - $3.92If you are an EOS investor you remember well the market situation on January 10th . After a successful attack by buyers and great prospects for continued growth, the price of EOS turned sharply and in large volumes fell to $2.38. In two days, the EOS market fell by 40% .
The main problem is in the mark of $3.92 . In the previous idea, we wrote about global consolidation, from which the price of EOS can not come from April 2020. Buyers have already made 3 attempts to break through this mark and so far to no avail.
After a sharp drop in EOS on January 10, buyers managed to slow down the price and start accumulating strength for a new trend. Fixed above the mark of $2.91 , buyers gave a new signal to continue rising prices. At the moment, buyers have broken the local level of $3.07 and are preparing for a strong upward momentum with an ultimate goal of $3.91.
While the mark of $2.91 under the power of buyers, we expect continued growth.
_______________________
We create both short-term ideas (for a local understanding of the market situation) and medium-term forecasts of price movements.
Subscribe to us and get daily concise analytics!


poor eos ppl been waiting so long for it to move some wherepoor eos ppl been waiting so long for it to move some where


EOS/USDT LIMIT BUY SIGNALThe trend might continue without the correction, but if there will be one, certainly I am interested to buy it.

EOS/USDT BUY SIGNALI've missed the entry for the EOS buy signal. But still wanted to share it with you.

EOSUSDTHello,
EOSUSD seems to be in an interesting area, We need to get some volume on that and we might jump to the next levels ... Still way to go to the ATH.

eos shortSoon, according to the previous trend, eos will have a crash, which can be done with eosDOWNUSDT

EOS/BTC strong recovery can start here EOS / BTC
Few days ago i sent signal in EOS against USD
Now Looking at chart with BTC :
Eos in All time low support Against BTC Which mean a Strong recovery can start from here
Keep your eye on it
Wish you best

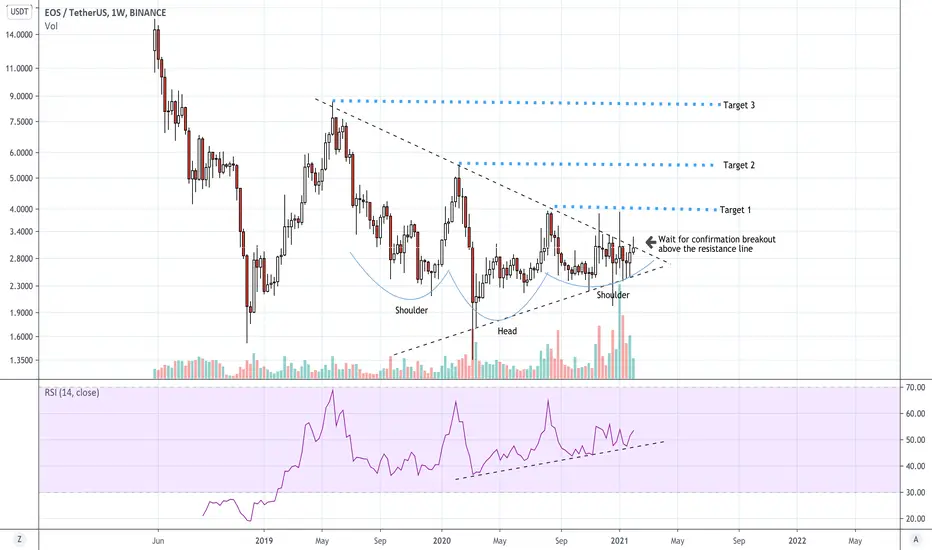
EOS / USDT about to enter it's expansion phase (weekly analysis)We are monitoring EOS / USDT on the weekly time frame since a long time now and it seems that the time of truth is coming ...
As we saw, many things are telling us about what's coming... and it will be explosive
- I believe that EOS is arriving at the end of a long accumulation phase, with a reversal pattern ( Inverted HS)
- A long accumulation phase means a long expansion phase
- Since 3 weeks, EOS has been ranging wildly in order to discouraged the last sellers on the market, now we can see on the VPA analysis that the sellers are slowly capitulating... And the equilibrium is shifting in advantage of the bulls.
- RSI is forming a W and entering the bullish zone.
I believe the breakout is close !
You can either enter now during the accumulation phase if it's long term position, or after the breakout if you do lev trade ...
This market benefits the most patient ones ... so no rush !
The content covered in this publication is NOT to be considered as investment advice.
Thank you all,
If you enjoyed this analysis please mark a thumbs up and do not hesitate to share your point of view in the comment section.
Have a Good day and Safe trade
Butterfly .D
/Metamorphose your portfolio/

EOS LongNever chart alts as used to just holding bags for a period of time based on projects I like. I will however admit I am holding heavy bags of EOs since 2017 (who isn't) bit finally I think the beast is waking. Strong push to 5 dollars lets see how thigs go if it can get there.

EOSUSDT UPDATE!!!Hi Traders,
EOS is currently breaking weekly structure. This is a great bullish signal.
Thanks
The Market Sniper Team

EOSUSD H16: Best level to SHORT IT 25%/35% gains(NEW)EOSUSD H16: Best level to SHORT IT 25%/35% gains(NEW)
IMPORTANT NOTE: speculative setup. do your own
due dill. use STOP LOSS. don't overleverage.
Tagged LONG because I expect strong BOUNCE
off the lows, HOWEVER read entire idea
before executing. DO NOT market BUY now.
🔸 Summary and potential trade setup
::: EOSUSD 16hours/candle chart review/outlook
::: SHORT at market
::: upside limited from here
::: SHORT/HOLD setup for 25%/35% gains
::: just hit heavy overhead resistance
::: + ETHUSD will DUMP soon
::: key S/R level (4 reversal)
::: SHORT HOLD setup for BEARS 25%/35% gains
::: expecting target to get hit
::: within 1-2 weeks
::: 25%/35% gains possible for SHORT/HOLD
::: this is SHORT/HOLD Setup
::: for patient traders only / no fast gains here
::: good luck traders
🔸 Supply/Demand Zones
::: N/A
::: N/A
🔸 Other noteworthy technicals/fundies
::: TD9 /Combo update: N/A
::: Sentiment short-term: BEARS/25% gains
::: Sentiment outlook mid-term: BEARS/25% gains

forgotten EOSWhile all the attention is on the DeFi market, you can pay attention to the good old platform tokens!
Very good price both in dollars and bitcoins.

$EOS 5th touch rule breakoutAfter seeing $EOS consolidate for weeks in the black box, it has finally broken out and successfully retested the box.
I did some calculations to predict the breakout time, the targets are on the chart.
Take profit accordingly, move SL to profit once TP1 is reached!

EOS can comeback to the gameatfirst , check related idea , now as you can see, weekly eos/btc pair is on strong support , a lots of coins and tokens lost supports against bitcoin but eos can hold it if bitcoin
allow it , also eos dominance is on strong daily support , lets see how it reacts

Eos (EOS) -January 31Hello?
Dear traders, nice to meet you.
"Like" is a huge force for me.
By "following" you can always get new information quickly.
Thank you for always supporting me.
-------------------------------------------------- -----
We need to see if we can get support at the 2.8250 point or the downtrend line (3) and move above the 3.0339 point.
If you get support above the 2.8250 point, I think there's a good chance there will be further gains.
Accordingly, it remains to be seen if there can be any movement touching the uptrend line (2).
If you fall from the 2.8250 point, you need a short stop loss.
The critical resistance range is the 3.7849-4.0849 range.
-------------------------------------------------- -------------------------------------------
** All indicators are lagging indicators.
So, it's important to be aware that the indicator moves accordingly with the movement of price and volume.
Just for convenience, we are talking upside down for interpretation of the indicators.
** The wRSI_SR indicator is an indicator created by adding settings and options from the existing Stochastic RSI indicator.
Hence, the interpretation is the same as the conventional stochastic RSI indicator. (K, D line -> R, S line)
** The OBV indicator was re-created by applying a formula from the DepthHouse Trading indicator, an indicator that oh92 disclosed. (Thank you for this.)
** Check support, resistance, and abbreviation points.
** Support or resistance is based on the closing price of the 1D chart.
** All explanations are for reference only and do not guarantee profit or loss on investment.
Explanation of abbreviations displayed on the chart
R: A point or section of resistance that requires a response to preserve profits
S-L: Stop Loss point or section
S: A point or segment that can be bought for profit generation as a support point or segment
(Short-term Stop Loss can be said to be a point where profits or losses can be preserved or additionally entered through installment transactions. It is a short-term investment perspective.)
GAP refers to the difference in prices that occurred when the stock market, CME, and BAKKT exchanges were closed because they do not trade 24 hours a day.
G1: Closed price
G2: Market price at the time of opening
(Example) Gap (G1-G2)

$EOS.X price prediction.EOS is a great coin with a lot of future and should be considered a long term investment. But looking at the hourly charts, we have been always struggling to maintain $3 line. Every time we hit the red line we get pushed back to $2.51 support line. This time, if we get rolled back and go back up to test $3 resistance, its highly probable that we surpass it and stop at around $3.3. I'm not sure if we be able stabilize and flip $3 line though, specially because it has never happened before, but who knows, we might do it this time. Let's see how this chart moves during the weekend. I will send an update once we hit my targets during the weekdays.
