EOSSUD completed Cypher move | Upto 52% expectedHi friends hope you are well, and welcome to the new update on EOS coin.
On the 2-day chart, the price action of the EOS has completed final leg of bullish Cyhper and entered in potential reversal zone.
Buying and sell ranges:
The buying zone starts form 0.618 to 0.786 Fibonacci levels, and the sell zone can be the Fibonacci projection between 0.382 to 0.786 .
Stop loss:
The maximum extent of potential reversal zone at 0.786 Fib level can be used as stop loss.
Possible profit and loss ratio:
As per the above targets, this trade has a profit possibility of 52%, and the loss possibility is 12.5%.
Note: Above idea is for educational purpose only. It is advised to diversify and strictly follow the stop loss, and don't get stuck with trade.
EOSUSD


Top 4 ALTCOINS that retested on the last BTC dumpWe can say that todays dump made some of us sweat a bit.
Last week we had a lot of altcoins breakout. They were for most on the 4h and daily time frame.
Wich means it takes a bit of time to develop.
Today the king made them retest in a big way. And they held the trend!
Here is my top 4 of altcoins that broke out and retested AND are ready to fly.
IF it holds, IF the king doesnt continue down, IF god is with us!
Trade safe, tight SL.

EOS (EOS) - January 12Happy New Year!!!
Dear traders, nice to meet you.
"Like" is a huge force for me.
By "following" you can always get new information quickly.
Thank you for always supporting me.
-------------------------------------------------- -----
We have to see if we can ascend above 2.8250 points.
If it falls from the 2.1243 point, a Stop Loss is required to preserve profit and loss.
It remains to be seen if it can break above the downtrend line (3).
-------------------------------------------------- -------------------------------------------
** All indicators are lagging indicators.
So, it's important to be aware that the indicator moves accordingly with the movement of price and volume.
Just for convenience, we are talking upside down for interpretation of the indicators.
** The wRSI_SR indicator is an indicator created by adding settings and options from the existing Stochastic RSI indicator.
Hence, the interpretation is the same as the traditional Stochastic RSI indicator. (K, D line -> R, S line)
** Check support, resistance, and abbreviation points.
** Support or resistance is based on the closing price of the 1D chart.
** All explanations are for reference only and do not guarantee profit or loss on investment.
Explanation of abbreviations displayed on the chart
R: A point or section of resistance that requires a response to preserve profits
S-L: Stop Loss point or section
S: A point or segment that can be bought for profit generation as a support point or segment
(Short-term Stop Loss can be said to be a point where profits or losses can be preserved or additionally entered through installment transactions. It is a short-term investment perspective.)
GAP refers to the difference in prices that occurred when the stock market, CME, and BAKKT exchanges were closed because they do not trade 24 hours a day.
G1: Closed price
G2: Cigar price when opening
(Example) Gap (G1-G2)

EOSUSD 4D: BEST Level to SHORT IT 20%+ gains(SL/TP)(NEW)EOSUSD 4D: BEST Level to SHORT IT 20%+ gains(SL/TP)(NEW)
IMPORTANT NOTE: speculative setup. do your own
due dill. use STOP LOSS. don't overleverage.
Tagged as SHORT as I expect correction soon.
🔸 Summary and potential trade setup
::: EOSUSD 4days/candle chart review
::: 3.50 heavy key S/R level
::: heavy rejection at key S/R level
::: chart looks weak / not stable
::: expecting more losses short-term
::: recommend to re-short into bounce
::: BEARS will target recent cycle lows
::: TP Bears is 1.64 USD
::: targets price is key horizontal S/R
::: get ready to short into BOUNCE
::: best reload BEARS near 3.00
::: recommended strategy: SHORT IT 3.70
::: TP1 +20% gains TP2 +25% gains
::: short 3.00 / short rallies/rips
::: SWING TRADE: SHORT/HOLD IT
::: correction not over yet
::: good luck traders!
::: SHORT and get paid. period.
🔸 Supply/Demand Zones
::: N/A
::: N/A
🔸 Other noteworthy technicals/fundies
::: TD9 /Combo update: N/A
::: Sentiment mid-term: BEARS
::: Sentiment outlook short-term: BOUNCE POSSIBLE

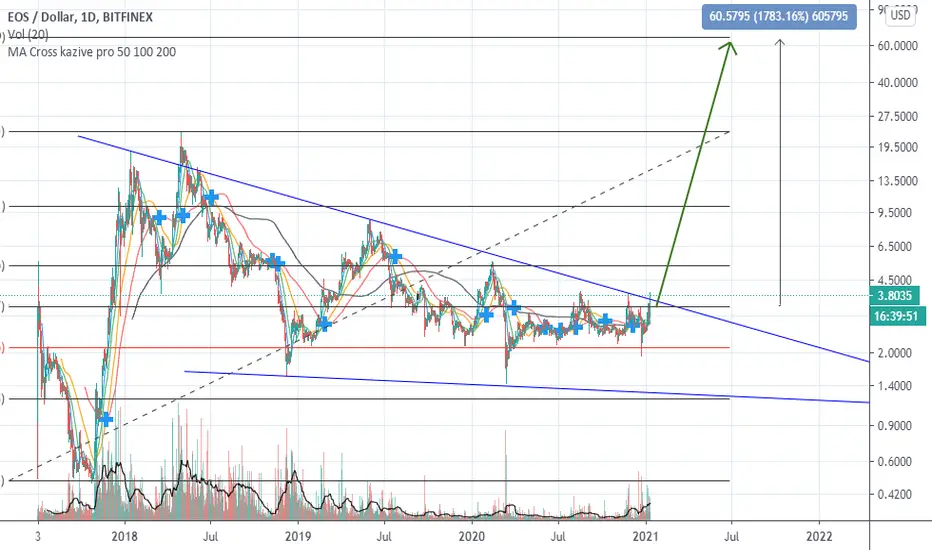
EOS EOSUSD - 2018 Trend line is breaking out! + New bull market- The major trendline established in 2018 is breaking up on the weekly timeframe
- If you take a look at EOSBTC weekly chart on Binance, we can see a double bottom pattern established in 9th October 2017
- Another double bottom formation on EOSUSD chart (2018-2020)
- The price is currently consolidating in the local bullish rectangle pattern
- We have a biggest weekly volume candle in History 🎈
- RSI indicator is printing an ascending triangle pattern
- This is great news for EOS bulls, buy breakout above 4 USD
If you want more of these ideas, hit the like button and follow me, so you don't miss any update!
Also, check my signature down below ↓

EOSUSDT Price Outlook 11 January 2021 — EOS SIDEWAYSHello, in this short video review, we looking at Daily, 4H and 1H timeframes for EOSUSDT.
Price fall from 3.9 resistance and now located at lower support bound in 2.5-2.3 region.
Looking forward sideways action in next 24-48h, will update on possible setups.
Like and subscribe appreciated!
0

EOS-4h. Aggressive sales and critical range $2.55-2.75.The situation on the EOS market has changed dramatically.
The positive dynamics of the EOS did not help the price to consolidate outside the global trend line. Buyers lost $3 . This mark was the critical point for reaching the $5 mark .
Thus, the price of EOS returned to the limits of global consolidation and the black channel of growth.
Now sellers are trying to break the range of $2.55-2.75 . After such a sharp drop in increased volumes, we do not expect a sharp rebound in prices. The best scenario for buyers is to continue consolidating in this range for the $3 test. From the nature of the EOS price increase, it will be clear whether to expect the rally to resume with a target of $5.
Weakness of buyers in the range of $2.55-2.75 will again bring the price of EOS to the lower limit of consolidation of $2.31 . The global target is at 1.85.
_________________________
We create both short-term ideas (for a local understanding of the market situation) and medium-term forecasts of price movements.
Subscribe to us and get daily concise analytics!

HOLD YOUR EOSas soon as breaking the resistance line, EOS's rally begins!
let me know what are you thinkig


STRONG Bullish Divergence on RSIHey traders! I just longed EOS here at $2.93 based on strong bullish divergence building. Not financial advice, do your own research. I just noticed this and wanted to kick it out.


EOS/USD Breakout. The best risk defined setup of 2021.BITFINEX:EOSUSD
🚨Please LIKE & SHARE THE LINK if you find this usefull!!🚨
In a previous idea I was asked if I could explain my procedure to enter a trade and that I will try to do here.
I had an earlier idea about this triangle formation that got deleted, but after months of waiting, I can begin to say that the breakout is here and it came just as planned.
🟠 ENTRY
We're looking for a daily close above trendline and then a following retest for confirmation of resistenace turned to support to enter. anything arround $3.35 would be perfect to me, but the upside is so masive that it doesn´t really matter much. Even when trading breakouts, a risk defined setup is very important, and therefore, I will use a stop loss in the invalidation zone (where the trade is no longer valid) and a series of take profits in trouble areas (mainly zones where a reversal might ocurr).
🟠 STOP LOSS
Conversly, the best place for SL is below the lowest swing arround $ 2.87 before breakout.
🟠 TAKE PROFIT
Take profits are split into three:
1. Surround the previous swing high (daily close). $ 8.47
2. Arround the BITFINEX:EOSUSD all time high highest daily close. $ 17.64
1. At the top of the channel of current daily bar. (Assuming cyclical repetition)
🟠POSITION SIZE
Position size depends a lot on the trader, but in my case I assign a risk percentage of my portfolio to every trade, meaning that if my portfolio is $100, and my risk tolerance is 5%, I will allocate $5 of risk to the trade. THIS IS NOT POSITION SIZE. Position Size is calculated by dividing the risk ammount ($ 5) by the distance in percentage to the stop loss from the entry.
Let's say I buy at $ 3.35 and my risk ammount is $ 5 and my stop loss is $ 2.87, that is, -14.4% below. BITFINEX:EOSUSD
POSITION SIZE = (RISK AMMOUNT) / (DISTANCE TO STOP LOSS)
POSITION SIZE = ($ 5) / (0.144) = $ 34.7
I´ll keep you updated on this trade.
** This is not financial advice, trade at your own risk **

EOS/USDT TA Update Analysis ( EOS Ready for $10..? )#EOS/USDT TA Update:-
#EOSUSDT currently trading at $3.15
Now breakout as per chart.
So I can expect supper bullish EOS.
Entry:- $2.8-$3.15
Targets:- $5.45/$7.32/$10.65
Stop loss:- below support I will exit.
Please click LIKE button and Appreciate my hard work.
Must follow me for latest crypto real time updates.
Thank you.


EOS/USDT Possible Short TradeAfter rejecting the resistance zone of 3.8 for the 4th time, with a bearish engulfing candle, EOS is making its 4th touch on an ascending channel and might break it to the downside.
-RSI is making a bearish divergence;
-If the ascending channel is broken, the next target should be the Support Zone around 2.3;
-For a safer entry, wait for the break of the channel and 50 EMA and get in on the retest.
Remember this is not financial advice.

EOS - an opportunity for BUYERS during the correctionEOS has made a massive movement to the previous HIGH. SO now we have a double top at $3.8868 and price correction.
If you want to open long positions, wait for the better price. But be aware of stepping out of the growing channel.
EOS PRICE TARGET IS $5.415
Here you have entry levels for EOSUSD:
$3.4504
$3.2692

BLOXTOPS*ALERT \\ ETH COMP// WATCH CLOSELY AS EOS SOARS TO $14! BITSTAMP:ETHUSD
BITFINEX:EOSUSD
COINBASE:EOSUSD is trailing an estimated 90 days behind ETHER.
Given this assumption we shall experience similar price volatility to the upside, just as COINBASE:ETHUSD NYSE:ETH

BLOXTOPS*ALERT \\ WATCH CLOSELY AS EOS SOARS TO $14!BLOX CALLS TOPS... and apparently bottoms, yet again!
Just take a glance at our bitcoin projections in 2019-2020!
COINBASE:EOSUSD projected to break $5 by March 2021.
Good luck.

EOSUSDT (Weekly chart) Trend line Breakout#EOSUSDT (Weekly chart) Technical Analysis Update
Trend line Breakout
EOS/USDT currently trading at $3.60
Long Entry-level: $3.00 to $3.50
STOP LOSS: below 2.48
Resistance level 1 (Target 1): $5.50
Resistance level 2 (Target 2): $8.70
Max leverage: 2x
ALWAYS KEEP STOP LOSS...
Follow our Tradingview Account for more Technical Analysis Update, | Like, Share and Comment your thoughts.

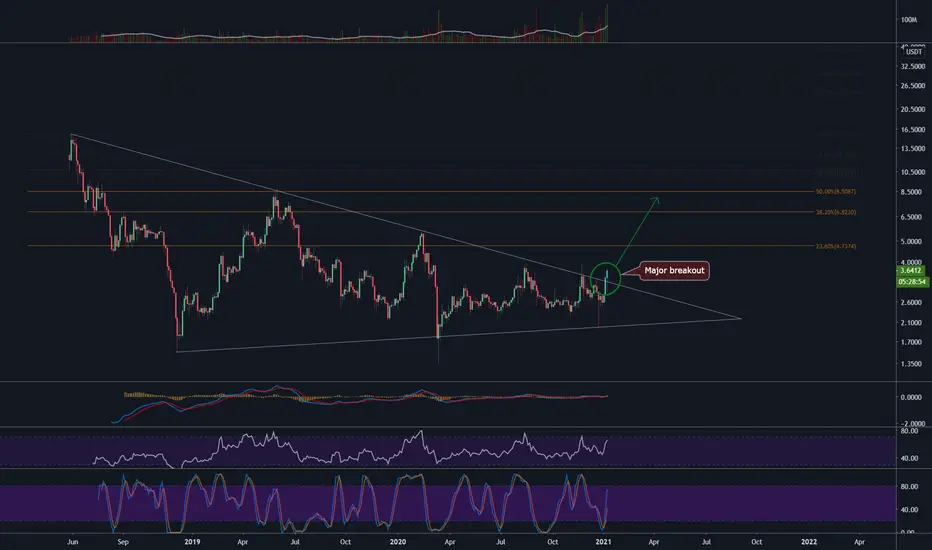
EOS/USD - Major breakout, $5 and $7 nextEOS is similar to ETC with a major breakout of long term resistance!
A clear long opportunity towards $5, $7-8 and beyond. We also retested the resistance which now turned support. We're cleared for higher levels.
Like and follow!