Full-fledged uptrend begins: above 1.870Hello traders!
If you "Follow" us, you can always get new information quickly.
Please also click “Boost”.
Have a good day.
-------------------------------------
(EOSUSDT chart)
The biggest drawback of EOS is that it failed to expand the coin ecosystem.
If the existing community is functioning properly, I think there is a possibility of maintaining the current coin ecosystem.
However, since it is unlikely that additional tokens will be issued to networks that fail to expand the coin ecosystem, it is expected that the coin ecosystem will gradually decrease.
It is necessary to confirm whether there are any moves by the foundation to expand the EOS coin ecosystem in the future.
(1M charts)
In order to see a full-fledged upward trend, I think the price must rise above the MS-Signal indicator and maintain the price.
However, since the currently formed box range is between 1.870 and 40169, the key is whether it can rise above 1.870 unless the box range is formed again.
(1W chart)
In order to rise from the bottom, the price needs to rise above at least 1.331 and hold there.
Accordingly, the key is whether it can receive support above 0.842 and rise above 1.003.
(1D chart)
From a short-term perspective (1D), a volume profile section is formed at point 1.1.
Accordingly, the key is whether the price can be maintained by rising above 1.003-1.1.
As explained in the 1M chart, it is expected that it will completely break out of the bottom zone only if it rises above the 1.870 point, and there is a possibility that a full-fledged upward trend will begin.
If it falls below 0.763, there is a high possibility of entering the bottom again, so caution is required when trading.
--------------------------------------------------
- The big picture
The full-fledged upward trend is expected to begin when the price rises above 29K.
This is the section expected to be touched in the next bull market, 81K-95K.
-------------------------------------------------- -------------------------------------------
** All explanations are for reference only and do not guarantee profit or loss in investment.
** Trading volume is displayed as a candle body based on 10EMA.
How to display (in order from darkest to darkest)
More than 3 times the trading volume of 10EMA > 2.5 times > 2.0 times > 1.25 times > Trading volume below 10EMA
** Even if you know other people’s know-how, it takes a considerable amount of time to make it your own.
** This chart was created using my know-how.
---------------------------------
EOSUSD

EOS my first big targetIf we look at weekly timeframe, EOS already broken falling wedge pattern
profit target from this pattern is very far at 1.925
but we also have fibonacci 50% at 1.222 as previous resistance
At daily timeframe, NYSE:EOS also perform a nice and strong channel up pattern
target from this pattern at channel up resistance, around 0.923
If we look at hourly timeframe, eos also perform a very trong bullish with curvey wave
nearest target for eos at previous high at 0.843


EOSLooks like this coin is about done selling off. I see a large ABC retracment coming into 2024. Could even become impulsive. Alerted this one in my group

EOS EZ Short Term Long Setup Easy short-term Long position Entered
EOSUSD Target 1.85-2$
STOP LOSS: 1.10 - 1.05$
Cheers, enjoy these gifts

EOS trade idea : A 20X Trade Opportunity!"🚀 Are you ready for a trade that could potentially 20X your investment? In this video, we dive deep into the world of EOS, a cryptocurrency with immense potential. We'll explore the fundamental analysis, technical indicators, and market sentiment surrounding EOS, giving you all the insights you need to make an informed decision.
📈 Whether you're a crypto enthusiast or a seasoned trader, this EOS trade idea could be your ticket to significant gains. Don't miss out on this exciting opportunity – watch the video, stay informed, and make your next move in the crypto market a profitable one! 💰💎 #EOS #CryptoTrading #InvestingOpportunity #bitcoin

EOSUSD ❕ bearish takeoverEOS broke down through 200EMA (4H TF)
RSI is in the sellers zone at 4H TF.
The asset has fixed under 50EMA (30m TF)
I believe that the asset will continue to decline after fixing under the support level.

EOSUSD ❕ tests the supportEOS tests 50EMA as support (1H TF)
The asset continues to move near the support level.
I believe that the asset may bounce from the current level.

EOSUSD ❕ broke up the resistanceEOS fixed above 50EMA (1H TF)
50EMA broke above 200EMA (30m TF)
Trading volume indicates market interest in a price bounce.
RSI is moving in the bullish zone.
I believe that the asset will continue to rebound after fixing above the resistance level.

EOS showing a very impressive investment opportunityHi Everyone;
today we have one of the best risk to reward Investment opportunity
it is more than 3730 times the risk and the chart is look very promising.
I expect breaking the previous bear market key point will clear the way to the final target

The probability of falling is higher for EOSThe EOS currency has exited the upward channel and now it has the possibility of pulling back to this channel, so the important range is marked in the green box, if it can break this range, we can hope for the growth of this currency. that this range of support is specified for this digital currency

EOS long term 📌 analysis ⏰📈NYSE:EOS 📌 macro analysis #dyor
The project is still alive 📌 better than many old projects 🤠
But u need to know project and trading price have huge difference 🙂
This coin #eos best example 📌
Support :: $0.286-0.506 ( best average for old user's )
Resistance 📌 $1.29-1.7 // $3.2-3.9 🔚 🐂
📌
Don't expect new high 💰 i don't say it won't possible
👉above $1.56 no new low 🔅
👉above $4 weekend close $6-8 we can expect ❤️
👉 Above $8 month close 📌 befor Jan/Feb 2025 yes 🙌 new high 📌
possible around $12-18
Note 📌 i am going based on #ta it's a game play ▶️ u need to understand adjust ur plan with market ❤️🔥

EOSUSDTHello traders
As the chart said we have to TPs there is essential IF!
IF TP1 broken down get ready for TP2.

EOSUSDT.P BULLISHISH SCALPING (4HRS) 👀👀Enter the trade after a bear candle bar closes below the line (enter trade), set your stop loss on the line (SL) and take profit using the line (TP) or you can adjust your Take Profit later on to take more profit. Thank you.
This a 90% sure win based on the RSI and StochRSI, as you can see the Stoch RSI as settled for the secondtime reaching its oversold level. Also based on ZigZag trend a an Uptrend is formed. We will probably be having a double top and double bottom pattern
Both height using the green line are measured with the same Percent profit.
Note:
2. Remember your risk management or risk ratio, to avoid blowing your account.
3. Wishing you a safe trade.

EOSUSD ❕ trading in the rangeEOS has consolidated under the 50EMA on the 4H TF.
RSI is moving in the sellers zone.
I believe the asset will continue to decline.
EOSUSDT LONG IDEAEverything is clear on the chart
⚠️"Daily crypto market analyses I provide are personal opinions & not financial advice. Trading carries risks, so do your own research & seek advisor's help."
Don't forget to like and comment


EOS/USD Secondary trend.Secondary trend. Logarithmic graph. Time frame 3 days. Reversal zone.
Mirror resistance zone (former long-term support). There may be a significant rollback from it, or at least a stop and consolidation in this zone, provided that the secondary downtrend (price movement direction) is broken (purple line).
From the highs of this secondary trend, the price fell by exactly -93% to the level of 0.93. An interesting coincidence, isn't it?
Coinmarketcap : EOS
The same parameters, but on a line chart.
EOS/USD Main trend
EOS/USD Main trend. Channel

EOS/USD Local work. Reversal zone. %Local trend. Logarithmic graph. Time frame 1 day. Reversal zone. Percentage of key zones.
Mirrored resistance zones are shown in grey. There may be a significant rollback from them, or at least a stop and consolidation in these zones. Trend lines (price movement directions) are shown on the chart, their importance and strength (long-term in time) are highlighted in the appropriate color.
From the highs of this secondary trend, the price fell by exactly -93% to the level of 0.93. At the moment, the price is entering the first resistance zone, which, in case of fixing in it, can become a "launching pad for a strong impulse (mirror structure).
Coinmarketcap: EOS
The same parameters, but on a line chart.
Next ideas for zooming in to understand what zone the price is in.
Secondary trend
EOS/USD Secondary trend.
Main trend
Main trend. Channel

EOSUSD ❕ trading in the rangeEOS is trading in the range.
RSI is moving around neutral values.
I expect the asset to continue rising after fixing above the current level.

EOSUSD : Bearish At Age Of 5 YOAlthough EOS completed 5 yr today, but its trending bearish.
let's profit it.
Series of LHs (Lower highs) and LLs (Lower lows) confirms its Bearish.
Following Sell Stop positions can be taken.
Entry ( Sell Stop) : 0.69513005
Stop Loss : 0.73864485
Take Profit 1 : 0.65161525
Take Profit 2 : 0.63161525

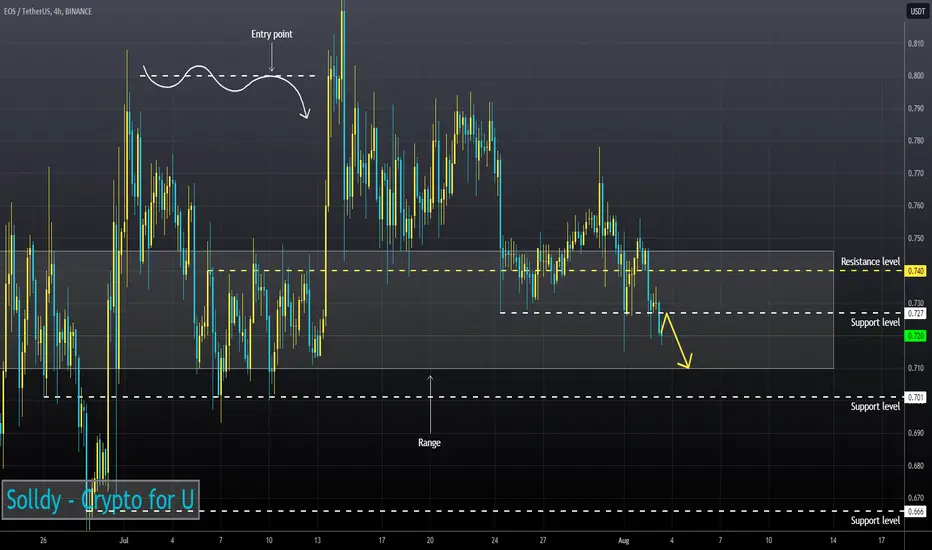
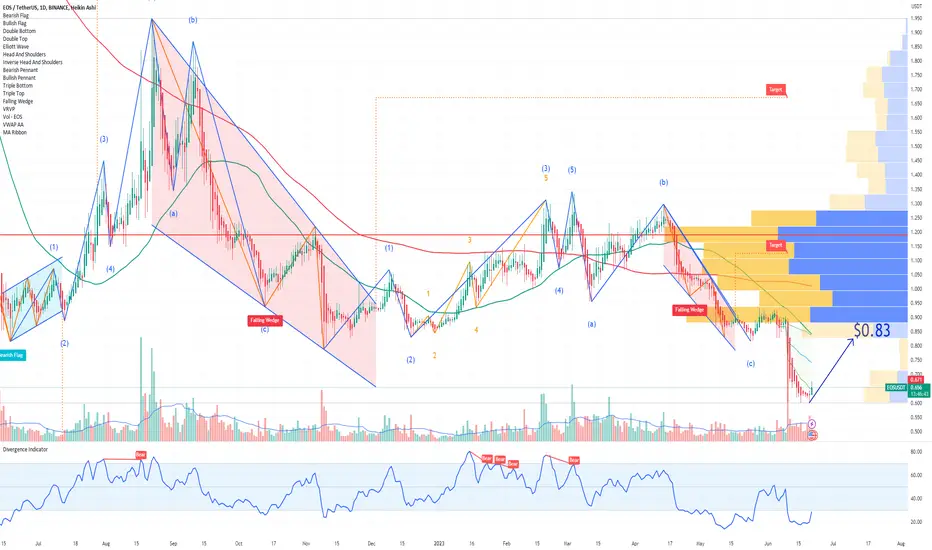
EOS Potential ReversalEOS cryptocurrency is currently displaying signs of a potential reversal. The price action suggests that the downward trend may be coming to an end, and a bullish turnaround could be in the cards.
Based on this analysis, my short-term price target for EOS is the $0.83 resistance level.
Looking forward to read your opinion about it.
EOSUSD ❕ overboughtEOS has reached a resistance level.
The RSI chart is in the overbought zone (4H TF)
TD Sequential has formed a reversal signal downwards (4H TF)
Token will continue the correction after fixing under the support level.
