Selling pressureEOS has been in a range over the past week, with its price stopping below trend resistance in the $1.131 range. Yesterday, we saw a 6% drop in EOS following the selling pressure created in the market. Therefore, it is very likely that we will see a range trend for EOS this week. The first support is considered in the range of $1.033, but if the selling pressure increases, the price decline can continue to the range of $0.934 - $1.
Eosusdt

Eosusdt Breaking Out Breaking Out Descending broadening Wedge
Incase Of breakout expecting 150 - 160% bulish Wave
Always Wait for confirmed breakout

✴️ EOS Token Very Strong | Prepares For 45% Jump To $1.50+When it comes to the retrace/consolidation phase, EOSUSDT was one of the altcoins that went deeper.
While Bitcoin and others stayed above EMA10 after the massive mid-January pump, EOSUSDT moved to test EMA50 as support and even closed below EMA10, EMA21 and EMA100.
We frequently say... "What one does, the rest follow!"
Even though EOS moved lower 18-Jan., yesterday a full green candle send its price trading back above EMA10, EMA21, EMA50 and EMA100.
Compared to other major altcoins, this one is still below MA200... What to make of this?
This tells us that there is higher potential for growth... That's the beauty of crypto, if one pair goes ahead you never miss an opportunity because there are always other pairs that will follow and do the same.
With this strong bullish bias, the next target short-term is set at $1.13 or MA200, followed by $1.22 and finally, $1.50 for EMA300 or the 0.618 Fib. extension golden ratio.
This is truly only the beginning...
Things are absolutely just getting started!
Our beloved cryptocurrency market will grow for months, literally!
We have many confirmations now.
Jump on board and enjoy the ride up.
Namaste.


EOS/USDT :: Wait until it breaks !?EOS/USDT :::
It is a good opportunity to buy, but if you are looking for reassurance, wait until the resistance is broken and the price stabilizes .
<<< Good luck >>>

"Ethereum Killer" - EOS is fighting for personal survivalHere is the entire trading history of EOSUSDT, which is 5.5 years from mid-2017 to the present.
At different stages of its existence, EOS was called a know-how breakthrough in the crypto industry and the "Ethereum killer". They announced the creation of a bank and crypto exchanges based on EOS and much more. But such a news background and marketing did not help.
In fact, the EOSUSD price is in a clear downtrend for the last 19 months. Probably, the 20th month will still be under the red trend.
However, in general, the first signals for a possible upward trend are appearing in the cryptocurrency market.
The EOS price has now stopped at a strong, one might say mirror level, because it was first tested for strength back in 2017. In 2022, the liquidity zone of $0.80-0.85 has already withstood a blow from above three times.
If there are still people in the crypto market who are interested in EOS, then it's time for them to take their heads and start aggressively buying. Because under this liquidity zone left only -40% to the absolute price minimum.
But let's try to think positively and repeat like a mantra: EOS is a necessary and working crypto project. )
In this case, EOS will be bought, and the first task of buyers is to break through the red trend line. Therefore, the first growth target is $1.35
The next task of the extremely difficult quest of EOS buyers will be to consolidate above $1 and on the other side of the red trend line.
And only after all these conditions are met, you can start dreaming and fighting for the growth of the EOSUSDT price to the liquidity zone of $1.95-2.05
Do you believe in the growth of EOS ?)
_____________________
Did you like our analysis? Leave a comment, like, and follow to get more

EOSUSDT Elliott Waves Analysis (Local Setup)Hello friends.
Please support my work by clicking the LIKE button👍(If you liked). Also i will appreciate for ur activity. Thank you!
Everything on the chart.
i expect fall from current price or through ~0.94
Entry: market and higher
Target: 0.82 - 0.79 - 0.76
after first target reached move ur stop in breakeven
Stop: (depending of ur risk). ALWAYS follow ur RM .
risk is justified
Good luck everyone!
Follow me on TRADINGView, if you don't want to miss my next analysis or signals.
It's not financial advice.
Dont Forget, always make your own research before to trade my ideas!
Open to any questions and suggestions.

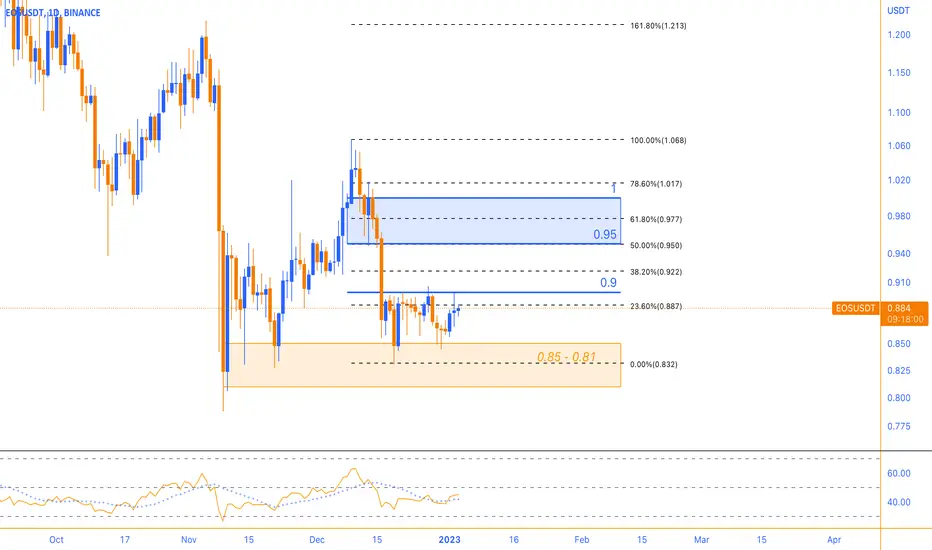
Increasing demand is decisiveIn recent weeks, EOS has registered a range trend at its lowest historical support level. The price of EOS in the daily time frame ranges between the resistance of $1 and the support range of $0.85 to $0.81. And in the 4-hour time frame, the range trend is between the current support and resistance of $0.90. If this resistance is broken by increasing demand and the market conditions remain favorable, we can expect that by turning this level into support, the next target in the range of $0.95 to $1 will be available to buyers.
EOSUSDT 2 Short opportunity : Arghh 🐻 Heyo ma friends > hope u enjoy holidays <
for now we got 2 short opportunity for #EOS #USDT
First One :
Entry : 0.877 till 0.880
Stoploss : 0.906
Take Profit : Dynamic ! but 0.779 and 0.700 down to 0.58
if this one failed ? so ADONIS got u another one :
Entry : 0.926 till 0.936
Stoploss : 0.962
Take Profit : like first one , Dynamic ! but 0.779 and 0.700 down to 0.58
GOOD LUCK with crypto capitulation :)
#btc_10k

EOSUSDT Elliott Waves AnalysisHello friends.
Please support my work by clicking the LIKE button👍(If you liked). Also i will appreciate for ur activity. Thank you!
Everything on the chart.
my previous analysis where I was marking the impulse was invalidated and we reshaped the structure into the ending diagonal.
Entry: 0.75 - 0.6
Targets: 1 - 1.3 - 1.8 - 2.2
after first target reached move ur stop to breakeven
Stop: (depending of ur risk). ALWAYS follow ur RM .
risk is justified
Good luck everyone!
Follow me on TRADINGView, if you don't want to miss my next analysis or signals.
It's not financial advice.
Dont Forget, always make your own research before to trade my ideas!
Open to any questions and suggestions.

EOS Breaks August Downtrend (Can Grow 60%)The downtrend that started for EOSUSDT with the last peak in August 2022 has been broken.
The last two sessions clearly depict a fight between bears and bulls won by the bulls.
EOSUSDT is trading just below EMA50 with a short-term bullish bias.
Additional growth can happen.
We can see a target mapped at 60%.
Easy target can be found at 30% above the current price.
This chart is similar to many other Altcoins, more evidence pointing to a new relief rally for the cryptocurrency market ahead.
Namaste.

EOSUSDT Outlook and mapping out the EOY/New YearThoughts are illustrated on the chart
looks like another bear flag is forming and a subsequent drop is still ahead of us.
this is in conjunction with my anticipation of BTCUSD dropping after this next grind which will (imho) result in a further test of ~15k or lower
Until the bottom of BTC is in, all alts will continue the same trend (which is down)
This is not financial advice, but an education tool for myself to chart and assess trends.

EOS Potentially Double Bottom 1W TimeframeEOS has the potential to double bottom on large timeframes, it can also be marked with a reversal pattern like on the chart. now is the best time to enter the market slowly.

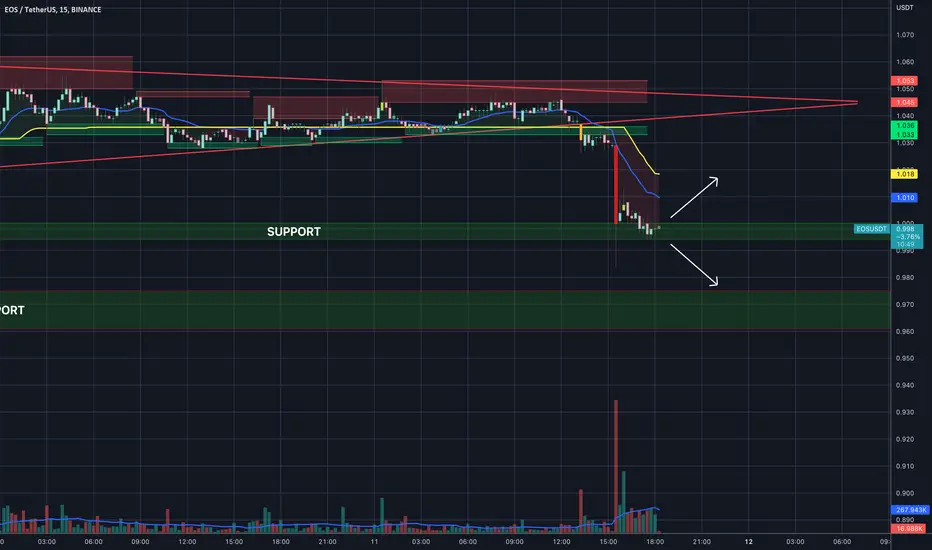
EOS - 12/11 - 1hr Chart UpdateEOS - 12/11
The price just broke from a triangle pattern and now it's trading on it's support level which is a good zone to begin a short or a long. On lower timeframes (15m) it's forming a descending channel.
I'd recommend to setup some alerts on $1 and $0.99 which is the first support range and wait for a confirmation (trading above or below the support range) in order to open a long or a short position.
*Candle color indicates volume .
EOSUSDTOverall Moving In descending Broadening Wedge In daily Timeframe
Recently Breaks Descending Channel In Daily Timeframe Now Expecting Breakout Of Descending Channel too Incase Of Breakout Target Would Be 3$

Crypto EOS/USDT (Seeing Strength)Crypto EOS (9 Nov 2021)
We are seeing decent strength in EOS in the recent days.
The BULL momentum can continue further and this time, it can reach to $6.
The next strong resistant level will be $8.4.
DYODD, all the best and read the disclaimer too.
Feel Free to "Follow", press "LIKE" "Comment".
Thank You!
Legal Risk Disclosure:
Trading crypto, foreign exchange or CFD on margin carries a high level of risk, and may not be suitable for all investors.
The high degree of leverage can work against you as well as for you.
Before deciding to trade foreign exchange you should carefully consider your investment objectives, level of experience and risk appetite.
The possibility exists that you could sustain a loss of some or all of your initial investment and therefore you should not invest money that you cannot afford to lose. You should be aware of all the risks associated with foreign exchange trading, and seek advice from an independent financial advisor.
DISCLAIMER:
Any opinions, news, research, analyses, prices or other information discussed in this presentation or linked to from this presentation are provided as general market commentary and do not constitute investment advice.
Sonicr Mastery Team does not accept liability for any loss or damage, including without limitation to, any loss of profit, which may arise directly or indirectly from use of or reliance on such information.

EOS : SEEM TO ENTER NEW BREAKOUT AFTER USDT TEST VIEWEOS is a cryptocurrency that is known for its long-term stability and fast blockchain. It has previously reached prices above $14, with a market cap of over $12 billion. Currently, there is expected that EOS could enter a new breakout phase, potentially pushing its price up by more than 30%, due to potential support from the USDT stablecoin. However, this has not been confirmed and should be treated with caution
Additionally, EOS has a payment system that is already being used on social media, and there have been rumors of potential partnerships with companies such as Twitter and Elon Musk's companies. However, these rumors should also be treated with caution and should not be relied upon when making investment decisions.
It is important to always do thorough research before entering any market.
We will see if this USDT view can support EOS to break out in the coming time.
USDT
If this will not stay only by testing and gets confirmed coming time, it's able to breakout EOS with 30% And UP, as we have not seen EOS for a long time not increasing so much.
We did expect before also BNX on DCA transactions.
See more about the Twitter view:
Thanks for your like and follow

HIGH STUDY - THE PAYMENT SYSTEM PROCESSING OF TWITTER IS EOSExpecting That EOS will play a very huge role in Twitter's coming time.
EOS is more able to do this for more reasons and there are some connections. ( and EOS already has beta version)
it's not the first time that EOS has made some connections with social media, and I think it's only about time before we are going to see some trends.
EOS is the old one, and with the most expertise in the domain of social media payments processing.
Elon musk is a businessman and will choose the best one!
EOS already has a payment system that ready can be for Twitter at any time
They already have a complete payment system ready for use.
There are some important connections will share later.
will share soon the most important trends, as this is only the start view.
When there are more signals about this we can see even the price returning to 20 USD
Never trade on this, as it bases on the study. and this is not trading advice.
Time will learn if this is right or not
Expecting that EOS is the possible payment system for Twitter.

EOSUSDTHello Crypto Lovers,
Mars Signals team wishes you high profits.
This is a one-day-time frame analysis for EOSUSDT
Obviously, there is R2 as the resistance area in which the price was not able to rise upward at some points. R1 used to be a support area. S2 is a long-term support area and also S1 is a 4-hour support line with its well support of price at it. Thus, we have the price fluctuating below R1 and our expectation would be a rise to reach the mentioned line. Then we must for some signs in order to have a rising or a falling trend to predict. If we have some confirmation candles as rising signs, the price is expected to reach upward to R2. Even it is probable that the price is rejected at R1 and more fall happens to it to S1 or more. The future reveals everything.
Warning: This is just a suggestion and we do not guarantee profits. We advise you to analyze the chart before opening any positions.
Wish you luck

KEEP AN EYE ON EOSOur algorithm detected one more strong buy which is eos, use proper risk management and be ready for breakout

Triangle pattern is forming!In the daily time frame, another support was confirmed in the $ 0.816 - 0.80.
Currently, an ascending triangle pattern is forming, which confirms the acceptance of the current price in the range of 0.940.
The break of the ceiling of this pattern can be accompanied by the break of the ceiling of the descending channel and increase the probability of continued growth up to 1.206.

EOSUSDTHello Dear friends
A positive RSI divergence has been issued to us on the daily time frame. But in the correction process, a LL has been formed. As a result, on higher time frames, there is a weak possibility of forming an increasing trend.
On the four-hour time frame, we have a triangle pattern at the end of the downtrend and a Cypher harmonic pattern is formed. But on this time frame, divergence has not been issued to us.
Provided that the upward trend line is maintained, and the upward trend is stabilized above the price range of $0.98, there is a high probability of the upward trend continuing.
We would be happy to hear your comments.
