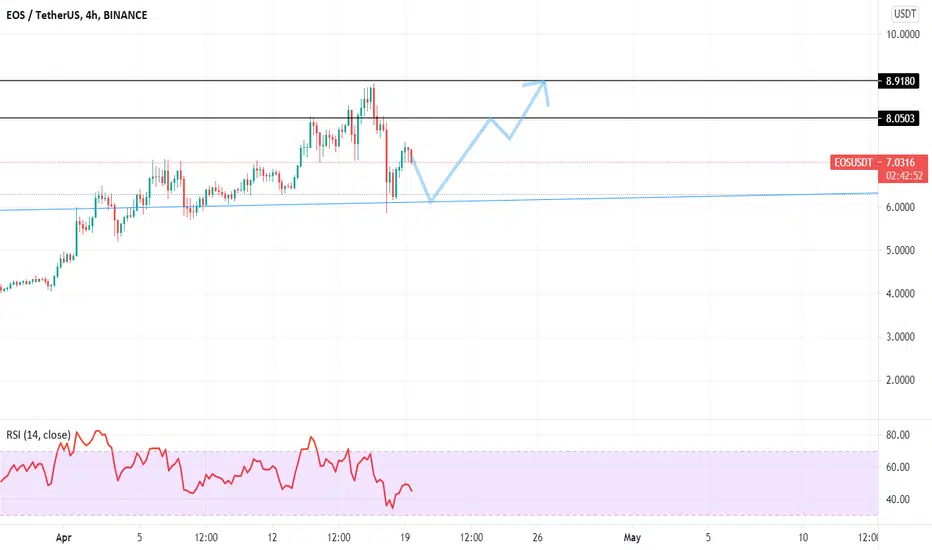
EOS 50% to 100% profit coming. Hello trenders,
Eos created a nice trendmark that may be now the new support.
The next push is going up to 6 Usd levels, maybe 8 Usd according to redistribution so that can be light to pump in the coming weeks.
Timeframe need more study but the idea is bullish.
M.M.M Make Motherfuc.in Money
Be wise: don´t work for the money, make your money work for you.
Eosusdtradeplan

EOS 3D The whole life of the project on one chartOur previous idea-warning about a correction on EOSUSDT, although it was made on the daily timeframe, worked very quickly and t he EOS price fell even below the $ 5-5.5 zone , where we expected it.
By the way, this idea was included in our top 15 ideas for the last 2 months, where a possible future strong correction was clearly visible.
Since the daily time frame worked out quickly, today we will look at the entire history of trading in the EOSUSD pair on the 3D timeframe.
As you can see, the growth of the EOSUSD price on May 12 stopped perfectly in the middle of the global growth channel, along which the price has been moving for more than 3 years.
Then a strong fall down awaited us. The collapse in the market was powerful, and the price broke through even the strong mirror zone of $4.30-4.70 , which in history has more than once played the role of resistance or support.
However, buyers happily bought back EOS from $3.50 and above at a very tasty price, creating a Pinbar on the 3D timeframe. Buyers can regard this pattern as a strong signal to continue buying.
It turns out that the bravest and smartest investors who placed buckets for buying in the $3.50-5 zone will soon be able to fix x2-x3 profit , because the price of EOSUSDT has the potential to rise to the $8.70-9.20 zone
Further, a correction to the liquidity mirror zone of $4.30-4.70 may await us again, where again it will be decided who is stronger. Accordingly, it will become clear there: will buyers continue to drive the price by $13 or sellers will continue to push the price towards $3.
But this is a completely different story, which we will write about in new ideas)
_______________________________
Since 2016, we have been analyzing and trading the cryptocurrency market.
We transform our knowledge, trading moods and experience into ideas. Each "like under the idea" boosts the level of our happiness by 0.05%. If we help you to be calmer and richer - help us to be happier :)

+100% already since our call ,,, what for now ??just before EOS fly we posted a call under $6 saying one only target that we r sure of which is $10 region ( idea link below the article in the related ideas section )
Not just that, we also made an update after this with hours advising to sell now portion at $12 -$13 and buy under10$.
what happened from hours that EOS touched 9.60 area and reversed from there.
congrats to all of followers , hope you are enjoying n making decent profits with our signals.
n for now, we can see that our $10 target flipped to support and it holds till now which is great indicator for moving up.
however there is a small possibility to get lower than this again if btc jumped dramatically.
As long as BTC.D is falling, Eos will be flying more n more
Targets n stop loss on the chart..
Please click LIKE button and Appreciate my hard work.
Must follow me for latest crypto real time updates.
Thank you.

EOS trading plan with Elliott and harmonic patterncypher and shark harmonic pattern:
AB=0.61 XA
BC=1.13 AB
tp1=0.78 BC=$5.9 *reached*
tp2=0.88 BC=$7.1 *reached*
tp3=0.78 XA=$13
tp4=0.88 XA=$17
tp5=1.6 BC=$28
tp6=1.13 XA=$33
tp7=2.24 BC=$92
tp8=1.6 XA=$122


EOS - 6h. Buyers prepare for 50% growthIn fact, the month on the EOS market was completely calm. After the previous wave of growth, which ended on February 14, market participants saw a bright 40% correction. After these active actions, the price of EOS began a prolonged consolidation on the lower volumes . A new wave of growth began on March 31st. It was at this time that the situation on the BTCUSDT market came to a standstill.
The dominance of BTC began to fall , the price began to consolidate and try to correct. Taking the opportunity, the EOS market grew by almost 50% in 4 days . Most importantly, the prospect of continued growth in the price of EOSUSDT still remains.
If we look at the 3-day timeframe , we can see that high volume buyers attacked the liquid range of $5.4-5.9:
This range has been under the control of sellers since February 2020. Considering at which volumes the buyers attacked this liquid zone, their intentions are serious. For greater confidence, we will expect a retest of this range and a set of a new position in the form of consolidation.
If buyers manage to keep the price of EOS within this range, we will expect the continued growth of the EOS market to $8.5-8.6
Losing control over the range of $5.4-5.9 will diminish buyers' chances of continued growth, but will not completely cancel out. In this case, we will expect a price correction to $4.2-4.3:
______________________________
We create both short-term ideas (for a local understanding of the market situation) and medium-term forecasts of price movements.
Subscribe to us and get daily concise analytics!

EOSUSDT Short with H&S and possible Swing tradeA H&S is forming due a necessary retracement. I prepared a short trade and I will wait for the swing trade. A daily close below 5.572 will confirm the bearishnesh.

EOS - 6h. Investors need to be careful in the range of $4.8-5 4 days ago, the EOSUSDT price reached the target of our previous idea. After reviewing this coin again, we decided to make a new idea with the following growth target for the EOS market:
By shooting 25% in almost 20 days, buyers showed that they are ready to keep the price within the local white channel. There have been no aggressive seller attacks in the EOS market since February 23rd. This can be seen both by candlesticks and by trading volumes. However, not everything is as pleasant as it might seem at first glance.
The current channel of growth in the price of EOSUSD is more like a corrective wave before a new impulse to fall. The rather sluggish growth on low volumes signals that buyers need to be careful in the range of $4.8-5. It is from this range that, in our opinion, a new wave of decline in the EOS market may begin. However, we will write about this in more detail after testing this range.
The current local upward trend will be threatened if buyers lose control of the range of $3.9-4. However, a test of this range will not override the scenario of continued growth in the price of EOS to the zone of $4.8-5.
Given that BTC buyers were able to hold on to $54,000 , the likelihood of EOS growth lengthening is high. At the moment, this is our main scenario.
___________________________
We create both short-term ideas (for a local understanding of the market situation) and medium-term forecasts of price movements.
Subscribe to us and get daily concise analytics!

750% opportunity EOS EOSUSD EOSUSDTFollow my updates daily by following my profile to help my portfolio grow, I'm starting and I'm working hard every day to put scenarios here :)

EOSUSDT - Dan Larimer Announces Departure From EOS Builder BlockA key programmer left the project after this news.
the price has not dropped too low.
There is an accumulation of more than 1 year.
I think the project has a prospect.
Conservative purchase after the exit from the accumulation range.
Push like if you think this is a useful idea!
Before to trade my ideas make your own analysis.
Thanks for your support!

#EOSUSDT #4HHi guys..its the latest analyze chart of EOSUSDT in 4H timeframe .if you are interested any crypto that you want analyze with me and any questions please do not hesitate and comment below the chart!
if u like it press like-comment and folow me.thx

Makaveli EOS Next 3 Shooting Target to $16 Bulls Fearless Ride Like $ Subscribe to get updates during the week on this post. Thanks in advance.
EOS bulls run as we talked about is about to begin as expected and like I said in my last EOS analysis that my first target was $6.
further analysis on EOS , shows that the current data formed since my last analysis is favouring this bulls run incoming, of which after this breakout, price will retest the breakout area ($3 - $4 range previous resistance area) before the major run begins
For Short Term overview(4hrs Chart)
We see a clear view of what the current breakout looks like, we see the $4 acting as a new support area(short term) after the breakout, simply meaning the journey to $5.5 to $6 range is about to kick start most likely today.
but do expect a retest of this resistance currently breaking most likely will take place after this move to the $6 range.
for Long Term overview, Weekly chart
a closer view on the weekly chart show a sideways pattern called the Rectangle consolidation pattern formed on the support since march 2020. While every thing crypto pumped in dec 2020, EOS was trapped in the Rectangle pattern up till now.
The rectangle pattern is easily identifiable by the minimum of two comparable highs and two comparable lows.
The highs and lows can then be connected with trendlines to form two parallel lines that make up the top and bottom of a rectangle called Support and Demand.
The rectangle is popularly known for its continuation of the previous move before the pattern is formed but in EOS case, we have this pattern formed on a base support that has been held down by the bulls since Dec 2018(2years support)
we see the first Daily chart shows that yesterday a candle tried to breakout of the rectangle. and successfully closed above it
This is a sign that the pump time is close and explosion is incoming on EOS.
For my target, I have 3 importance area of importance to take out some profit in percentage and here are there;
* First Target = $5.5 to $6 range
*Second Target = $8.5 to $9 range
*$15.5 to $16 range.

EOSUSD 1W-TIMEFRAME ANALYSIS✨EOSUSD 1W-TIMEFRAME ANALYSIS✨
Hello ladies and gentlemen
This is my new idea for Blockone EOSUSD
I expect the price to move higher...
I hope my idea is clear
Support me by like and share
Stay Safe💯
Good luck💰

EOSUSDT 350% Profit PotentialHey Guys,
Hope all of you are enjoying the profits in the Bull Market. This Bull Market was quite predicted earlier by me and is so far running well.
The Link for my BTC chart is :
Which was Uploaded on OCT18th.
All the major Crypto assets have done very well so far. But let me tell you guys that actual season is about to begin when BTC Calms & Starts Ranging while the dominance falls.
All our favorite alts will start showing their strength then. One of Those big Sleeping Giants is EOS.
Right now if we look at EOSUSDT Chart there is nothing much to explain about it. lets keep it quite simple as we can see their is strong volume accumulation & The Price has held the support quite well(Marked with green Box) it has also shown a breakout & retest of trendline starting from early Q2 of 2019. all the potential Take profit Points are marked in the chart with Blue Line.
Lets see how we see the price action after almost 1.5 years of Accumulation.
Price at writing 3.0625
Please Like, Share & Follow if the work helps you.
Trading is Risky Please manage your Funds accordingly.
This is not a financial advice. DYOR.
Thanks & Regards.
Anuj Tated.

EOSIf EOS can close a bullish candle top of the resistance zone we can hope to achieve the targets.
Risk to Reward is very attractive!

EOSUSD a long term bullish rally is expected very soonHi, friends hope you are doing good and welcome to the new update on EOS coin. After the drastic crash of March 2020 the price action of EOS coin has recovered more than 178% so far. Now on the daily chart the priceline is moving in a rising wedge pattern since after the mid Mar 2020. In the mid of August 2020 the price action for some time broke out the resistance of wedge but while re-testing the previous resistance of the wedge as support it re-entered in the wedge. At the moment the priceline is getting bounced from the support of this wedge pattern.
The EOS coin also has strong supports of 100 and 200 simple moving averages at the support of this wedge pattern. At the moment both moving averages are forming a bull cross with each other just below the support of wedge. After this cross we can expect the price action may start very strong powerful rally to the upside and even it can breakout the resistance of this pattern on as well.
A bullish Cypher move at the support of Wedg:
Now if we take more closer look at the daily chart it can be easily observed that price action has just completed a bullish Cypher move at the support of Wedge pattern. After initial X to A leg the price action of EOS has retraced between to 0.382 to 0.618 Fibonacci retracement level. Then it is projected between 1.272 to 1.414 Fibonacci projection of X to A leg. Finally priceline has retraced between 0.618 to 0.786 Fibonacci level and this is the place from where the potential reversal zone starts. The price action of EOS coin has moved up from the PRZ level of this pattern. The formation of the bullish Cypher pattern and the potential reversal zone of this pattern at the same level where the EOS has the support of the wedge can be extremely bullish signs that the price action may breakout resistance of this time.
The priceline has been rejected by the resistance of Wedge:
Now if we switch to the long term weekly chart. Then it can be seen that the price action is moving in a falling wedge pattern. After hitting the resistance of the pattern the priceline of EOS is rejected. We also have 100 simple moving average resistance at the same level where we have the resistance of this Wedge. This time the pirce action has the 50 and the 25 simple moving averages supports just below the candlesticks. The price action has the strong support of rising wedge pattern on the daily chart that we have discussed earlier. Therefore there are less chances that the price action will move up to the support of the falling Wedge pattern that has been formed on the weekly chart after rejection from the resistance.
A very big bullish Gartley pattern:
Now I would like to recall my previous ideas where I told you that on the monthly chart the price action of EOS coin has completed the formation of a very big bullish Gartley pattern after the successful formation of a bullish Shark. In my recent article I posted the same Idea on the two months time period chart. Where we can see that the price action is still moving at the support of this Gartley pattern and at any time it can start a powerful bullish rally from this potential reversal zone of Gartley.
As per Fibonacci sequence of Gartley the buying and sell targets are as below:
Buy between: $4.26 to $3.06
Sell between: $5.20 to $7.45
Conclusion:
Even though the price action of EOS coin is moving in a potential reversal zone of every big bullish Gartley pattern. Therefore a long term bullish rally is confirmed very soon. However the support of this potential reversal Zone is very critical. Therefore we should use the support of this Gartley pattern as stop loss. Because if this PRZ level will be broken down then a powerful bearish rally can be started to the downside.

EOSUSDT New Update!Hello, dear friends
EOSUSDT New Update!
If you like such format of my quick analyzes, support idea with like. I'll try to find more opportunities for making 💰
Always in touch with you🧡
Follow us please to make more chart
Sincerely Your DrDonIQ

EOSUSDT Double Bottom Pattern hi to all traders
according to the double bottom pattern and the symmetric growth parameter.
i expect the pattern to be complete...
and I expect the price to touch newer than before and
continue to grow at the rate of the second triangle and then correct the price
if you're agree hit the like bottom and follow my account.
the information provided is not trading advice but an informative analysis of the price movement
continue to grow at the rate of the second triangle and then correct the price

EOSUSDT mid time trade !Hello, dear friends
EOSUSDT mid time trade !
If you like such format of my quick analyzes, support idea with like. I'll try to find more opportunities for making 💰
Always in touch with you🧡
Sincerely Your DrDonIQ

EOSUSDT Ascending Head And Shoulder Hi To All !
My Idea Is Clear .
If You Agree Hit The Like Bottom And Support Me.
The Information Provided Is Not Trading Advice But An Informative Analysis Of The Price Movement.

EOS: Head and Shoulders Continuation Pattern 1D (Jun. 1)X Force Global Analysis:
Unlike other altcoins that have shown strong momentum during their bullish rally, EOS has been rather quiet, showing only steady growth. In this analysis, we explore EOS' bearish probabilities, mainly based on its head and shoulders continuation pattern.
Analysis
- The first thing we note in this chart is the head and shoulders pattern
- While many traders recognize this pattern (and the reverse head and shoulders pattern) to be a reversal pattern, it can also function as a continuation pattern
- In this chart, we have seen strong bearish pressure, and a downtrend before bouncing off support to form a head and shoulders pattern
- The neckline is at around 2.4 USDT, and the ascending trend line support is still intact
- The two shoulders have formed as a rejection from the 0.236 Fibonacci retracement resistance
- A break down from the neckline support and ascending trend line support would provide confirmation for a move down to the 0.786 Fib support.
What We Believe
Given that the bitcoin dominance chart looks bullish, it's reasonable to assume that probabilities for a bearish case remain high.
Trade Safe.

EOSUSD formed bullish Gartley | Upto 143% move expectedHi my friends hope you are good, This time I have brought another beneficial trading idea for you with complete stop loss strategy.
Very big bullish Gartley pattern:
This time on 2 month chart EOS has formed a very big harmonic Gartley pattern and entered in potential reversal zone.
Buying And Sell Targets:
The buying and sell targets according to harmonic Gartley pattern and its Fibonacci sequence should be:
Buy between: $4.26 to $3.06
Sell between: $5.20 to $7.45
Stop Loss:
The potential reversal zone area that is up to $3.06 can be used as stop loss in case of complete candle stick opens and closes below this level.
Possible profit and loss ratio:
As per above targets this trade has the profit possibility of 143% and as per above mentioned stop loss, the loss possibility is 28%
Note: This idea is education purpose only and not intended to be investment advice, please seek a duly licensed professional and do you own research before any investment.
