Marketwide Risk-Off Shaping UpAs people may be aware, I have been tracking what looks like a bearish diamond on SPX.
Naturally, these have a certain failure rate (as do all technical analysis forms) however this does not mean that they should not be treated with caution when trading and it does not mean that the potential for a risk-off move should be dismissed.
Furthermore, there is a lot more evidence I can submit to back this idea up and this is what I shall explore within this piece.
Firstly, as we might be aware, many stocks on the NYSE are already in a state of decline.
This started with small-cap stocks such as GME and PLTR which we can see have had a rough time of it of late.
GME is down about 75%
PLTR is down about 75% over one year.
The broader Russell 2000 (RUT) has already dropped by around 15%.
As such, small caps have been suffering for months.
This is nothing new particularly. However, it seems that the context of this bloodbath of small-cap stocks could be part of something much broader.
In the past couple of weeks, we have observed large caps also starting to struggle.
FB is down about 42% from September 2021 to the present.
NFLX is down about 45% over the same period.
AMZN fell by about 25% over the last 3 months.
All of this is self-evident and raises lots of questions.
The most important being, "where do markets go next"?
Fundamentally, I do believe that bigger things are happening.
If we look at some of the less-prominent big-cap companies we can see what appears to be similar risk-off moves shaping up.
For instance, JPM seems to be showing signs of a rising wedge after an -18% fall.
INTC is currently undergoing a rising-wedge breakdown.
XOM appears to be forming a rising wedge after a parabolic move over the last 4 months.
AABV is undergoing a similar move on the fine resolution.
In summary, the rout which began in small-caps appears to be migrating outwards.
I am not sure of the cause of this yet. However... there are some risks on the horizon due to the FED ending its easing program and beginning fiscal tightening.
There is also a very bearish outline for oil shaping up which I have explored in further detail here.
I strongly suspect that the same forces we are seeing weigh-in on oil and small-cap stocks are now beginning to affect the broader equity market.
Concerning SPX directly, we can see a gradual weakening of momentum over the past year leading up to this point with a strong MACD divergence and an emerging RSI divergence.
And naturally, I suspect that this is emerging due to the small-cap rout which is in full swing and the emerging big-cap rout.
The outline I have put forward for oil may also have an impact here as it seems companies such as EXXON are displaying the same technical forms which companies in unrelated fields are displaying.
We may therefore be in the early stages of a marketwide risk-off.
Naturally, technical analysis has a certain failure rate, but the evidence I have collated here from a fairly diverse set of sources seems to add weight to the idea that we are nearing a bearish inflexion point within asset markets and should position accordingly.
Equity

Stocks Retrace, Breakout Soon??The S&P 500 has retraced a bit after breaking out to 4580. This is a significant target which must be solidly broken if stocks are to consider new highs again. There is a vacuum zone above this level to 4632, which is our next target. However, we are seeing a corrective phase after the push from the low 4200's, with a retracement to support at 4440, the exact level we highlighted. From here, we anticipate more momentum for stocks, as the Kovach OBV is starting to pick up and the markets seem to be digesting news of Fed Rate Hikes, Omicron risk, inflation, world wide vaccine protests and more. If we continue to sell off, we anticipate support in the value area from before with 4272 a likely floor.

Stocks Reject Higher LevelsStocks have showed some weakness after rejecting higher levels at 4580. We appear to have topped out at this level for now with several red triangles on the KRI confirming prohibitive resistance for now. The Kovach OBV has taken a notable dive downward, but we have found support for now at 4462. We might be forming a bear wedge with a lower bound at this level. If we are able to break through, we should see good support at 4440, otherwise we will enter the previous value area between 4272 and 4440 again. If we see a burst of momentum, then 4580 must be broken before we attempt higher levels in the 4600's.

Stocks Meet ResistanceThe S&P 500 has made a run for higher levels, but has faced extreme resistance at 4580, which we identified as a hurdle for stocks in these reports. We attempted to break higher, but several red triangles on the KRI have confirmed resistance. Subsequently, a small retracement took us back to support at 4521. The Kovach OBV is pretty flat, lending skepticism to this rally. If we retrace further, it is likely that we will see support at 4440 again. If we are able to see momentum come through then 4632 is the next target.

NASDAQ is heading for the recent ATM If NASDAQ could hold 14000 then we could get confirmation on bottom. It's showing sign of moving up towards the previous ATH, the 16000 to 17000 range (the TW1 level).

Stocks Hit Our Profit Target 🤑📈 Will Momentum Continue??Stocks have gained notable momentum. We have broken through our first target of 4487, and have made a run for the second level at 4580. We are currently seeing some resistance at this level, confirmed by a red triangle on the KRI. There is a vacuum zone above 4580 to 4632, which is our next target for the S&P 500 if we are able to break 4580. The Kovach OBV is trending up, indicating bullish momentum, but we are facing a lot of resistance from these levels. If resistance prevails, we may retrace to support at 4487 again, or even retrace the entire move back to 4440.

Stocks Break Out!!Stocks have gained steam in the Asia-Pacific session, finally breaking through the upper bound of the range at 4440, which they have been holding all week last week. The S&P 500 was able to reach our next target of 4487, and continued to trend up, before finally coming up for air around 4521, where two red triangles on the KRI are noting resistance. The Kovach OBV has picked up significantly, suggesting there may be more legs to this rally. Watch for momentum at the open for confirmation. If so, then our next target is 4580. Once we break this level there is a vacuum zone back up to 4632. In the event of a retracement, 4440 should provide support, and if not, we will reenter the value area between 4272 and 4440 once again.

Stocks Test the RangeStocks are maintaining the wide range between 4272 and 4440. We are currently tending to the upper bound of this range, testing higher levels where we are meeting resistance. The Kovach OBV is trending upwards, suggesting a slight bull divergence. Watch the open today to determine if momentum picks up for clues as to whether we can break 4440. If so, the next target is 4487, then 4580. If 4440 provides prohibitive resistance, we could make a run for lows again at 4272, but we have plenty of levels of support in between from which we could get a pivot. Stocks must definitively break 4440 before we can be considered 'bullish' again.

DJIA Is Rebounding from The Lower Boundary of The Upward ChannelThe DJIA has been moving in an upward channel since around mid-June 2021. Recently the index formed a long bullish hammer candle that successfully confirmed a significant support area of a rising window/gap at 33,175 (this is called the cluster of candles). All the last week candles closed over the lower boundary of the rising channel and the 0.236 Fibonacci retracement level at 34060 as well as the 251-day EMA. In addition to this, there is a bullish divergence signal from the Williams %R out of the oversold zone. Therefore, the index is moving to test the levels at 35063, 35513 and 36152. In contrast, declining below the levels at 34060 and 33160 should indicate a further bearish move ahead.

Technical Analysis for StocksStocks appear to be establishing value in the lower 4300 handle. We have support from below at 4272, and are facing resistance above at 4440. The Kovach OBV has completely flattened out, confirming the indecision. Currently, it appears we are making a run for lower levels, so watch 4272. If we are able to break this, then 4228 is the next target. Beyond that, we have 4214, then a vacuum zone to 4188. If we catch a bid and are able to break 4440, then 4487 will be the level to break before 4580.

Stocks Tumble after FOMCStocks have broken down from 4440, and sought out lower levels in the 4300 handle after dipping as low as 4272. This followed the FOMC meeting, where the Fed delayed an interest rate hike but noted that a hike every subsequent meeting for 2022 was not out of the question. This and balance sheet reduction is their plan to combat the highest inflation in a generation. The markets jostled to digest this information with choppy trading before stocks dumped to lower levels. The Kovach OBV is tapering upwards in an apparent divergence with price, which fell through two handles before finding support in the 4300's, reaching 4353, where we are seeing resistance from a red triangle on the KRI. If we fall further, then we should have support at 4245 or 4223. If we rally, then we will see resistance at 4440. It is likely that stocks will try to establish value somewhere between these two bounds before making their next move.

Stocks Hinge on Three Key Issues from the FOMC Statement TodayStocks continue to edge up trepidaciously, testing 4421 or so, the levels from which we dumped on Monday. Two red triangles on the KRI have confirmed resistance here at every attempt. We won't see much action in stocks until after the FOMC minutes in the afternoon. A rate hike is largely priced into the markets, so when this happens, we should be able to break out higher. However, if their rhetoric is particularly hawkish, we could make another run for lows. Watch what they have to say about three key issues: inflation, Omicron, and Russia tensions, all issues which are currently spooking investors. If we are able to break out, then 4487, and 4580 are the next targets. If we break lower, we could test 4245 again. The Kovach OBV is edging up showing a slight bull divergence, but the FOMC event is what the markets are hanging on before their next move.

Have Stocks Bottomed??Stocks dumped yesterday as we anticipated in the reports. Yesterday morning, we saw a small bounce from the S&P 500 apparently attempting to test the mid 4400 handle, but this was attempt was swiftly batted down in a persistent selloff that lasted most of the day. At the end of the day, we saw a sharp buyback, which could have been a gamma squeeze as puts were piling into the order books. The sharp short squeeze erased all of our losses with some stock indexes ending the day in the green. Currently, we edged lower, as the markets equilibrate from the selloff and subsequent rally. We appear to be getting support from 4327 and resistance from 4389 at the moment. If we continue to press higher, we could see an inverse head and shoulders pattern with a neckline at 4409 or 4440. A breakout from there could test 4487, or 4580. If things take a turn for the worse, then 4245 should provide support, but if not 4188 and 4178 are the first levels in the 4100 handle.

maybe global stocks have anoter 10% to go?Perhaps a relief rally back to a midrange on global equities
then another leg down to all these prior all-time highs and massive volume shelves?
just a thought

Relative Momentum of Various Asset ClassesRelative Momentum of Various Asset Classes
SPY - Equities
GLD - Precious Metals
VNQ - Real Estate
TLT - Long Term Treasuries
JNK - High Yield Corp Bonds
SHY - Short Term Treasuries
MUB - Municipal Bonds
BTCUSD - Crypto-Currencies
DBC - Commodities

Relative Momentum of International EquitiesRelative Momentum of International Equities
SPY - US Equities
ACWI - Global Equities
ACWX - Global Equities excluding US
EEM - Emerging Market Equities
EFA - Developed Market Equities

Stocks Dip Sharply, A Bearish Start to the WeekStocks have fallen, taking a turn for the worse at the opening of the Asia-Pacific session. We have given up the 4400 handle entirely to seek support in the 4300's. We made a valiant attempt to pivot to the mid 4400's, where 4431 proved to be a barrier. A rejection took us back to support at 4380. A green triangle on the KRI is starting to suggest some support here, but the risk sentiment is looking pretty bearish. We should have support from 4364, 4350, and 4327 in the event of another dump. If we are able to catch a relief rally, 4431 should provide resistance, with 4487 a likely ceiling for now.

Stocks DUMP!! What to Expect...Stocks plummeted near close yesterday, cratering more than 100 points. It appears that the stock market is not digesting the Russia/Ukraine issue, with NATO talks 'going nowhere'. We made an attempt to break into the vacuum zone above 4580, but a red triangle on the KRI marked sharp resistance early into this attempt. Subsequently we sold off, smashing through the 4500 handle, and testing levels in the 4400 handle. We appear to be seeing support from 4462, and made a small attempt at a pivot to 4487, where we are currently seeing notable resistance. At the time of this writing, we are currently seeing what appears to be a rejection, seeking support at 4462. The already abysmal Kovach OBV has taken a sharp turn downward, but does appear to be showing signs of leveling off. We have a cluster of levels in the lower 4400's to provide support including 4440, 4431, 4421, and 4408. All of these could potentially be targets if the selloff persists. If not, we could make a run for the relative low at 4521 or attempt 4580 again.

Stocks Continue to Dive 📉😱Stocks have continued to press lower, breaking several key levels. After breaking 4580, we made a brief attempt at a pivot back through the vacuum zone to test 4632, but that fizzled quickly. Subsequently, we plummeted back to lower levels, breaking 4545 and finally finding support at 4521. A green triangle on the KRI is confirming support at this level. The Kovach OBV is still abysmally bearish, arching straight down, with not the slightest sign of leveling off to suggest a bottom forming. However, at this point we are quite oversold and due for a relief rally, even if its just technically driven. If so, watch for a breakout from 4580 into the vacuum zone again, with 4632 being a potential target. If the rout continues, then 4504 and 4487 are the next targets to the downside.

$COIN Expecting a bounceExpecting a bounce if we breach this channel once again.
It looked like a channel break there for a moment and shorts could be squeezed a little if we bounce.
Target $270 for this bounce.

Stocks Take a Noisedive!! Is a bottom in sight??Stocks took a sharp turn for the worse. As predicted, the break down from the inverse head and shoulders pattern we identified two days ago, was a bearish sign indeed. We have traversed the vacuum zone below 4632 and made a run for 4580. We anticipated this level to hold, but we saw only a brief attempt at a pivot off this level which was quickly sold back down, breaking 4580 and testing the next two levels down. We have several levels in the upper 4500 handle to provide a cushion, and it appears like 4545 may be doing the job for now. If not, the next levels are 4521 and 4504, the latter being the last support level in the 4500 handle. We have seen a small pivot from 4545, and are currently testing 4580 again, peaking up just above this level at the time of this writing. We have encroached upon the vacuum zone between 4580 and 4632 again, but the Kovach OBV has been solidly bearish for most of 2022. If we do see a rally, 4632 is bound to provide resistance.

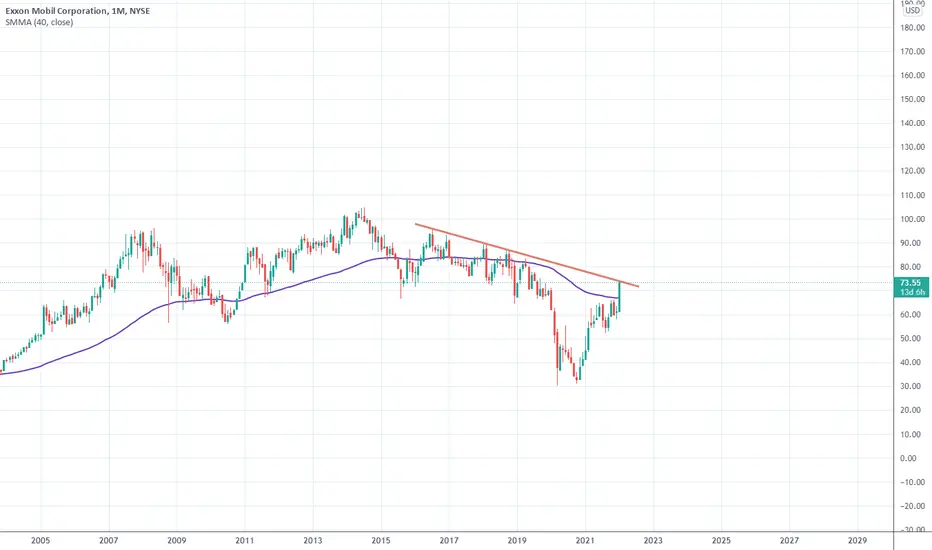
$XOM Exxon Mobil. Overhead resistanceAfter a terrific month $XOM has hit a multi year resistance line. Maybe time to take some profit ??
Stocks Break Down from Inverse Head and Shoulders!!📉😱Stocks have broken down hard from our inverse head and shoulders pattern. This should be considered a very bearish sign. We have broken into the vacuum zone between 4632 and 4580, finding support at roughly the midpoint around 4600, a psychological level, which may also become our next addition to technical levels on this chart. The Kovach OBV is quite bearish, but if we see a relief rally, we can expect the S&P 500 to test 4632. We have several levels above this in the 4600 handle, with 4668, the neckline of our inverse H&S a likely ceiling for now. The neckline of a failed H&S pattern always proves to be a significant barrier. From below, 4580 and 4564 should provide support.
