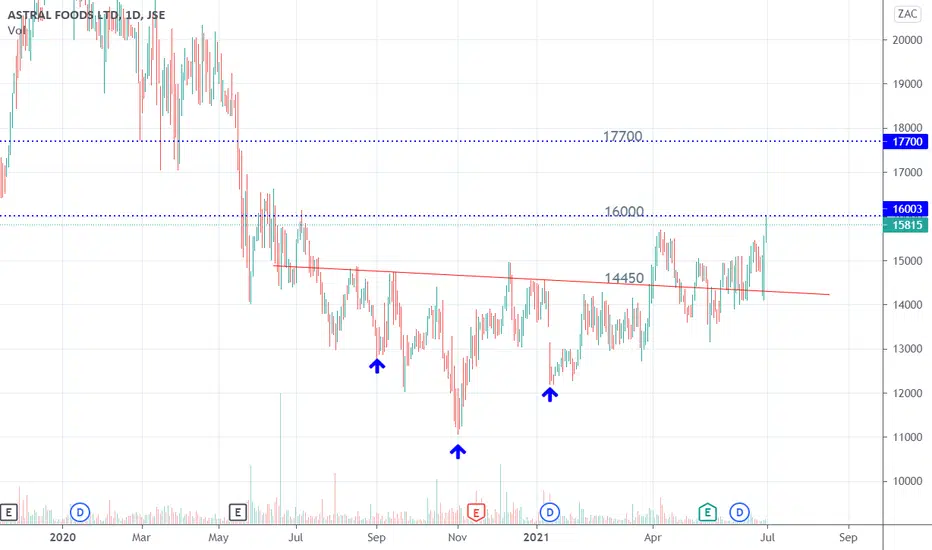
$JSEARL Astral Foods First target reachedTook three months to reach first target and not in a straight line either. Second target 17700 looming.
Equity
ATCO more to comeI was having a discussion with one of my trading buddies today regarding my trade on ATCO, using a strategy I adapted from the great Jesse Livermore using a pyramiding order system along and below a mean using standard deviation and the Andrews Pitchfork method.
Shortly after the covid drop I started to build a position on ATCO after quickly identifying the reaction from the drop creating positive market structure, I used this structure to find a mean or secular trend (although a little early to call it) to start building a heavy line taking opportunity of price action using either .5, 1 and 1.618 fib levels below the secular trend.
I have had a total of 8 entries now (June12th/July13th/august20th/September25th/October29th/December17th in 2020 and jan25th/june24th in 2021) with an avg weighted entry price of 9.81.
Using this strategy has enabled me to keep my avg entry price weighted to the downside staying in considerable profit the entire time with plenty of time to react to any significant market downturn that could invalidate the current trend and be able to exit the position for a healthy profit.
In the mean time this becomes a risk free trade as I trail my stops up under major market structure and keep a close eye on the multiple trend lines within the ascending range.
Fast forward to recent structure we have hit previous local highs mid march which then created a tight descending range forming a bull flag or potentially the handle in a much larger cup and handle formation.
This has proven to be a profitable system for me to trade the equity markets looking for major trends to test previous highs and then break through shortly after a short term consolidation.
Last night we got a glorious break of that flag with very nice volume to back up the momentum or participation from the down trend and its looking very strong and optimistic now for the break from previous highs and to head back into a price discovery for 2021 above 15 dollars.
This trade although not a huge price action % gain has been one of my most profitable position trades to date, which currently sits at almost 26R (based on original account balance from entry), This has been an incredible trade to manage so far and is one of the reasons I love this strategy of position trading so much.

Stocks Losing Steam??Stocks have extended gains yet again, coming just shy of our target of 4306, before pulling back ever so slightly. This is nowhere near the retracement we were expecting but it does validate our assertion that stocks are 'rounding off', potentially in preparation for a further selloff. Watch for support at 4272, and 4245. The Kovach OBV is still strong however, and no one can deny the bull trend, so watch for momentum at open to determine if we have the strength to break past 4293 to our target of 4306.

Positional Long Trade on KABRA EXTRUSIONS PRICE PATTERN ANALYSIS-
1) Stock broke out today from a SYMMETRICAL TRIANGLE PATTERN
2) Breakout was approximately at 2/3rd of the length of the triangle, indicating strength of the pattern
3) Pattern was formed over a period of 3 months, making Lower Highs and Higher Lows, which made a Symmetrical Triangle Pattern.
VOLUME ANALYSIS-
1) FALLING and LOW volume across the formation of the triangle.
2) BREAKOUT was accompanied by a HUGE SURGE in volume, confirming the pattern breakout validity.
TARGETS-
1) The targets for such a formation is the Difference between the 1ST HIGH and the 1ST LOW ( 215-157 ), which is equal to 58. This amount we add to the BREAKOUT POINT ( 205 ) to arrive at our TARGET ( 205+58 ), which equals 263.

Stocks Rounding OffStocks keep creeping up and have hit our profit target of 4293. We are seeing the price action 'round off' suggesting a retracement is to come soon. Typically these arching patterns precede selloffs. The Kovach OBV was strong but has curved over as well. There is no doubt stocks are in bull mode right now but it appears that they are ready to let off the gas for a bit. The levels 4272 or 4245 will provide support. If we are wrong and the S&P gets another burst of momentum, then 4306 is our next target.

Correction for Stocks??The price action for stocks is rounding off. We are seeing less and less momentum, and the Kovach OBV is still strong but tapering as well. When the S&P is rallying at a decreasing pace, it typically heralds a correction. There is no doubt the overall trend is bullish, but buying now would be FOMO. Levels from below like 4245, or 4228 would be enticing levels to buy back. If we are able to muster enough momentum to breakout then 4293 is the next target.

Stocks Inch Up, Retracement Soon??Stocks have inched up, achieving our profit target of 4293. There will be some resistance here, and it is doubtful that the S&P will have the momentum to break through at the moment. Some ranging or a retracement is likely first. Stocks are clearly in bull mode, but the momentum seems to be waning and the gains are increasingly more paltry. We will have support from 4272 and 4245. Our next target is a bit more conservative, at 4306 if we do see another burst of momentum. We should also see resistance at the 4300 mark, since this is a psychological level.

$JSETRU Truworths Bullish flag targetFirst target (5825)of this bullish flag breakout met
Seems that we have a bit of consolidation at current levels
Second target 6163 still looming

$WISH Support holdingContextlogic broke the downtrend and tested the downtrend line again yesterday.
Support held on large volumes
Looking positive for a move to higher levels
Volatile

DISNEY opportunityKeeping a close eye on the current structure with Disney at the moment, I have been a long term trader/investor with Disney for a while and its served me well how ever reduced position over the march push as the amrkets seemed a little cooked and been waiting to reenter and start pyramiding orders again.
Pretty clear H&S forming on the daily right now and a large gap between the current formation and the structure from mid to late 2020, not to mention price chopping below the 100 day EMA
A break down of this formation and support level could see fairly sharp price action between these price points and a much better entry (Im not trading options just spot)
The other possibility is we bounce on this neckline, crack the right shoulder and continue the current macro bull whilst the fed continues to print bills into QE which should see the markets artificially move with it.
Ill be keeping a close eye on the volume and candle formation over the next week looking for signs of bulls entering here, an increase of volume, coupled with maybe a morning start close to this support could be enough to give me a the confirmation to take the entry...how ever ill be cutting losses early if its quickly met with a break down or volume diminishes straight after my entry.
The key here is conviction, I need volume to back up my decision or im out and waiting for a lower entry back around 152 or even lower as that sell off could trigger a considerable down trend.
Give it a few more days either we stay invested with disney or shelf it on the watch list for a few months lol

New Highs For Stocks??The S&P 500 is currently at the cusp of new highs. It has retraced the entire cypher breakdown. It is likely we will retrace here to support. First, we have had three straight days of gains. Second, although we are seeing higher highs and higher lows, the hallmark of a bull trend, these values come at a decreasing pace, ie we are seeing the S&P 500 'round off'. Therefore, if we do not see momentum at open, we are likely to retrace to support at 4245 or 4228, which would provide excellent opportunities for long positions. Watch the Kovach Momentum indicator. If you do not see a large spike at open, we are not having the follow through in momentum we need to punch through to higher highs.

$BAT Brait Turning profitBrait reported a profit of R446 mil yesterday. The share jumped 14%.
Brait has been trading in a defined range for more than a year now 234-429
Quite a bit of upside potential here is you look at the double bottom
Target is 429c - Top of channel

Stocks are Back!!Stocks have rebounded to within a few ticks of where they broke from our butterfly cypher pattern. This suggests that the markets have fully digested inflation and interest rate updates from the FOMC meeting and most likely suggests that we are back to bull mode. Nasdaq printed highs yesterday, so the S&P 500 could be soon to follow. It will take some momentum to break through 4260, and if we do not see it, anticipate a retracement to support at 4245 or 4228. The Kovach OBV has returned to highs itself, as has the Chande, which is a sign that we are overbought and due for a retracement. Watch the momentum at open. If it is paltry or there is a lack of conviction, we will retreat to support at the levels discussed above. But there is no doubt that overall momentum has returned for stocks

Wild Ride for Stocks!!Stocks have recovered from the dip which reached our profit target from the butterfly cypher pattern. We dipped quite a bit, down to the 0.618 level (one level past our profit target) to 4144. Almost immediately, investors swooped in to buy back the S&P at lower prices and we closed back just shy of 4245, currently finding support at 4214. The Kovach OBV is oscillatory, matching the fluctuations in price. It could go either way at this point. Another selling wave could take us to support at 4188 or 4144 again. An influx of momentum could push prices back to highs past 4245 to 4272. After such drastic volatility it is reasonable for the markets to seek value.

$WISH Hot meme stock for a reasonContextlogic has been trading in a downtrend since January.
The downtrend is now challenged with some large volumes coming through
A challenge of 15.11 could form a nice inverted head and shoulders with around a 22.50 target price
Fundamentals on forward earnings not looking bad either.
Stock doesn't seem overpriced at current levels
#2 on Hype Equity today
I have a position
Stick to stop losses

Will Stocks Maintain Highs??Stocks have inched out highs on Friday. Asia's opening has seen little movement from those levels. In order to maintain current levels we need some momentum desperately. Otherwise, we will likely see a retracement. As we have noted multiple times in this report, 4188 or 4144 would be nice targets for a selloff. Buying at these levels would be FOMO and would carry significant downside risks, so keep a narrow stop loss if you are long. The Kovach OBV is very gradually tapering up but is broadly speaking quite flat.

COMP Equity Buy -- Very oversold.COMP looking like a great buy down here. Hasn't made nearly as big as moves as other major alts. Stop out on equity around 275. R/R is awesome

HBARUSDT - Great place to add to your spot equityHBAR is sitting on large support and at the bottom of its range. Nearly unaffected by the BTC drops, HBAR is strong for the longer term and a great buy down here.

Stock Hugging HighsStocks have made a run for highs, but faced steep opposition there. We saw some big volatility yesterday, rejecting 4245, taking us back down 20 points to 4225, then retracing back again. There is a clear affinity for highs, but it will take some momentum to solidly break them. It could go either way so watch for momentum at the open. We still feel we are in need of a healthy retracement to 4188 or 4144, but we cannot deny the bull bias. The Kovach OBV is tapering up, but still pretty weak. Strong momentum at open will be key to a breakout. If so, our next target is 4272.


The Direction Of The S&P500 Is UPThe direction of ES futures is UP
There is the overbought (OB) trend noise balance (TNB) indicator on 2D-1W to confirm this
There is a 1D BUY weakness (WK) indicator to confirm short term
There is an 8H SELL WK indicator to conflict this (use SL to manage the risk of this indicator)
Be aware of the cost of any potential SL and the affect of that on the account. In this scenario CMP 4223, 1W LOW SL 4165, 1 MES contract $5.00 = 1 'handle', cost = $290, In the book, Trading For A Living - a trade should not risk more than 2% of the account, account size = $290 / 0.02 = $14,500 minimum.
This trade depends on where the market expects the month and the quarter to close. The ES futures has a sequence of 4 quarters closing high. The 1D 1XP BBW indicates that price will expand. The expansion could reach the 1M BB 2CP or it could reach the opening of the quarter. I think a surprise move to close the quarter red will set up more potential for bullish growth later. However, that is only a guess. I don't want to leave the short term opportunity on the table so I BUY and manage the risk with SL. If the SL is reached, I will patiently wait for the more ideal BUY zone to be reached although the market direction may be changed to DN at that point, in which case the analysis will be updated.

Action Soon for Stocks??Stocks continue to maintain a very narrow range between 4214 and 4225. The longer it maintains this range, the more likely a breakout becomes. We feel that it would be healthy for stocks to feel out lower levels before making new highs, and are preparing for a dip down to 4188 or 4144. The Kovach OBV is still flat and our outlook will not change until we see some life again. Levels from above will provide formidable resistance such as 4245 and 4272. It is unlikely we will hit our target of 4293 any time soon.

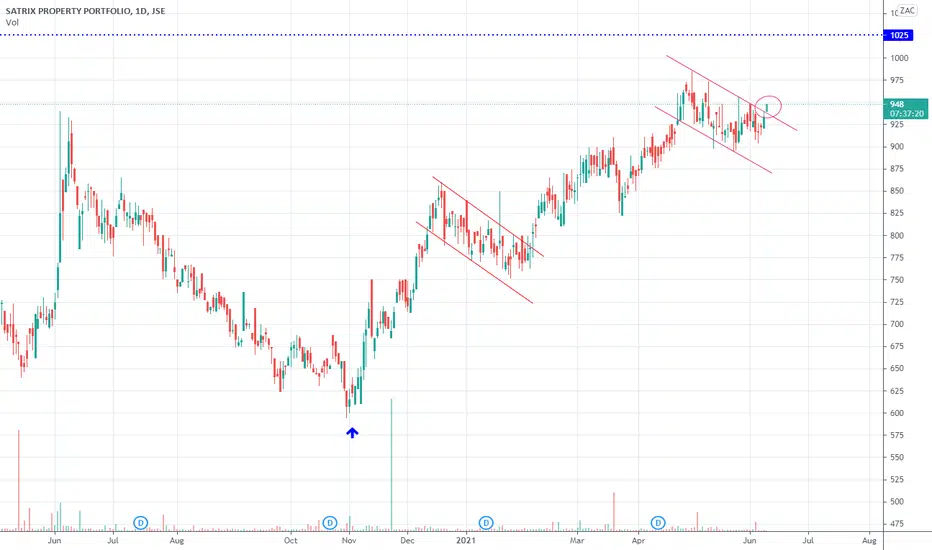
$JSESTXPRO Satrix Property - Bull flag breakSatrix Property ETF is breaking out of a bullish looking flag today. Target for the break is around the R10.30 level.