Asia-Pac JPY diverging the S&P In a bearish wave of the first quarter of 2021, JPY moves lower as it diverges the S&P Micro E-Mini Futures.
Equity

The S&P 500 is Near our Profit Target!!Stocks have continued their ascent, and the S&P is just below our target of 4144. We should see resistance here but there is no denying that overall stocks are in bull mode. We have not seen a reasonable pull back since March. We are due for one, or at least a sideways correction at highs. There is a vacuum zone down to 4073, which seems unlikely at this point, but stocks are very good at punishing the exuberant. The Kovach OBV is still very strong, but its starting to look overbought.

Stocks Continue to Rally!!Stocks have continued their ascent, and our analysis remains the same. The general trend is clearly bullish but we are due for a technical retracement, or at least a sideways correction. It would be unwise to short at this point, as you do not want to get in the way of this. We are about half way between the nearest level of support at 4073 and our target of 4144, where we will definitely see some resistance. Use caution because as the S&P has rallied, it has created vacuum zones below and a significant pullback could take us back to 4009.

$JSEMEI Mediclinic. Medium term consolidationMediclinic has been trading in the same consolidation zone between 6600, and 5300 for 17 months now, with one breakout attempt in Oct 2019. The expectation is more of the same, and the 5300 level could present a buy opportunity with a 6600 target.

$JSEITE Italtile. Bear flag in the makingItaltile had a very strong start to the year, but lost some steam and are now forming what might turn out to be a bear flag. If this flag breaks to the downside the target will be 1500 -1450. Once again a great company that just ran too hard and is now taking a breather.

$JSECTK Cartrack. Bear flag targetAfter a a very solid start to 2021, Cartrack has formed a bear flag and a break of that flag. Pullback target for this break is around the 4800 to the 4500 level. Good pullback level to asses this share for a possible long position. Great company.

$JSESSS Stor-Age. Boring can be good sometimesStor-Age is a solid property REIT company. It's well run and solid dividend payer. It's has been trading in a consolidation zone between 1280 and 1400 for 4 months now. Watch the 1400 level for a break higher. This company is not going to shoot the lights out anytime soon, but for a patient longer term investor that is looking for a good dividend payer, this is a gem.

Stocks Inching HigherAfter ranging for a bit, stocks have inched higher to new highs. So far, 4073 is providing good support. Be careful of the broad vacuum zone that is forming below down to 4009. After such a large move, it is reasonable for stocks to continue to range or retrace a bit. However, in the current climate, it would be unwise to step in front of this freight train. We anticipate new highs sooner than later and 4144 is our next target. The Kovach OBV is strong, but appears to be leveling off.

Stocks Ranging at HighsThe S&P 500 is stubbornly clinging to highs. We saw a range day which was to be expected after blasting through highs. and establishing a point of control at about 4077. Our next target is 4144, and this comes from a Fibonacci extension. From here it could go either way. We could continue to range to solidify footing in this new price range, before breaking out higher. A retracement would also be healthy, which could take us to the 4040's, or worst case retrace the entire move back to 4009, since the move has formed a vaccum zone in this range. This seems unlikely, since there is strong momentum here as measured by the Kovach OBV. Dips should be considered buying opportunities and we may see our target reached by the end of the week.

How I Captured A 100% Move In BalaminesFirst Thing You Need to Know Here Is That All The Strategies in the world are only successful if you can exercise the patience required. Sitting Tight Is the most important skill not reading charts.
I Went Long In Balamines on 26th October 2020 Basis A Weekly Inside Bar Breakout. The Stock Was In A Strong Uptrend Before This And Had Taken A Pause Between August to October. The Movements Became Tighter & Smaller with each passing week and that is when it started showing up on my radar. I took my first long when the high of 19th October candlestick was breached, The Stock did nothing for a week post my buy ( sitting tight is important through these phases ), Exploded Post this and reached a high on 1054 in November but reversed from there again. It was waiting time again, I waited for a month and the movements started becoming tighter again in the week starting on 28th December, I went long again when the high of this candle was breached at 950. The stock flew next week making a monster move of 22% in one week. After another month of waiting in Feb came another monster move of 35% in one week. By First Week Of March the stock reached a price of 1905, A 114% Move over my average price.
I am Still Holding the stock. The Moves Came Coz I sat through the dull phases not because I have a special skill in reading charts.
Hope This Helps You in improving your performance. Always Trade On A predefined risk.

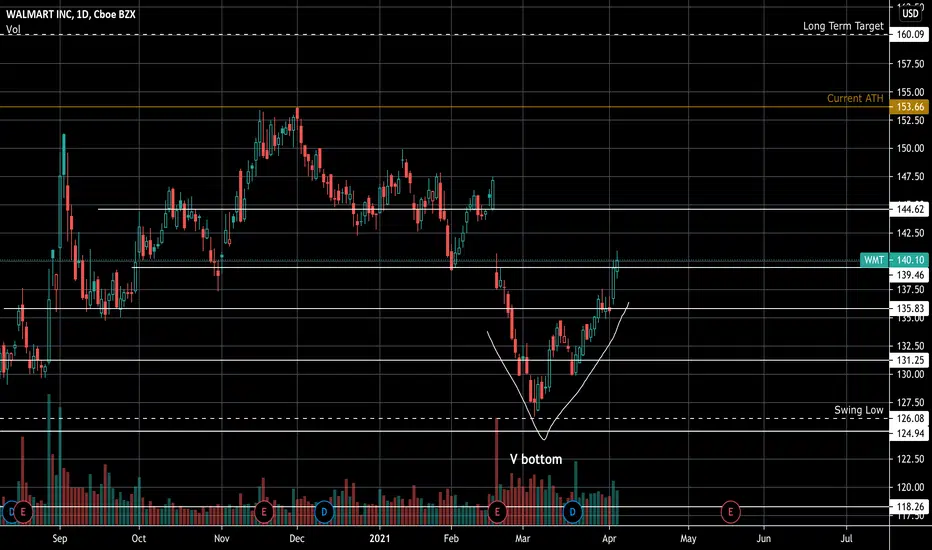
WMT 1Q Earning Target 2021WMT flopped its fourth quarter earnings in 2020 announcing -.74 cents a share. I expect a report with a lot more strength with integration of E-commerce into it online store models as well as less fear surrounding COVID-19 creating boost in sales. With only 1% of shares floating short, The slow grind up, which has been evident since the middle of March, is likely to continue without any strong resistance. Being the largest retailer in 2019 boasting 523 B in sales (NRF.com) doubling AMZN sales, this stock is a solid frontrunner as we move into a post pandemic economy. The NFP report on April 2nd of 916k (almost double the previous month report) compared to the 652k estimate is also encouraging as this could lead to more consumer spending. Still to come this month are MOM retail sale reports on the 15th and 16th which will could potentially back this thesis. Furthermore, with the market creating new highs quickly, there could be a tinge of uncertainty or heightened volatility as the rally hasn't really had much catalyst other than jobs, but with WMT's Beta of .47 (Zachs) this stock is relatively safe. With a debt to equity ratio at a 2 year low as well, this stock is definitely a strong buy in my opinion and I have set my post earnings target for 160 with this stock. This would be an all time high and about a 2% increase from current highs which is definitely within reason all things considered.
Stocks Ripping!!Stocks have ripped to new highs. The S&P is currently facing resistance at a Fibonacci extension level at 4073. The Kovach OBV has leveled off suggesting that are overbought and may see a retracement. There is a vacuum zone back down to 4009, but 4040, roughly the half-way point may be a nice support level as well. Our next major milestone is 4144, which is also a Fibonacci Extension level.

Stocks All Time Highs!!Stocks broke out to all time highs! We sensed they were poised for this, and there were two options to trade: anticipate the breakout or wait for a dip to lower levels first. Those who were patient were rewarded with a slight dip to buy, and those who yolo'd had to hold underwater a bit. We are currently seeing resistance at this new high, and a red triangle on the Kovach Reversals Indicator marks some trouble at 4032. The Kovach OBV is strong, but rounding off suggesting we may range at these new levels.

Breakout near for stocks??Stocks have regained highs. The S&P has just barely inched above highs at 3987, but is still having trouble with 4009. We are seeing some weakness at highs and there are two possibilities. First, we could see a retracement and continuation of that consolidation of volatility preceding the breakout. We could see a wedge or flag form. If so 3928 will be a good level of support. However, we could be gearing up for a breakout from current levels. So if you are a breakout trader pay attention to the momentum at open. We will need clear, definitive buying momentum in order to sustain a breakout. If we see ambivalence then a retracement is highly likely so watch lower levels for support.

What will it take for Stocks to Break Out??Stocks have retraced a bit from relative highs. The Kovach OBV is strong but has leveled off suggesting that we could range a bit at current levels. It is highly likely that the S&P will form some sort of consolidation pattern, either a wedge, flag or sideways continuation before the breakout. The retracement was paltry with respect to our expectations. The level 3909 seems reasonable if we dip further. If not, there is 3937. Look to the open for signs of momentum, and watch 3987 for resistance. if we see a lot of buying at this level then we can expect a breakout.

Stocks Reject Highs!!The S&P has continued to climb, and we have met relative highs again near 3987. However we are currently facing resistance here. We saw a swift rejection from these levels and have just breached the vacuum zone after breaking 3963. We will see support again at 3937 and 3928. It will take some momentum to break through these relative highs which will provide significant resistance after this most recent rejection. It is more likely that we will see some ranging behavior over the next few days bounded from below by 3867. We should see a consolidation of volatility which will precede a breakout.

RUSSELL 2K for a move to 2k?Small caps have underperformed of late and price action in the Russell is testament to that. We've seen three bearish outside days this year, and granted the sample size isn't huge - a function of viewing this on the daily - but in the prior two episodes, we saw the index fall around 9.5% on average in 7 trading sessions. With bond yields creeping higher, amid ISM manufacturing and NFPs due this week, will small caps continue to see outflows? If we see follow-through and price through yesterdays low then 2k could well be on the cards

Stocks Get a Much Needed LiftStocks caught a lift at market open. We've reached 3978 before facing a bit of a retracement. The Kovach OBV is strong which could suggest momentum is back. It's about time the malaise lifted for the S&P. We still need to break relative highs at 3987 to be considered properly bullish. We will definitely face resistance here. Then the next target is 4009. It is looking a bit overextended at the moment, so a pullback may be anticipated before we can break out. If this is the case, we could see levels as low as 3909.

Best Stock Trading Ideas!!Stocks took a significant hit yesterday. We stressed that they would find support around the 0.500 Fibonacci level and that was exactly where they found support. Subsequently a rally took us back to the 0.786 Fibonaci level at 3933, also a level we highlighted yesterday. The S&P appears to be forming another pseudo-megaphone pattern, 'pseudo' because we are not seeing higher highs, but we are seeing volatility increase, so the 'spirit' is there. The Kovach OBV is flat but at highs. This could be a sign that we are coiling up for a bull breakout. It also could mean we've peaked and are ready for further retracement. If we are ready for a breakout, watch 3963, otherwise we could retrace back to the 0.500 Fibonacci level at 3860, or even past this, extending the megaphone pattern.

$JSEKAP KAP Industrial Holdings. First target and consolidationAfter KAP broke the inverted head and shoulders neckline around the 342 level, it retested the breakout level and then moved up to reach the first target of 439 before it pulled back into what could end up as a bull flag. The flag still needs to be confirmed as it still forming. Watch this consolidation pattern carefully, as a 425 break could indicate that the next target of 500 could be in range.

$CML Coronation. Building a flagAfter breaking from a very defined channel between 4500 and 3900 in mid January the share moved strongly to around the 5275 levels from where it started to consolidate in what looks like a bullish flag pattern. A break of this pattern would be very bullish and would be an indication that the price target of 6000 is within reach.

$JSEZED Zeder. ConsolidationZeder has been trading within a defined consolidation channel for 5 months now. The bottom of the channel at 250 was reached once again and acted as a support level for a bounce. Channel players could add at these lower channel support level for a top of the channel target of 275. Watching the top of the channel closely as the previous break in February turned out to be fake.

Stocks Continue to RangeStocks retraced back to the support 0.618 Fibonacci support level at 3890. They are continuing the rather narrow range between this level and 3963. The Kovach OBV was strong but has flattened. It really could go either way at this point. Another retracement could take us to the 0.500 Fibonacci level at 3860. A rally would have to break 3933, before we could consider highs at 3987 again. The longer we range, the more probable a breakout is. We should see some conviction either today or tomorrow.
