AAPL-Bear SetupI have taken half of my position at the open, if we get the bounce in red I will add in that area or I will add with a breakdown of local low. Simple setup based on structure.
Equity

New Week, New OpportunitiesHere's our overview on the DE30 for the upcoming days. As always we say, never trade equities without following the news.
If you like the idea, support us with a like and a follow and don't forget to leave your opinion in the comments section.
This analysis is for educational purpose and not to be used on real accounts.

$JSERLO Reunert. Neckline break confirmationReunert broke what looked like an inverted neck and shoulders at around the 4250 neckline level. Two targets added to the chart looks like possible targets for this pattern. Stick to a stop loss level with a break on the daily chart below the neckline level.

$JSEANG Anglo Gold. Bear flag confirmationAnglo Gold Ashanti consolidated into what looked like a bearish flag pattern after a move down from 63000 to 30640. That bear flag seems to have broken, retested the flag break and are continuing the downward trajectory. Next target looks like 26800 levels.

$JSENRP Nepi Rockcastle. Upper channel resistance Nepi has together with most of the big players in the property space moved aggressively up in the last couple of months. Nepi has now reached the top of a larger channel and into a consolidation phase. This consolidation pattern (flag) needs to be watched carefully. An upper break through the 9600 levels could see a continuation of the upper trajectory. A break down from this flag pattern could see more downside. Neutral position and watching.

Stocks Face Volatility Near HighsStocks continue to see volatility at highs. We had a nice burst of bear momentum yesterday as the markets were pretty risk off. We have gotten support from 3887, and this seems to hold. Broadly, the S&P is likely to hold the rather large range between 3887 and 3963. We are at 3909 right now, which is broadly in the middle of this range. It could go either way. The Kovach OBV is on the uptrend, after registering the bear momentum. However, we are at the upper bound of the KRI, and near a significant level, so we may retrace back down to 3910

S&P 500 Retracement??The S&P is bouncing around between lower levels below highs. Currently 3910 is providing support, but may be forming the neckline of a head and shoulders. Stocks are looking very weak right now. The Kovach OBV is a bit oscillatory, but is broadly flat. The Chande is in the middle which suggests we may be looking at a further retracement. The first level of support would be 3887. This has provided support in the past. The next level would be 3867, which seems to align with a Fibonacci level. If we are wrong, we will know at open. We could easily retrace to 3937, or even back to highs at 3962.

Stocks Feel the Yield Rally! When to Buy Back??Yesterday, bond prices collapsed and stocks felt the bond fervor as investors clamoured onto higher yields for the first time in over a year. The S&P retraced from highs, but is still clinging to support at the next peg down from highs, between 3936 and 3927. We do appear to see an inverse head and shoulders pattern forming with the headline at 3937. Watch for a breakout from here at open, which would make a run back to highs at 3963. It is doubtful we will break this level today, but if we do 3970 is the next target. If we break down, which may be the case as the S&P looks like it is having trouble completing the second shoulder of the inverse H&S, 3908 and 3887 will provide support

S&P 500 to 4000!!!The S&P has hit our price target exactly. We had identified 3963 as a potential target using our Fibonacci Extensions several days ago. Currently stocks are ranging, feeling out the new price territory. It could go either way from here. We could see another retracement, which would take us down to 3937, 3928 or 3909 at the most. These would be good opportunities to buy back. If we breakout, the next target its fairly close at 3978. The next level after that is 4009.


$JSEZED Zeder. Flag break and retestAfter consolidation comes expansion. Watch Zeder for a test of 275 support. If that support hold, it should be very bullish for this share. Stick to a stop loss if it break convincingly back into the channel.

$JSEBAT Brait. Bottom of channel testRejection at the bottom of the channel and channel player scan add some in anticipation of another test of the top of the channel 400- 430 in the future. Stop loss below channel break 250 on the daily chart.

$JSERNI Reinet Investments. Resistance at 29280Reinet has move in a slight uptrend since Nov 2020 and has hit resistance around the 29200-29300 levels five times. If it continues to challenge this level and breaks it, 32200 and 33000 could come into play. Slow mover this, but a good addition to a diversified long term portfolio.

Breakout Imminent in Stocks!!!Stocks are consolidating into a triangle corrective wave. This is a perfect consolidation pattern an suggests a breakout is imminent. We are bullish of stocks and anticipating a bullish breakout at open which will take us back to 3928. From there we will likely meet resistance and consolidate further perhaps in a bull wedge before breaking out to higher highs. If we are wrong, we will find support at 3882 or 3871. The Kovach OBV is very strong and the Kovach Chande is neutral which is a perfect storm for a breakout.

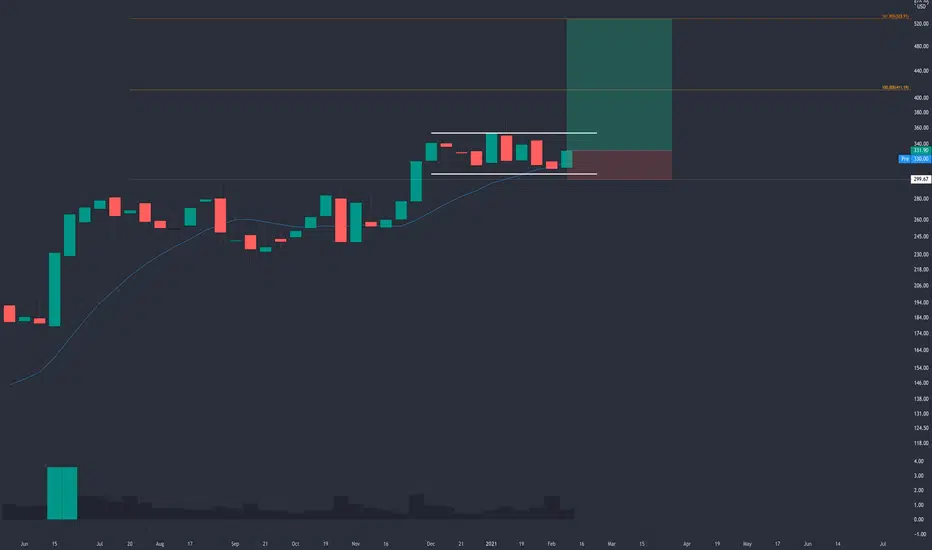
$SPOT - Flagging Above Support$SPOT looks like there may be a continuation to my previous target.
Adjusted the chart based on today's and I'm targeting 100% fib extension for first exit, 1.618 as second target.
Will update the chart once we get to the 100%.
NZDCAD H4 - Long Trade SetupNZDCAD H4
Mean best value in between the middle of the zones indicated? We talked about this in the webinars we have been pushing out, and hopefully it makes logical sense now as I post examples more frequently.
Potential double bottom on support again, this was out preferred buy zone, and obvious zone to look to catch bid. Eyes peeled.

$SOHU Looking very interestingSOHU results surprised to the upside and broke from it's consolidation channel. A target of $24,50 - $25 looks likely.

Stocks Reject All Time Highs!! What's Next??We called out resistance at new highs with stocks for many reasons. The higher highs were increasingly less pronounced, momentum was sluggish and the Kovach Chande was gradually tapering. That and being at or near ATH's would take some momentum to break through. We were spot on with this analysis. The S&P tried to break new all time highs, and did so for a split second before completely and utterly rejecting them, diving to support exactly at the levels we identified. It sliced through 3898 to finally find support at 3882, which would have been a great level to buy back, and some readers did take advantage. Currently we seem to have gained some momentum from the bounce off 3882. The Kovach OBV has turned positive again, and the Chande has swung up. This however suggests that we are back to overbought territory and are due for a rejection of highs at 3928 or 3937. If we are able to break highs again, which will likely happen next week 3963 is the target.

FRANCE CAC40 Retest The Previous Toplooking for cac40 index to retest pre covid-19 levels before going into new bear market.

Retracement In Stocks??Stocks have formed an extremely narrow range at highs. This is an extremely common behavior after an asset has made strides especially to the extent that the S&P has. However it does appear to be running out of steam. The Kovach OBV is still very strong, but has plateaued a bit, suggesting that momentum is waning. Additionally, although we have been seeing higher highs and lower lows, the hallmark of a bull trend, the extent has decreased with every attempt, forming an overall arc pattern. The signs are pointing to a correction in stocks or at least a sideways correction for a bit. If we do have a correction look to 3909, 3898, or even 3882 for support. These are a mixture of technical and Fibonacci levels. We are completely aware of bubble forming thanks to free Federal Reserve magic papers. So if stocks do breakout they will contend with 3937 first.

Stocks At Highs!! Retracement??Stocks have continued their ascent but are slowing down. Indeed, we are seeing higher highs, but at a decreasing extent. This suggests that a healthy retracement is coming. We are still 100% in bull mode, and would still solidly be so even with a retracement to 3824. A 50% retracement of the Fibonacci levels shown is much more likely, which could bring us to 3871. Of course, this assumes a healthy market not the bloated, fed fueled bubble of a stock market we have now. It is also perfectly reasonable under these conditions to break out again to new highs. If so, 3937 if a good target. Either way, it would be extreme FOMO to enter a long trade at this point, unless you expect an imminent breakout for some reason.

Stocks to Retrace from ATH'sStocks are facing some resistance at 3909, after breaking new highs once again. Our Fibonacci extensions predicted a price target of 3928, which the S&P will hit once it is able to break through 3909. It is likely that it will retrace from here first. The Kovach OBV was strong but has plateaued, and the chande (purple line) has dipped notably. We are still bullish of stocks but must note that the pendulum has swung to the bull side, and it's natural for it to swing back before another push for all time highs. The levels 3867 and 3848 will give us support. Currently we are finding some support at the psychological level of 3900.

$JSERLO Reunert. Neckline break ? Possible neckline break at 4340 level on Friday. This could be an inverted head and shoulders neckline break with a target around the 6500 level. Keep and eye on that 4340 level. It needs to hold. Bullish looking chart.
