Stimulus is going to push this even higherNice backdrop from the FOMC. Imagine higher highs, and pull backs will stay within the ema ribbon. If you are not long yet, buy the next dip.
Equity

Stocks Make New Highs!! Next Targets??Stocks broke through to new highs yesterday. The Kovach OBV suggests there was a lot of momentum here, and there had to be. The S&P formed a double top back in January validating the importance of 3867. It broke through and is currently having trouble with 3887. This is a level we called out last month, which was a Fibonacci Extension. The S&P is pretty extended right now, so we can expect a retracement, perhaps off 3887 to highs at 3867 or perhaps 3848. No one can deny the momentum in stocks, the Kovach OBV is quite strong. So eventually we will break through 3887 and hit 3928, then 3937. These are two somewhat proximal levels garnered from Fibonacci extensions. Note the vacuum zone between current levels and these targets. If the S&P is able to break new highs, it should sail through to those targets soon after.

S&P 500 Imminent Breakout!!Stocks are clinging to support at 3825. They have held a very narrow range between this and 3848 or so. It could really go either way from here. A narrow range always precedes a breakout, so whatever the S&P does, it is going to do with force. We are very close to all time highs, and these will not be easily broken. It will take some momentum to pierce through. If so, Fibonacci extensions suggest 3887 is our closest target. After that, we seem to have a bit of a vacuum zone before two Fibonacci extension levels at 3927 and 3937, just 10 points apart. From below, watch 3810, 3792, then 3758.

Stocks Volatile, Trade Carefully!!Stocks have maintained a period of extreme volatility. The S&P has zig zagged 200 points or so in the last few days. It has found support off lower levels at 3676, and has effectively returned to highs. It fell just short of all time highs, just under a congestion zone at 3844. It is likely to face resistance here. It is unlikely to see a breakout to new highs any time soon, since the S&P has extended almost 200 points already. This is quite a move even for stocks. We anticipate the volatility to continue, suggesting that we could test lower levels again. It is highly likely that we will test lower levels, then consolidate around highs, then breakout to achieve all time highs again. The levels 3792, 3810, and 3825 will all provide support.

Stocks Struggling for SanityStocks have displayed some extreme volatility over the last few days. The S&P has spanned about 200 points from highs to lows down in the 3600 handle. Currently, it has regained the 3800's finding support right around the psychological 3800 level. Even the Kovach OBV is somewhat oscillatory which shows the vicariousness of the momentum coming through this product. Eventually such extreme volatility will peter out, and we will have more well defined behavior soon. There is a double top at highs, which is a bearish sign. Also, we see a bearish crab cypher pattern on the daily chart. These are both ominous signs, so the fed will have to run the money printers on overdrive if they wish to prop up stocks for another bull run.

SPX-Bullish SetupCycle breaking out of the fourth wave and looking to complete wave 5 somewhere close to the 2.618 4100-4200 I'll start taking profit. Note the RSI hidden bullish divergence as well as the daily time-frame RSI has tagged and found support on the 40 lvl. Both of these two RSI signal indicate that we just completed a bullish correction for further up. Post any questions you may have or dm me. Happy Trading!

Stocks Face HeadwindsThe S&P has retraced significantly from highs. We are seeing quite a bit of volatility as large price swings of a full ATR or more are quite common with this product right now. These price swings have even registered with the Kovach OBV which is telling us there is a lot of momentum here in these buying and selling waves. The Kovach Chande is at highs. Since this is an oscillator, it is saying that the pendulum has swung to the buy-side and we are due for another retracement. If we are correct, we can expect the S&P to test 3713 or even 3675. From there it should find support. if it is able to breakout to the upside, there is a vacuum zone back to 3792

$JSEOMN Omnia. ConsolidationOmnia seems to be consolidating in a pennant formation. Keeping an eye on this one. Break from of this pennant to the upside would be bullish. Neutral for now.

$JSEZED Zeder. Consolidating Zeder consolidation between 275 and 256. A break above 275 could open 320 and 340 targets. Waiting

$PIK Pick & Pay. Falling wedge break. Important for PIK to claim 5670 overhead resistance to open a 6150 target

$CSB Cashbuild. Hitting weekly resistance"Hoping" for a inverted right shoulder to form from this and then a neckline break on this weekly chart. Waiting

Cautiously Optimistic of StocksStocks saw some incredible volatility yesterday. No doubt some of this is related to the GameStop saga. The S&P 500 has completely retraced the bear move only to give back thse gains and settle around a cluster of levels beginning at 3737. It is likely to find support here, at least for the moment, which seems to be verified over the past few hours. If it breaks further down it will have support at 3714. the next level is in the 3600 handle at 3694. The Kovach OBV has whipsawed which is extremely rare. Usually this indicator goes with the overall trend. This is telling us that there is an extreme amount of momentum in stocks lately, in both directions: selling and buying. It is difficult to determine the overall direction of stocks, however we still remain cautiously bullish for now.

What is happening here? What is giving us clues here?
Let's chat further about this in the network.
Cheers and trade safe
Dale

AAPL Short-Post EarningsMany reasons pointed out on chart for aapl to see a descent correction to test 125ish, maybe lower.

Cypher Pattern Breakdown in StocksStocks have faced a tremendous retracement. The S&P has blasted through levels in the 3800 handle. It tested the low 3700's before finally finding support. There is a bearish cypher crab pattern on the daily chart. This is an extremely bearish sign, and such a large selloff could be the initial breakdown from this pattern. The Kovach OBV is registring the sell off. Currently, the S&P is ranging between 3712 and 3750. It is reasonable that it should try to find footing after such a tremendous selloff. The boundaries of this range will provide support/resistance, so pay attention to what happens at open. The next levels of support are in the 3600's at 3695, then 3676 then 3658.

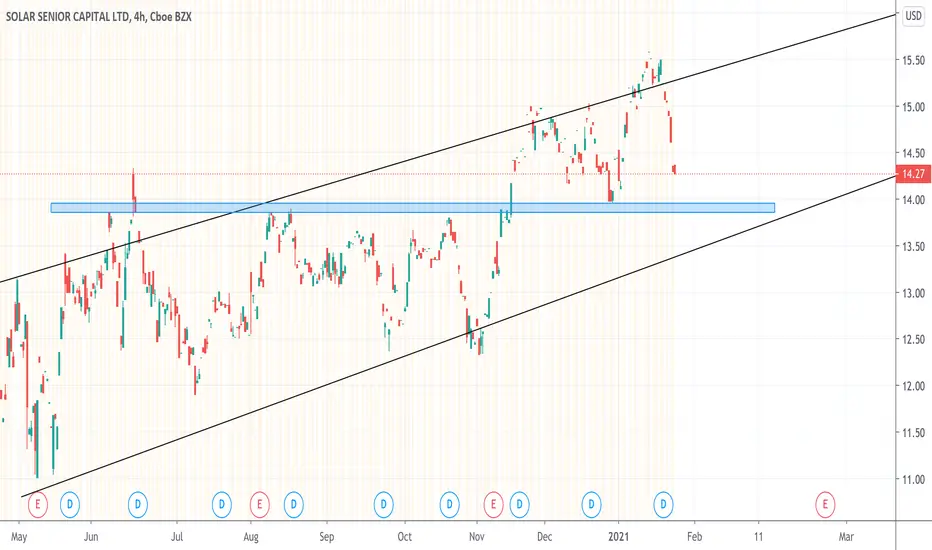
SUNS CAPITALSUNS CAPITAL is a private equity firm.
Based solely on the technicals, I will wait for it to decline till it's support before going long. Based on RSI, it seems to be declining. Will wait for a reversal before going long.
Based on the fundamental analysis, I guess its still pretty average (yet to compare against industry average).