Long Term Correlation Chart [20-30 Years View]This is comparing between the super trend of the S&P 500 (Cash) index and the US 10 year bond yields.
Previously, for a good 35 years, bond yields and equities shared a strong positive correlation. (1951 to 1986)
Then correlation swung the other way and for the next 37 years, we started seeing negative correlation. Falling yields with equities continuing the advancement.
Question is.. What happens now for the next 30-35 years?
Equity

Equity Line SwipeUP_TC 18/12/2023Good morning everyone. Like every month, I publish my Equity Line updated to 12/18/2023.
Since my last Equity line, I have had three Trades, one winning and two losing.
I am very sorry to have lost USDSGD and GBPUSD. I believed it, but it didn't go well.
My strategy provides, as explained in my old Equity Line, a risk/return of 1:4, where 1 corresponds to €500 and 4 corresponds to €2000.
Cordially,
Andrea Russo.

RENUKA SUGAR DAILY CANDLE CHART LEVELS 5.12.2023RENUKA SUGAR now in triangle pattern,once its breaks will expect 55-65 in mid-term,keep strictly on SL as 48.50 at Daily candle closing basis (DYOR)

tata consumer long tradeTata consumer product looks good here.
I have added 50% of trading allocation qty at 900 and 903.
Will add more on retest.

INFY 1H SYMMETRICAL FORMS TRIANGLE PATTERNINFY 1hour chart forms a Symmetrical triangle pattern more support in bottom trend line.
keep this stock in watchlist breakout will happen within 1 or 2 month.
Monitor this stock for both EQUITY and F&O trades.
My view in this stock is go LONG..
TARGET 1 ---> 1650
TARGET 2 ---> 1800

$NPN Naspers. The story of Naspers for 2023 - ConsolidationNaspers has been consolidating in a +-20% range between the high and the low for 2023.
Let's hope we get a Xmas rally to break the upper boundary limit and end the year on a high.

MOIL Ltd Multi year breakoutMOIL Decadal/Multi year/ All time High breakout in MOIL Ltd.
Recommended at 206,
View: Hold Add more Qty here,
revised target 550+

Equity Line SwipeUP 20/11/2023Hi Guys, thanks for being here.
Today I want to publish my "Equity Line", updated to 11/20/2023, with all the operations carried out on Trading View and therefore all documentable.
This Equity Line briefly explains my investment methodology. Of course many of you will disagree, but I'm here to share my methodology.
I started with a "Capital to Invest" of €5000. This capital is a fixed sum that will allow me to calculate 10%, which I will need to invest in every operation I carry out.
So at this moment, having that sum as "Capital to Invest", in each of my investments I will risk €500 to have, in 90% of cases (never less), a risk/return set at 1:4.
I have shown in the graph my last 4 investments of November, all published in advance in my profile.
I will publish a new EquityLine updated every month or with every operation, I haven't decided this yet.
If you like, follow me for more updates.
Cordially,
Andrea Russo.

SUNTV looks brightSuntv looks to be a good trade idea.
Stock has given good breakout and move today.
Have taken a long position at 634 around.

Gokul agro breakoutGokul agro has given strong breakout from sloping trendline today.
Good to go long here.
with SL of 115.5 for safe traders, and SL of 112.5 for risk takers.
personally taking 50% planned qty here, rest will add on retest.

Monarch trade entry#Monarch
Positional trade
entered at 408.5
SL is wide
used 50% of planned allocation
SL will be around 10%

NDX should bottom 6th of NovemberA lot of technical confluence to suggest a bottom of this move on Monday the 6th.
You have the 0.618 fib channel, 0.382 horizontal fib retracement, and 1.618 fib time-zone.

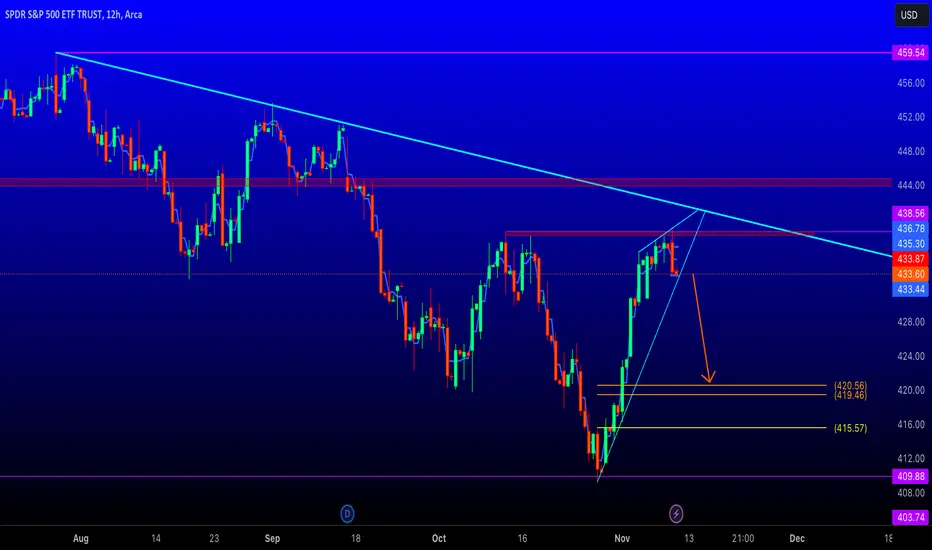
SCARED?!?! SPY LOOKS VERY BEARIS HERE!SPY has reached the range highs and has shown signs of weakness not being able to breakthrough the highs. It has been rejected and is now at a vital dynamic support. If this break (which i think it will), a move to the golden pocket (orange lines) could follow.
Calculate Your Risk/Reward so you don't lose more than 1% of your account per trade.
Every day the charts provide new information. You have to adjust or get REKT.
Love it or hate it, hit that thumbs up and share your thoughts below!
This is not financial advice. This is for educational purposes only.
EMIL Potential breakoutElectronics mart india ltd.
keep an eye.
moving around breakout area.
Trade long whenever breakout happens.

Are we rushing into the possible next Big Short?Is S&P 500 about to “CRASH”?
Are we rushing into the possible next Big Short?
So the S&P 500 futures contracts are depreciating in value, yes. Yet we foresaw this series of events. Has it been a rapid decline?
No.
The Price Action and structure continues sound.
There is no sign yet of panic or rapid selling signaling the Risk Off scenario all are predicting.
Do I expect further downside? Yes
I will go into my reasoning
1. DXY following a Bullish structure. Currently consolidating in a Bullish Flag pattern that could give us a break out of this pattern with a Higher High soon.
1. With a Bullish Dollar we can expect Bearish Equities.
Lets break ES pice action from top down.
- Monthly
- ES offered a Lower Low from June 23 Lows. But I am looking at the Monthly with caution since the month of October is not over yet.
- Weekly
- ES made its third down leg and yet it was unable to create a Lower Low in comparison to the week of October 2nd 23.
- The down closed weekly candle of last week looks strong enough to take out this low on momentum alone.
- So it is possible we will see 4235.5 before any other move.
-
- Daily
- On the Daily we see the last 4 Bearish days in a row, it can be assumed that the Bearish momentum along could carry price further down to establish a new Lower Low on this Bearish trend which will be at 4235.50
- I also like the potential of 4218.75
In conclusion. I do expect to see further downside but I would like to remind all that this will be the last week of October and to top that we are getting very close to establishing a new Lower Low on this Trend.
What does that mean?
Well we have had and extended leg down on this trend throughout the month of October. I would expect a retracement after a new Low is stablished with a subsequent bounce to settle a possible Lower High on this trend.
To accompany this thought it is the end of the Month and expecting a bit of retracemnt from the Monthly direction is healthy.
If you look at the Daily chart you will notice a gap between Thursday Oct 19,23
And Friday oct 20, 23. I am expecting price to target this Gap once the lows are stablished.
Still always follow price it will never steer you wrong.

SPY $400-$410 Support LevelNo need to overthink this one. Pretty clear trend line on a linear chart. Why linear? Cause we aren't looking at multiples in price change, logarithmic wouldn't be best used here, and I have seen many charts showing false trend lines with a log chart.
Logarithmic scales are useful when the data you are displaying is much less or much more than the rest of the data or when the percentage differences between values are important. This is not the case, we are only looking at price change from 2020-2023.
$400-$410 is a strong support level which I expect to hold, or at least bounce off of. However, this does not mean I expect the SP500 to break to new highs. Ultimately, I cannot predict whether we crash or break to new highs, but I would lean to lower lows. So be cautious here.
I plan to open some cheap $420-$430 November calls under $410.

Stocks went from pump to dump, what's in store?#stocks went from basing & curling higher to topping and rolling over.
DJ:DJI had 5 green candle days. It turned to 3 red days.
TVC:NDQ bounced nicely but it reversed the hardest and FAST.
CBOE:SPX is in between both indices,
CBOE:VIX had a GOOD day.
WARNING!!! The more it hangs around here the MORE DANGER equities are in.
Have a great week!!!

GVK POWER & INFRA | BEST PENNY STOCK TO NOWEntry Price - 9₹
SL - 4.5₹
Targets - 20,27,40,53,90+
In this channel, I share my expertise in trading strategies, technical analysis, and market trends to help you make informed decisions in your trading ventures.
Stay tuned for daily updates, in-depth market analyses, and real-time trading scenarios to witness firsthand how we transform from Zero to Hero in the trading world. My Only aim is to empower you with the knowledge and skills necessary to navigate the complexities of the financial markets successfully.
Disclaimer - All information on this page is for educational purposes only,
we are not SEBI Registered, Please consult a SEBI registered financial advisor for your financial matters before investing And taking any decision. We are not responsible for any profit/loss you made.
Request your support and engagement by liking and commenting & follow to provide encouragement
HAPPY TRADING 👍

NMDC - Breakout after 12 years of consolidation. NMDC - Breakout after 12 years of consolidation. Investing opportunity.
Important levels - Stop loss and targets are shown on the chart.
#multibagger #investing #wealth #stocks #sharemarket.

Angel oneAngel one looks good here to go long
Market had been weak, but this stock looks strong here.
I have taken long position at 1990.

Aster DM Partial entryHave made a long position in Aster DM.
Took 40% qty of planned trade for this script.
Rest of the quantity will be added on breakout retest area.

Myth-busting: top 6 misconceptions about commoditiesWisdomTree has long-standing expertise in commodities, and this asset class constitutes a core part of our business. We aim to debunk several myths that surround commodity investing1.
Myth 1: Commodities are only a tactical instrument
Some believe that commodities trade in a range and do not outperform over the long term. Furthermore, they think commodities only outperform in an ‘up’ phase of a commodity ‘super-cycle’.
Physical commodities are the fundamental building blocks of our society. Therefore, it is no surprise that their price movements largely explain inflation and tend to at least match inflation over the long term.
Furthermore, commodity investors most often invest in futures contracts, not physical commodities. Futures contracts have been designed as hedging tools to allow commodity producers and miners to hedge their production forward, making their businesses sustainable and allowing them to invest because they are insulated from the commodity prices’ short-term volatility.
Producers are willing to pay for this hedge, just as they would pay for insurance. Therefore, investors who provide this hedge by buying futures contracts receive an insurance premium that allows them to beat inflation over the long term. This ‘insurance’ is a permanent feature of commodity futures and doesn’t fall away through economic cycles. Thus, commodity futures are suitable for consideration as a strategic investment, not just tactical investments.
Commodities futures provide a positive risk premium, driven by their intrinsic link to inflation and embedded ‘insurance premium’. While upward phases of commodities’ super-cycle are historically advantageous for commodity investors, future-based broad commodity investments can deliver a risk premium in any part of a super-cycle.
Myth 2: Losses are guaranteed when commodities are in contango
Contango (negative roll yield) and backwardation (positive roll yield)2 are used to describe the state of the futures curve. It describes the relative position of the current spot price and the futures contract price. Drivers of roll yield include storage costs, financing costs, and convenience yield. Backwardation is often associated with demand strength when people are willing to pay more for immediate delivery than lock into a contract for later delivery at a cheaper price. Some believe that, because contango is the opposite state of backwardation, losses are guaranteed as a corollary.
The fact that Keynes’ theory is called ‘normal backwardation’ has caused some terminology confusion. However, what is described by Keynes is that futures contracts are generally priced at a discount to the expected spot price at expiry. It has nothing to do with the current spot price. In other words, the curve can be in contango, and the future price can still be at a discount to the expected spot price at maturity, that is, be in normal backwardation as well.
Using a numerical example, let’s say that WTI Crude Oil is worth $50 today. The market expects WTI Oil to trade at $55 in a month (expected spot price) because of storage and other costs. Keynes’ theory hypothesis is that the 1-month futures contract will be priced at a discount to $55, let’s say $54, to incentivise speculators to provide the hedge to producers. In this situation, the curve is in contango ($54>$50), and the expected risk premium is still positive at $1.
So, a curve in contango and a positive risk premium can coexist.
While the shape of the curve has an impact on the performance, it is not a good predictor of future performance.
Myth 3: Commodities are riskier and more volatile than equities.
There is a common perception that commodities are riskier than equities.
Equities and commodities are similar asset classes statistically. Their historic returns and volatility are quite close. Historically, commodities have exhibited higher volatility than equities in 42% of the 3Y periods since 1960. However, in a larger number of periods (58%) equities have shown higher volatility.
More importantly, the two assets’ distributions differ from a normal distribution with a significantly higher skew. But commodities have the advantage. They exhibit a positive skew (a tendency for higher-than-expected positive returns), when equities are known for their negative skew (their tendency to surprise on the downside).
Commodities have exhibited lower volatility than equities in 58% of the time rolling 3-year periods we studied and benefit from positive skew.
Myth 4: Commodities stopped being an effective diversifier after the 2008 Global Financial Crisis presented a structural break in commodity price relationships
Markets are becoming more and more efficient. With those changes, assets have become more correlated. It is clear that commodities have been more correlated to equities in the last 10-20 years than before. However, this is true of most asset pairs as well. US equities are more correlated to global equities. Equities are more correlated to high yield bonds. In a globalised world where correlations are more elevated, commodities still stand out for their lower level of correlation.
Note, commodities have continued to provide a cushion against equity and other asset crises in recent periods. For example, in 2022, commodities rose 16%, while US equities3 fell 18% and bonds4 fell 16%.
While 2008 marked an all-time high for the correlation between equities and commodities, their correlation has always oscillated. There have been earlier spikes of similar magnitude in the 1960s and 1980s. In 2020, we saw a similar spike in correlation, but correlations have more than halved since in 2023.
Commodity vs equity correlation tends to oscillate and has remained within normal historical ranges.
Myth 5: Inflation linked bonds are better than commodities at inflation-hedging
Some assets are often considered good inflation hedges, such as inflation-linked bonds (TIPS) or real estate. However, it is surprising that more people don’t recognise the superior inflation-hedging properties of commodities.
The beta to inflation (US Consumer Price Index (CPI)) of inflation-linked bonds and real estate, historically, is significantly lower than that of commodities (2.45): US TIPS (0), US Equity Real Estate Sector (1), House Prices (0.4). Furthermore, while broad commodities’ average monthly performance tends to increase when the CPI increases, this is not the case for other assets. The performance of TIPS appears to be relatively unrelated to the level of CPI. The performance of real estate, being equities or real assets, seems to worsen when the CPI increases.
Real estate suffers from the fact that, while rental incomes are linked to inflation (rents are part of the CPI basket, for example), the capital values themselves are not, and yet have a larger impact on the asset's price. Similarly, inflation-linked bonds are linked to inflation, but their price is also tied to real yields changes (through a duration multiplier) which tends to dilute the relationship to inflation itself.
Historically, commodities have been a better hedge to inflation than TIPS or real estate assets.
Myth 6: Futures are the best way to access gold for institutional investors
Futures markets tend to be extremely liquid and offer very low transaction costs. Therefore, investors assume that, if they can, it is always the most efficient way to implement a trade.
However, futures markets respond to their own constraints where banks tend to provide most of the hedging. Recently, banks have suffered from increasing regulation and operating costs that they have translated into their pricing of futures contracts, leading to significant tracking differences with the physical asset. Sometimes futures contracts are the only way to access a commodity, but for precious metals this is not the case.
For gold, this cost has, historically, represented 0.9%6 per year on average compared to owning gold bullion. Physically backed exchange-traded commodities (ETCs) have many advantages: limited operational burden, reduced tracking difference, cheap and liquid.
It is clear that commodities are a frequently misunderstood asset class, and many misconceptions remain today. For a fuller description of the fundamentals of commodity investing, please see The Case for Investing in Broad Commodities.
Sources
1 These myths were all addressed in The Case for Investing in Broad Commodities, November 2021, which takes a deep dive into commodity investing. This blog summarises and updates data addressing several of the ‘misconceptions’ listed in the piece.
2 For more information on contango and backwardation, see our educational ETPedia hub (specifically the ‘Costs and Performance’ tab).
3 S&P 500 TR.
4 Bloomberg GlobalAgg Index (government, corporate and securitised bonds, multicurrency across developed and emerging markets).
5 Source: WisdomTree, Bloomberg, S&P, Kenneth French Data Library. From January 1960 to July 2023. Calculations are based on monthly returns in USD. Broad commodities (Bloomberg commodity total return index) data started in Jan 1960. US TIPS (Bloomberg US Treasury Inflation-linked total return bond index – Series L index) data started in March 1997. US Equity Real Estate (S&P 500 Real Estate sector total return index) data started in October 2001. US House Price (S&P Corelogic Case-Schiller US National Home Price seasonally adjusted index) data started in January 1987. Historical performance is not an indication of future performance and any investments may go down in value
6 Source: WisdomTree, Bloomberg. From 4 June 2007 to 31 July 2023. The Performance of the physical Gold was observed at 1.30 PM Eastern Time to match the BCOM sub-index calculation time. You cannot invest in an Index. Historical performance is not an indication of future performance and any investments may go down in value.
This material is prepared by WisdomTree and its affiliates and is not intended to be relied upon as a forecast, research or investment advice, and is not a recommendation, offer or solicitation to buy or sell any securities or to adopt any investment strategy. The opinions expressed are as of the date of production and may change as subsequent conditions vary. The information and opinions contained in this material are derived from proprietary and non-proprietary sources. As such, no warranty of accuracy or reliability is given and no responsibility arising in any other way for errors and omissions (including responsibility to any person by reason of negligence) is accepted by WisdomTree, nor any affiliate, nor any of their officers, employees or agents. Reliance upon information in this material is at the sole discretion of the reader. Past performance is not a reliable indicator of future performance.

Combined US Indexes slammed furtherPreviously mentioned that the supports are being broken. It gave way after an expected bounce. The dip that followed came with confirmation technical signals as well as a lower low… suggesting that there is downward momentum still. Saving grace lies with a pullback rally to end the previous week just above the support line. However, this appears to be futile, with shallow bullish bounces expected, and a close below the major support line.
Thing is this… there should be a close below the line and it needs to hold below for another three weeks to firm up more downside. But a rally back up above that critical support (then turned resistance) would be a good bullish rally to look for, albeit later in the year end/beginning.
Next four weeks should see at least two weekly closes below support.
In line and in support of this indication, TIPS and TLT, with JNK have led the markets by pushing further new lows of late.
Heads up.
