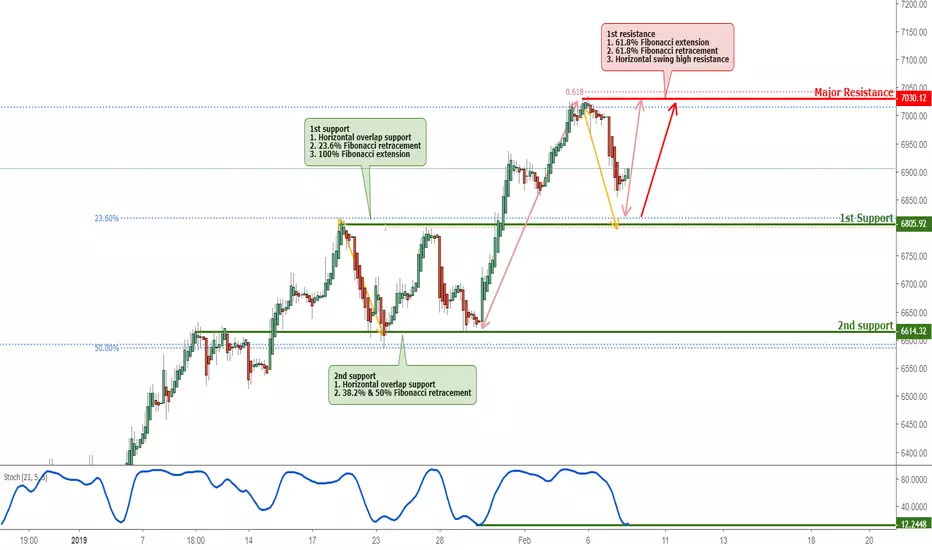
Nasdaq 100 approaching support, potential bounce!Nasdaq 100 index is approaching our first support at 6805.92(horizontal overlap support, 100% Fibonacci extension , 23.6% Fibonacci retracement ) where a strong bounce might occur above this level pushing price up to our major resistance at 7030
12 (61.8% Fibonacci retracement , 61.8% Fibonacci extension, horizontal swing high resistance). Stochastic (21,5,3) is approaching support and we might see a corresponding bounce in price above this level.
Trading CFDs on margin carries high risk. Losses can exceed the initial investment so please ensure you fully understand the risks.
Equityanalysis
SHORT Dow Jones Structure Intact below 26000 levels!The Dow Jones indice has rallied past our estimated price around 25100/300 by less than a percent. It is seen to be trading around 25390 levels in the spot market, and till the time prices stay below 26000 mark, the bearish structure remains intact. The wave structure is still suggesting that a potential 3rd of 3rd wave lower might be coming soon. The indice has earlier dropped 5 waves between 26950 and 24100 levels, labelled as Wave (1). This was followed by a flat corrective Wave (2) that got terminated at 26000 levels. The subsequent drop could be a lower degree wave i that terminated at 21700, followed by wave ii which is being terminated around the 25400 mark around this time. If the above structure holds true, we can expect the lower degree wave iii to drop lower as wave(3) unfolds. Bottomline is that prices should remain below 26000 levels going forward.
Disclaimer:
This written/visual material is comprised of personal opinions and ideas. The content should not be construed as containing any type of investment advice and/or a solicitation for any transactions. It does not imply an obligation to purchase investment services, nor does it guarantee or predict future performance. FXTM, its affiliates, agents, directors, officers or employees do not guarantee the accuracy, validity, timeliness or completeness of any information or data made available and assume no liability for any loss arising from any investment based on the same.

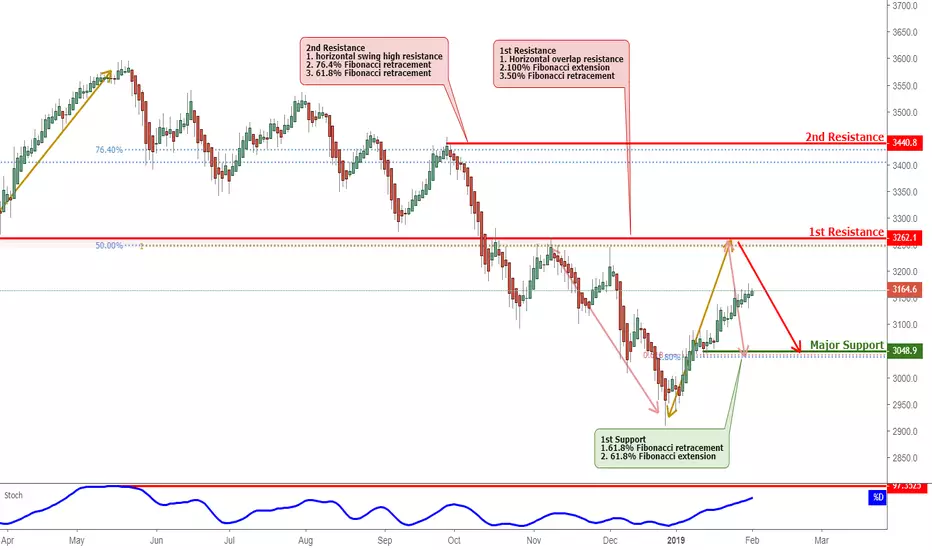
SHORT SHORT Euro Stoxx 50 approaching resistance, potential droEuro Stoxx 50 is approaching our first resistance at 3262.1(horizontal overlap resistance, 50% Fibonacci retracement ,100% Fibonacci extension ) where a strong drop might occur below this level pushing price down to our major support at 3043.7 (61.8% Fibonacci retracement ,61.8% Fibonacci extension )
Stochastic (89,5,3) is also approaching resistance where we might see a corresponding drop in price.

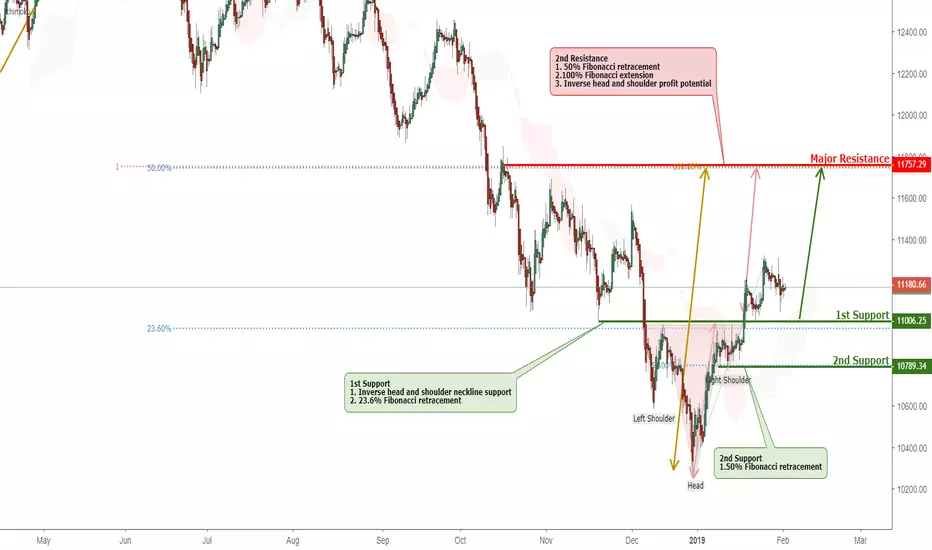
LONG LONG DAX bounced off support, potential for further rise!DAX bounced off our first support at 11008 ( Inverse head and shoulder neckline support, 23.6% fibonacci retracement ) where a further rise might occur pushing price up to our major resistance at 11757.29 (50% Fibonacci retracement , 100% Fibonacci extension , Inverse head and shoulder porfit potential ).
Ichimoku Cloud shows bullish trend where we might see a corresponding rise in price.
SHORT HSI approaching resistance, potential drop!HSI is approaching our first resistance at 28056.3 (100% Fiboancci extension, 38.2% Fiboancci retracement, horizontal swing high resistance) where a strong drop might occur below this level pushing price down to our major support at 26862.1 (61.8% Fibonacci retracement , horizontal swing low supoprt).
Stochastic (89,5,3) is also seeing a bearish divergence and approaching resistance where we might see a corresponding drop in price.

SHORT Dow ready to plunge lower in a 3rd of 3rd wave!Yesterday was an indecisive day as Dow Jones produced a doji on the daily chart , leaving room for a potential bearish reversal today. A potential top could be in place at 25109 levels earlier this week, at the fibonacci 0.786 (of drop between 26000 and 21800 levels) and downtrend line confluence. Looking at the wave counts, a higher degree Wave (3) might be unfolding lower, since Wave (2) terminated around 26000 levels earlier. Furthermore waves i and ii within Wave (3) might also have terminated at 21700 and 25100 levels as discussed earlier. If the above structure holds true, we should see a 3rd of 3rd wave drop lower in a swift manner. The down side potential remains below 21000 levels going further.
Disclaimer:
This written/visual material is comprised of personal opinions and ideas. The content should not be construed as containing any type of investment advice and/or a solicitation for any transactions. It does not imply an obligation to purchase investment services, nor does it guarantee or predict future performance. FXTM, its affiliates, agents, directors, officers or employees do not guarantee the accuracy, validity, timeliness or completeness of any information or data made available and assume no liability for any loss arising from any investment based on the same.

SHORT Euro Stoxx 50 approaching resistance, potential drop!Euro Stoxx 50 is approaching our first resistance at 3262.1(horizontal overlap resistance, 50% Fibonacci retracement ,100% Fibonacci extension ) where a strong drop might occur below this level pushing price down to our major support at 3048.9 (61.8% Fibonacci retracement ,61.8% Fibonacci extension )
Stochastic (55,5,3) is also approaching resistance where we might see a corresponding drop in price.
SHORT Dow Jones bearish against 26000!Believe it or not Dow Jones has hit the spot we have been waiting and anticipating since last several trading sessions now. Please note that the indice has hit convergence points of trend line resistance and the fibonacci 0.786 levels at 25100 levels and produce a bearish reaction on smaller timeframes. It is yet to produce a bearish signal confirmation on the daily chart but potential remains high in the next 1-2 trading sessions. Looking at the wave structure, a higher degree Wave (1) and (2) seem to be already in place at 24200 and 26000 levels respectively. A lower degree wave i and ii might be already in place now at 21800 and 25100 levels respectively. If the above counts hold, prices should stay below 26000 levels and a rapid wave iii of (3) should unfold taking prices below 21000 levels going forward.
Disclaimer:
This written/visual material is comprised of personal opinions and ideas. The content should not be construed as containing any type of investment advice and/or a solicitation for any transactions. It does not imply an obligation to purchase investment services, nor does it guarantee or predict future performance. FXTM, its affiliates, agents, directors, officers or employees do not guarantee the accuracy, validity, timeliness or completeness of any information or data made available and assume no liability for any loss arising from any investment based on the same.

HSI approaching resistance, potential drop!HSI is approaching our first resistance at 28057(horizontal swing high resistance, 38.2% Fibonacci retracement , 61.8% Fibonacci extension ) where a strong drop might occur below this level pushing price down to our major support at 26592 (50% Fibonacci retracement , 61.8% Fibonacci extension)
Stochastic (34,5,3) is also approaching resistance where we might see a corresponding drop in price.
Trading CFDs on margin carries high risk. Losses can exceed the initial investment so please ensure you fully understand the risks.

DJI-Daily Key ElementsKey levels to look out for, please refer to our 4 hr chart for a strategic view!

Euro Stoxx 50 approaching resistance, potential drop!Euro Stoxx 50 is approaching our first resistance at 3262.1(horizontal overlap resistance, 50% Fibonacci retracement ,100% Fibonacci extension ) where a strong drop might occur below this level pushing price down to our major support at 3043.7 (61.8% Fibonacci retracement ,61.8% Fibonacci extension)
Stochastic (89,5,3) is also approaching resistance where we might see a corresponding drop in price.

SHORT Dow Jones Carves A Lower High at 24860!The Dow Jones index has made yet another high at 24860 levels before pulling back, which could be a potential top for the down trend to resume further. Please note that Dow Jones pulled back close to the down trend line passing through around 25150 levels and just ahead of fibonacci 0.786 resistance at 25100 levels respectively. This might not be a confirmed bearish reversal though but potential remains for bears to take control from here. Looking at the wave structure, after having produced an impulse wave lower Wave (1), followed by a flat corrective Wave (2), the Dow Jones might be unfolding Wave (3) lower and might have completed waves i and ii at 21800 and 24860 levels respectively. If the above structure holds, we could see much lower levels going forward. Please note that 26000 levels needs to hold for bearish structure to build on from here.
Disclaimer:
This written/visual material is comprised of personal opinions and ideas. The content should not be construed as containing any type of investment advice and/or a solicitation for any transactions. It does not imply an obligation to purchase investment services, nor does it guarantee or predict future performance. FXTM, its affiliates, agents, directors, officers or employees do not guarantee the accuracy, validity, timeliness or completeness of any information or data made available and assume no liability for any loss arising from any investment based on the same.
