✳️Elrond [ERD/BTC] on Aug-16 #ERD $ERD #ERDBTCERD is in a downtrend but selling pressure is decreasing so we can expect a rebound of ERD with 230-240sts target over the next 4-5 days.
But if it falls out of the 170sts range, the ERD will have a sharp drop to 130-140sts, which is a reasonable buy zone where we could buy ERD back.
Erdbitcoin

ERD/BTC (Decision time?)ERD/BTC
-Elrond unable to break the trendline resistance
-It is now in the critical area where a decision needs to happen
-If I will trade this kind of market scenario
-The safer approach is to wait for the breakout direction
-A break of trendline resistance will give Buy signal
-While a breakdown of support will lead to 135 potential next support
-Please be patient, and always use proper trade size management

#ERD It's time to sell ERD ERD/BTC After a massive about 2800% pump in 3 months ERD needs to cool down.
Bulls seems to be exhausted and they start to sell theirs ERD bags and book the profits.
TA:
ERD has broken the support and retest it as a resistance and seems to continue down.
On daily time frame we can see that it had formed inverted Head and shoulders pattern witch is a bearish sign.
Also it had printed regular bear divergences on RSI and on stochastic RSI
I will buy again this gem around 40 sats .

Bearish Accumulation on ERDHello, traders.
ERD is forming a Bearish Accumulation pattern called a Bear flag.
A bear flag pattern is constructed by a descending trend or bearish trend, followed by a pause in the trend line or consolidation zone. The strong down move is also called the flagpole while the consolidation is also known as the flag.
The bear flag pattern comes after a strong move downwards. The stronger the movement, the bigger the profit potential is.
After we identify the market trend and the characteristics of an excellent bearish flag pattern, we need to wait for confirmation that the trend is about to resume.
There are two basic approaches to enter the market with the bear flag pattern. Aggressive traders will enter at the top of the bearish flag as this will secure a little bit of more significant profits.
Best regards.
Sando and Gustavo.

ERD/BTC (Bearish Two Lower Highs?)ERD/BTC
-After the price printed two Lower Highs
-It started breaking local support at the moment
-If this candle will fail for the next 12-24 hours
-There is a huge chance of potential previous resistance retest
-Which is located around 183 sat range
-That's still over -15% drop from the current price
-I only recommend opening a Buy position once reversal signs are seen

ERD Elrond Retracement LevelsElrond has now a market cap of 300 000 000 usd with a circulating supply of 13,323,533,427 from a total supply of 20,000,000,000 ERD.
My first target is 97satoshi in the short term.
If you are interested to test some amazing buy and sell indicators, which give the signal at the beginning of the candle, not at the end of it, just leave me a message.

ERD making RISING WEDGEERD is ranging between two trend line T1 as resistance and T2 as support.
Resistance has been tested twice at T1 and also support has been tested twice on T2.
ERD Needs to test the daily levels at 187 and have to break for a bull run. Other it is going to retrace back to 161 which is a daily support.
ERD is making RISING WEDGE PATTERN
If we see at the volume, it is decreasing but the price action is respecting the rising wedge, indication that price may fall from rising wedge. The volume needs to increase in order to break the daily level. Otherwise it going to pull back.

ERD is about to go higher from here- ERDBTC has a support zone between 61 and 62 sats, which lies at the confluence of both the 0.618 fib level and an ascending trend line.
- We will have a price reversal confirmation after breaking the 66 sats resistance level. This will mark the breakout of the descending channel and will trigger an upward move.

ERD/BTC (Testing New High?)ERD/BTC
-testing the recent top resistance at 71 sat
-if ERD can break this top and retest as new support
-we will likely see another upward continuation
-my upside target is the fib resistance zone between 80-85 sats

ELROND ($ERD)💲 | Why Elrond is the Secret to Financial Freedom👁️🗨️ Elrond will pay you $60k if you break its blockchain before its MainNet launch. That is attractive, but honestly, ERD has been paying you to just smash the buy button like a caveman (no coding skills necessary)... and that is attractive too.
Jokes aside, ERD has been on a very evident uptrend since the COVID bottom and it looks like the bulls have more room to run. Let's take a look at some levels.
Support:
The S1 bullish S/R flip has already acted as support after we ran the previous swing low. This level should act as support again if needed.
Below S1 is the S2 orderblock created on the way up. This could act as support if, for example, the wider crypto market falters. Despite this, the bulls' best bet is to avoid any trip below S1 and to simply maintain momentum.
Resistance:
The R1 orderblock formed at the previous swing highs is our first point of resistance. The best bet for the bulls is to blast through this, thus avoiding consolidation between R1 and S1 with a chance of testing S2 or lower.
The ultimate goal for the bulls is the R2 orderblock. A break above R1 with an R2 target means some nice percent gains for the bulls and further strength and momentum on that ERD chart. That is exactly what the bulls want to see to keep this chart looking great.
Summary:
With ERD's MainNet on the way and price in an uptrend, Elrond bulls have a great setup. All they need to do is keep the momentum going. The question is, can they do it, or are they going to let R1 get in their way?
Resources:
www.coindesk.com + finance.yahoo.com
Hit that 👍 button to show support for the content and help us grow 🐣

ERD/USDT (1 Upside Push More?)ERD/USDT
-broke above 200ma
-testing the mid resistance line
-new immediate support at 16000s
-if daily candle close bullish
-we could expect more upside
-and climb up to 22500s

ERD/USDT (Bullish Breakout: over 40% upside target)ERD/USDT
-bullish trendline breakout
-bull cross of 50ma and 20ma
-new key support is set at 111s
-upside target is up to 177s
-stoploss below 50ma

ERD/USDT (Bullish breakout of pattern: Up to 50% profit target)ERD/USDT
-A bullish breakout of the ascending triangle
-New potential immediate support at 9740
-Upside target is up to 14925
-Stoploss below 50MA

ERD ANALYSIS (DOUBLE BOTTOM CONFIRMED!)ERD ANALYSIS:
ERD has confirmed a support zone as it double bottomed near 15 sats. ERD is now on the rise hitting 20 sats. There was one small rejection off the 200MA, but given the fact that ERD is newer than most, I dont think this play a major rejection. I expect 20 sats to be broken and a push upwards toward T1 at 22 sats, T2 at 24 sats, T3 at 26 sats, and lastly T4 at 36 sats. The difficulty for ERD buyers will likely occur between T3 and T4 from the zone of 26 to 36 sats. The double top at T4 is a clear sign to exit trade completely. I will update the chart when the time comes, if ERD decides to break past this point, we can re-open for longer term profits!
Possible Entries: 20 sats

ERD LONG$ERD
Didn't completely fall out of the sky alongside the other IEO's. I'm thinking we retest the range EQ followed by a bounce to retest the 30 sat region; from there idk.


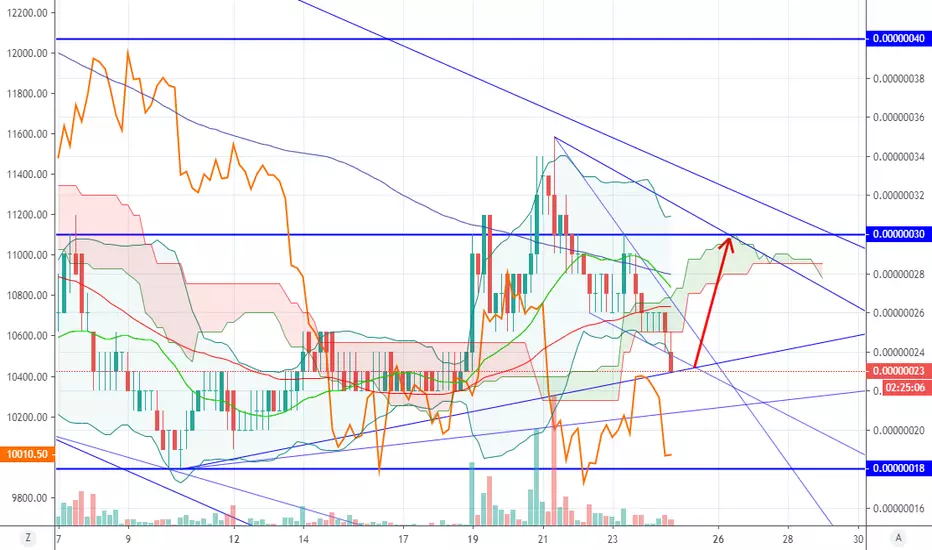
ERDBTC formed bullish Gartley | Upto 27% potential ideaElrond / Bitcoin cryptocurrency has formed a bullish Gartley pattern and entered in potential reversal zone.
This PRZ area should be used as stop loss in case of complete candle stick closes below this zone.
I have used Fibonacci sequence to set the targets:
Buy between: 0.00000023 to 0.00000022
Sell between: 0.00000025 to 0.00000028
Regards,
Atif Akbar (moon333)

Elrond-ERD Is Looking Ready For A Bull Run.BINANCE:ERDBTC is looking much healthy for a Bull run.Apart from the indicator we must notice that Binance has announced supporting ERD Staking.
Indicators: RSI , Macd both are bullish . Market sentiment is also bullish. Falling Wedge Breakout is also completed
(Just not forget to watch Price Movement as BTC moves)
We are focusing on FIb levels. Consider them as your targets.
Buy Between 17 and 19.
Our First Target is 27 Sats.
For Day Trade you can Consider selling between 21, 24.
Happy Trading.
Please Comment Your ideas and thoughts.

Elrond (Sept 16) #ERD $ERD #BTC $BTC #USDT $USDTBuy : Close to 16sts / 0.0017$ as possible
Sell : 20-22-24 / 0.002-0.0022-0.0024$
Mid-Hold : 25-30 / 0.0026-0.003$
Stop : 14 / 0.0015$

ERD entering in potential reversal zone |A good long opportunityPriceline of Elrond (ERD) / Bitcoin cryptocurrency is forming a shark pattern and soon it can be entered in potential reversal zone.
I have used below targets using fibonacci sequence:
Buy between: 0.00000021 to 0.00000019
Sell between: 0.00000023 to 0.00000028
Regards,
Atif Akbar (moon333)

ERD ping-pong between 18 sat support and 24 sat breakUp- ERD still in Strong Accumulation phase- will bounce after whales bought back;
-4 massive accumulation triangles shows that ERD will break the 25 sat sooner than expected;
-boots will drive ERD price next week to 30 sat if BTC stops losing space'
