ES | SP500 - Weekly Recap & Gameplan - 03/08/25📈 Market Context:
Traders are currently anticipating a possible 0.25% rate cut during the upcoming September FOMC meeting, which continues to support the broader bullish framework.
Although the market pulled back after the Non-Farm Employment Change data came in below expectations, overall optimism remains.
Sentiment has now cooled off from last week's greed and shifted to a more neutral stance. Historically, August tends to bring some chop and pullbacks, but the structural bias still leans bullish.
🧾 Weekly Recap:
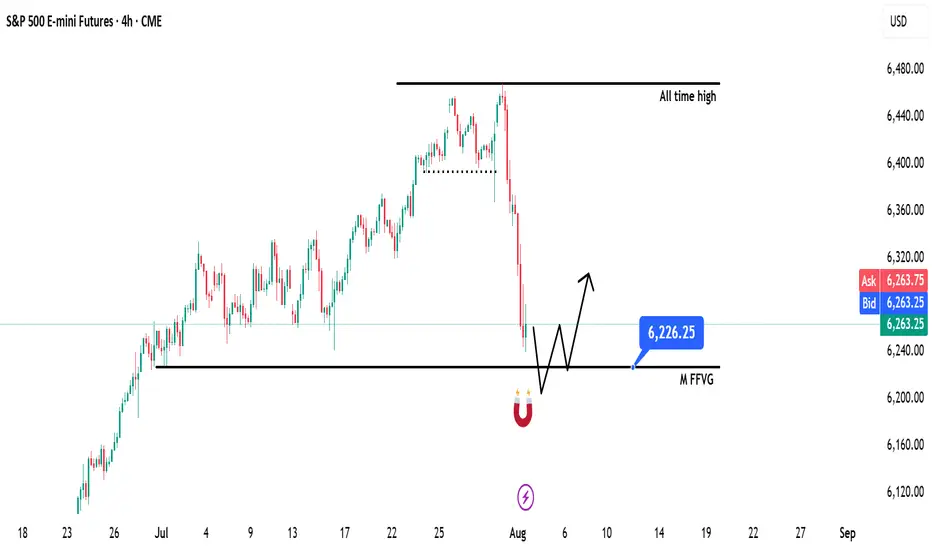
• ES kicked off the week with strong upward momentum, climbing steadily into Thursday.
• Along the way, price swept a key 4H swing high, breaking into new highs before initiating a retracement.
• This price action hinted at a short-term distribution and possible liquidity grab ahead of a correction.
📌 Technical Outlook & Game Plan:
→ I'm anticipating a move into the Monthly Fair Value Gap — a high-probability liquidity zone on my radar.
→ That area could act as a springboard for bullish continuation or at least provide a strong reaction.
→ Until that happens, I remain short-biased targeting the 6226$ zone, which I've marked as a major level.
🎯 Setup Trigger:
Once price taps 6226$, I'll monitor for:
• Clear break of structure on the 4H and 1H timeframes
• Formation of new demand zones indicating potential reversal
→ On confirmation from the lower timeframes, I’ll shift my focus toward long setups, potentially targeting new highs.
📋 Trade Management:
• Stoploss: Below the demand zone formed on 1H–4H
• Target: I’ll trail my stop to lock in profits as price moves higher
• Note: Although I’ll be watching for ATH retests, I plan to manage risk actively and book profits along the way
💬 Like, follow, and comment if this breakdown supports your trading! I’ll be sharing more detailed setups and educational posts — stay connected!
Es!
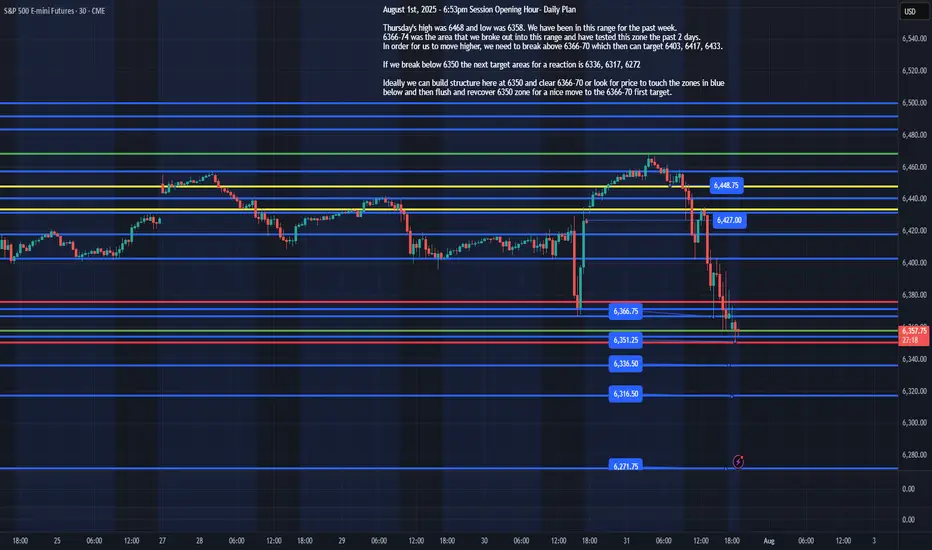
ES - August 1st, 2025 - Session Opening HourAugust 1st, 2025 - 6:53pm Session Opening Hour- Daily Plan
Thursday's high was 6468 and low was 6358. We have been in this range for the past week.
6366-74 was the area that we broke out into this range and have tested this zone the past 2 days.
In order for us to move higher, we need to break above 6366-70 which then can target 6403, 6417, 6433.
If we break below 6350 the next target areas for a reaction is 6336, 6317, 6272
Ideally, we can build structure here at 6350 and clear 6366-70 or look for price to touch the zones in blue below and then flush and recover 6350 zone for a nice move to the 6366-70 first target.
I will update the plan based on overnight price action by 8am EST, Friday August 1st, 2025
ES Weekly Recap & Gameplan – 27.07.2025🧭 Market Sentiment
The overall sentiment remains bullish, supported by:
• Declining inflation figures
• Trump’s pivot toward aggressive rate cuts
This shift reinforces a risk-on environment across U.S. indices.
🔙 Previous Week Recap
• ES continued its price discovery journey
• Price ran the 4H swing liquidity and shifted market structure
• A clean 1H demand zone was established post-MSS, leading to a strong move toward new ATH
• A bullish trendline has also formed as a visual representation of this momentum
• I anticipated a deeper retracement last week but adjusted my execution based on the ICT SMT concept — see previous week’s ES plan for details
📊 Technical Analysis
Looking forward:
• My expectation is a continued bullish price discovery
• Watching for price to tap into and potentially deviate below the Daily Fair Value Gap (D-FVG)
• This zone also aligns with the 0.5 Fibonacci equilibrium level, which I consider a discounted entry zone
• Confluence of liquidity + trendline + FVG + Fib makes this an ideal location for new long setups
⚙️ Setup Trigger & Trade Plan
Entry Strategy:
• Wait for a clear 1H–4H market structure shift
• Look for demand zone formation within the discount zone
• Execute long trades after confirmation and retracement into this zone
Trade Management:
🎯 Target: New All-Time Highs
⛔ Stoploss: Swing low beneath 1H–4H demand structure
🗨️ If you found this analysis helpful, don’t forget to like and drop a comment below — I’d love to hear your thoughts and setups for the week!
📥 Follow me for more weekly breakdowns and real-time updates throughout the trading week.

07/24/25 Trade Journal, and ES_F Stock Market analysis EOD accountability report: +1452
Sleep: 4 hours
Overall health: need to catch up on sleep
** VX Algo System Signals from (9:30am to 2pm) **
— 9:37 AM Market Structure flipped bullish on VX Algo X3! :white_check_mark:
— 10:10 AM VXAlgo ES X1 Sell Signal :white_check_mark:
— 12:30 PM Market Structure flipped bearish on VX Algo X3! :x:
— 1:00 PM VXAlgo NQ X1DD Buy Signal :white_check_mark:
— 1:30 PM Market Structure flipped bullish on VX Algo X3:white_check_mark:
**What’s are some news or takeaway from today? and What major news or event impacted the market today? **
Today's market was a bit wild in the morning with a lot of big moves, sot here was opportunity to money if followed the signals.
I mostly finished trading by 12:30 because there was so many big moves.
**News**
(US) Pres Trump: Regarding firing Powell, would be a big move, it's not necessary; No pressure for Powell to resign; Have 1-3 names in mind for Fed Chair position
**What are the critical support levels to watch?**
--> Above 6370= Bullish, Under 6355= Bearish
Video Recaps -->https://www.tradingview.com/u/WallSt007/#published-charts

Extended rally off April lows should be completing imminentlyEvery so often, a market move defies conventional expectations of retracement—and the rally off the Liberation Day lows is exactly that. It’s extended longer and climbed higher than even the most bullish forecasts imagined in early April. No one remembers the calls for an imminent recession by most large Wall Street firms.
Now, we're pushing into yet another all-time high—despite glaring negative MACD divergence and a financial media landscape that’s nothing short of euphoric.
The narratives being pushed? Honestly, it’s hard to write them with a straight face:
Tariffs are no longer inflationary. Apparently, I wasted time and tuition learning international trade theory and macroeconomics. Who knew deficits and trade imbalances didn’t matter anymore? Who pays tariffs again? ...never mind.
Weak momentum since mid-May signals not exhaustion—but an “unhealthy absence” of institutional selling, which apparently means the retail trader is in full control now. Because that always ends well... right?
July 21 Special Update : Metals, SPY & More. What's Next.This special update is to highlight why I continue to believe traders should stay very cautious of this rally in the SPY/QQQ/BTCUSD.
Underlying economic data suggest that this is one big speculative rally following the April Tariff collapse.
And, the economic data I see from my custom indexes suggests the markets are moving into a very volatile and potentially dangerous topping pattern.
As I've stated many times in this video. I'm not saying the markets have topped and you should SELL EVERYTHING. I'm suggesting this market is extremely over-valued in terms of the underlying risk factors at play and the very clear data that suggests the markets are already in a recessionary price trend.
You may ask, "How can the markets continue to rally like this in a moderate recession?".
The answer is simple.
All bubbles end with a super-speculative phase. This phase is where everyone piles into a euphoric attempt to ride the rally higher.
It happened in the late 1990s. It has happened again through the 2000-2005+ housing bubble. Heck, it has occurred in the collectors market over the past few decades where people spent fortunes on the "hottest items" (think Beanie-Babies) only to find out they bought at the height of the bubble.
That is why I continue to urge traders to remain cautious and to withdraw profits from this speculative rally phase. Protect your investment capital immediately and consider the risks associated with the information I share in this video.
I'm not trying to scare anyone. I'm just trying to be realistic in terms of what I see in my data and why I believe now is the best time to MOVE TO SAFETY.
My data suggests that the markets are about to enter a fragile and potentially dangerous pullback phase. If you want to ride it out - go for it.
Otherwise, prepare for significant volatility over the next six months or more.
Get some.
#trading #research #investing #tradingalgos #tradingsignals #cycles #fibonacci #elliotwave #modelingsystems #stocks #bitcoin #btcusd #cryptos #spy #gold #nq #investing #trading #spytrading #spymarket #tradingmarket #stockmarket #silver

ES Weekly Outlook & Game Plan 20/07/2025ES Weekly Outlook & Game Plan
🧠 Fundamentals & Sentiment
Market Context:
ES continues its bullish momentum, driven by institutional demand and a supportive U.S. policy environment.
📊 Technical Analysis:
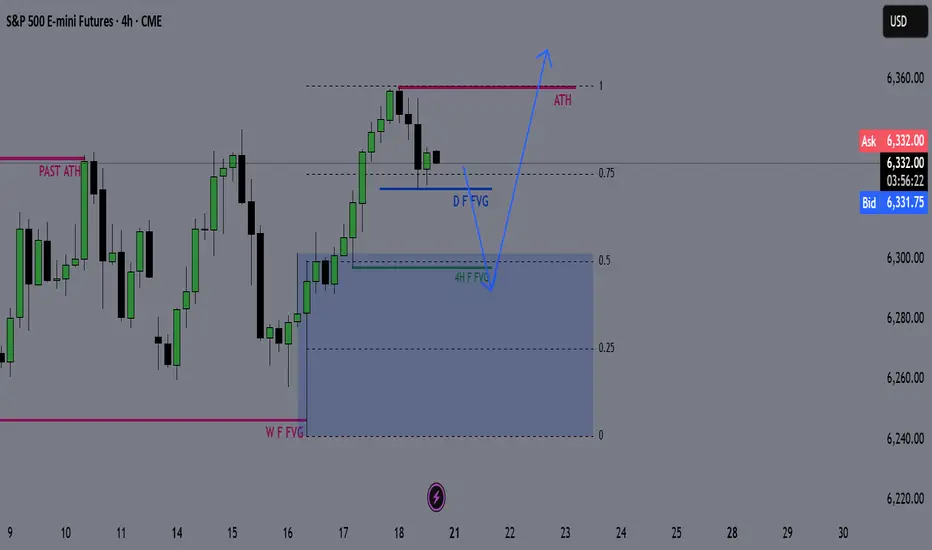
Price is currently in price discovery, and the weekly structure remains strongly bullish — so I prefer to follow the strength.
We might see a minor retracement before pushing further above the all-time high (ATH).
🎯 Game Plan:
I'm expecting a potential retracement to the 0.5 Fibonacci level, which is the discount zone in a bullish environment.
Interestingly, the 4H liquidity zone aligns perfectly with the 0.5 Fib level — this confluence suggests price may gather enough energy from there to make new highs.
✅ Follow for weekly recaps & actionable game plans.
DIYWallSt Trade Journal:$238 Lessons From Monthly Expiration07/18/25 Trade Journal, and ES_F Stock Market analysis
EOD accountability report: +238.75
Sleep: 5. hours
Overall health: Was working late last night and didn't get much sleep.
VX Algo System Signals from (9:30am to 2pm)
— 8:30 AM Market Structure flipped bullish on VX Algo X3!
— 10:30 AM Market Structure flipped bearish on VX Algo X3!
— 11:10 AM VXAlgo ES X1 Buy signal (didn't work that well)
— 12:10 PM VXAlgo NQ X1DD Sell Signal
— 12:19 PM Market Structure flipped bullish on VX Algo X3!
What’s are some news or takeaway from today? and What major news or event impacted the market today?
Today was monthly expiration for options and we got a lot of X7 Sell signals but structure was bullish so I tried to take a long at MOB and got burned. Flipped bearish and started shorting the rest of the day and ended up making money back.
News
*US STOCKS MOVE LOWER AFTER REPORT SAYS TRUMP PUSHES FOR 15-20% MINIMUM TARIFF ON ALL EU GOODS
What are the critical support levels to watch?
--> Above 6335= Bullish, Under 6315= Bearish
Video Recaps -->https://www.tradingview.com/u/WallSt007/#published-charts

SP500 ES Weekly Recap | ATH Deviation → Pullback or Powell Pump?Overview:
ES made a new all-time high last week, sweeping the previous high with strong momentum.
However, the move ended up being a deviation, and the price quickly reversed — suggesting short-term exhaustion.
Bearish Scenario (Baseline):
🔻 Rejection from ATH
🔻 Possible retracement targets:
12H Swing Low (turquoise line)
Weekly Fair Value Gap (purple zone)
I believe a pullback into those levels could provide bullish continuation setups for new highs. I’ll look for LTF confirmation once price reaches those zones.
Bullish Scenario (Catalyst-Driven):
🚨 If Fed Chair Powell resigns this week (a circulating macro rumor), the market may not wait for retracement.
This could lead to an aggressive breakout, driving ES and risk assets straight into new ATHs again.
Plan:
✅ Watch for LTF confirmation after pullback
✅ Stay open to both scenarios
✅ Focus on HTF bullish structure as long as key levels hold

NQ Weekly Recap-Projection 13.07.2025NQ Weekly Recap + Outlook
1️⃣ Recap:
NQ made a new All-Time High, but the breakout ended up being a deviation. Price got rejected and started pulling back.
This signals potential weakness and suggests price may want to explore lower levels.
2️⃣ Bearish Scenario:
📍Target: Daily Swing low (Blue line)
📍Deeper target: Weekly Fair Value Gap (Purple zone)
I’ll look for LTF confirmations around these zones to position for potential longs.
3️⃣ Bullish Catalyst Watch:
There’s increasing speculation that Powell may resign this week.
If that happens, we could see:
✅ Strong bullish momentum
✅ Little to no retracement
✅ Immediate push into new ATHs
Weekly Plan Summary:
🔸 Scenario 1 - Pullback Continuation:
Look for reactive long setups at Daily Swing or W FFVG zone.
🔸 Scenario 2 - Powell Resignation:
Expect a breakout move with momentum — potentially no retrace.
Stay nimble. Trade what the chart confirms, not what the news promises.

SPY/QQQ Plan Your Trade Special Update : BUCKLE UPThis video is a special update for all TradingView members. I felt I needed to share this information and present the case that I believe poses the most significant risk to your financial future - and it's happening right now.
Several weeks ago, I identified a very unique mirror setup in the SPY and kept an eye on how it was playing out. I needed to see confirmation of this setup before I could say it had any real likelihood of playing out as I expected.
As of today, I'm suggesting that we now have excellent confirmation that the US/Global markets are about to enter a deep consolidation phase, lasting through the rest of 2025 and possibly into 2026 and early 2027.
The interesting thing about this price pattern/structure is that it is almost exactly the same as the 2003-2007 structure, which I believe is the origin of this mirror setup. Almost down to the exact type of price bars/patterns I'm seeing.
Many of you are already aware that I've been calling for a critical low cycle in the SPY on July 18 for many months. What you may not realize is that the pattern is based on Weekly price data. The July 18 cycle low can have a span of +/- 1-3 weeks related to when and how the cycle low pattern plays out.
Watch this video. If you have any questions, message me or comment.
I'm still here, doing my best to identify and unlock the secrets of price action and to help as many traders as I can.
Price is the Ultimate Indicator.
Get some.
#trading #research #investing #tradingalgos #tradingsignals #cycles #fibonacci #elliotwave #modelingsystems #stocks #bitcoin #btcusd #cryptos #spy #gold #nq #investing #trading #spytrading #spymarket #tradingmarket #stockmarket #silver

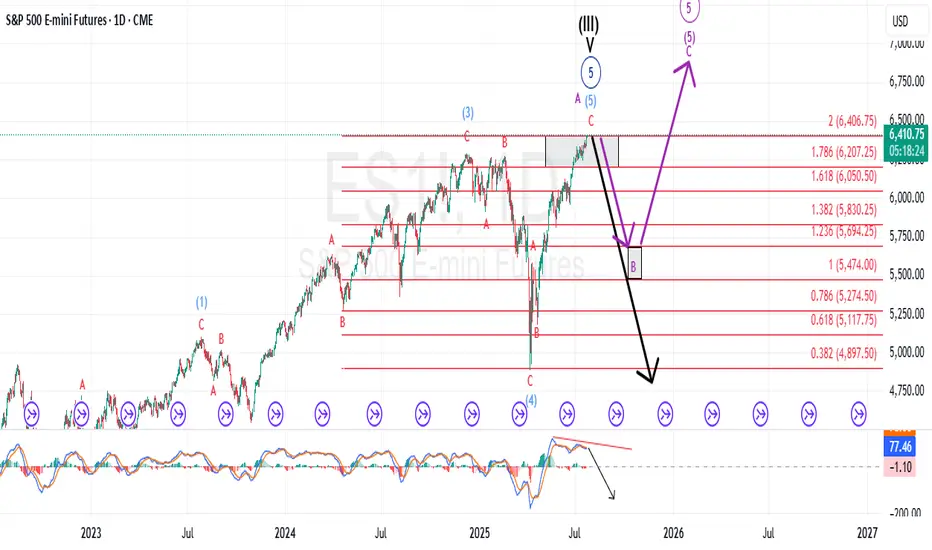
Are We Completing the Larger Ending Diagonal Now?The last time I updated followers of my work; I stated that the pattern was advancing, but NOT with confidence, and that it is marked with choppy, overlapping price action that appears to be an ending diagonal. Those sentiments have not changed.
However, what has changed is I was forecasting a more pronounced drop first before getting to new highs. It is now possible; this move higher is completing that move on a more immediate basis. Although I cannot rule out the previous larger ABC... it is more likely once this high completes, it could represent the end of the bull market.
Only the structure of the decline will inform us what is playing out.
I will warn followers that once this more immediate high completes, I am expecting a forceful and swift reversal that will undoubtedly catch most traders off guard.
Best to all,
Chris

SPY/QQQ Plan Your Trade End Of Week Update For 7-4Happy 4th of July
I've been very busy with projects and new tools for traders, as well as the new book I'm working on, and thought I would deliver an End Of Week update for everyone.
In this video, I cover the past Cycle Patterns and how they played out for the SPY/QQQ, Gold/Silver, and Bitcoin, as well as add some of my own insight related to the market trends.
All of my systems are still LONG and have not changed. I still believe this market is extremely overbought, and I believe it could roll over at any moment into a pullback - but we need to wait to see if/when that may/does happen.
Gold made a big move higher this week, and I believe that move could continue throughout July.
Bitcoin made a surprising Double-Top and is not rolling downward. Could be a breakdown in the markets as BTCUSD tends to lead the QQQ/NQ by about 3-5 days.
The SPY/QQQ rallied like a rocket all week. It was absolutely incredible to see the markets rally like this. But, I'm still cautious of a sudden rollover top.
I managed to catch some nice trades with options spreads this week, and my metals positions were on fire. I'm still trading from a "hedge everything" mode as I don't trust this rally, and I'm still watching for REJECTIONS near these new highs.
Stay safe and GET SOME.
DM me if you have any questions.
#trading #research #investing #tradingalgos #tradingsignals #cycles #fibonacci #elliotwave #modelingsystems #stocks #bitcoin #btcusd #cryptos #spy #gold #nq #investing #trading #spytrading #spymarket #tradingmarket #stockmarket #silver

SPY/QQQ Plan Your Trade For 7-1 : Post Market UpdateToday was a very powerful day for the Cycle Patterns - particularly for Gold and BTCUSD.
Gold rallied as the Cycle Pattern predicted a RALLY in TREND mode.
BTCUSD collapsed on a CRUSH Cycle Pattern.
The SPY Cycle Pattern predicted a Gap Reversal pattern. We did see the Gap today and a moderate reversal in price. But the SPY, as usual, continued to try to melt upward.
I highlighted a very interesting TWINNING pattern in Bitcoin in this video. Pay attention.
Get some.
#trading #research #investing #tradingalgos #tradingsignals #cycles #fibonacci #elliotwave #modelingsystems #stocks #bitcoin #btcusd #cryptos #spy #gold #nq #investing #trading #spytrading #spymarket #tradingmarket #stockmarket #silver

SPY/QQQ Plan Your Trade for 6-25 : Breakaway PatternToday's Breakaway pattern suggests the SPY/QQQ may attempt to move into another breakaway price move - very similar to yesterday's price move.
I will add that I believe the SPY cycle patterns have already moved through a breakaway phase with the ceasefire news early this week. I believe the gap and breakaway move yesterday may be the breakaway trend we are expecting today.
That would suggest the markets could pause and pullback a bit over the next few days.
Gold and Silver are trying to find a bottom after the brief selling that took place over the past few days. I really do believe Gold and Silver are poised to make a big move higher.
Bitcoin is on a terror to the upside. But be cautious of the downward cycle channel that may prompt a rollover in BTCUSD near the $107,500 level.
I spend a little time near the end of this video highlighting my work on the Tesla 3-6-9 price theory and going over a few examples for my new book on trading.
Enjoy the quick look at some of the more advanced techniques I'm working to unlock for all of you.
Get some.
#trading #research #investing #tradingalgos #tradingsignals #cycles #fibonacci #elliotwave #modelingsystems #stocks #bitcoin #btcusd #cryptos #spy #gold #nq #investing #trading #spytrading #spymarket #tradingmarket #stockmarket #silver

SPY/QQQ Plan Your Trade For 6-24 : Post Market UpdateThis post-market update highlights the weakening volume while my primary proprietary modeling system continues to stay BULLISH.
The markets are really quite interesting right now. Weakening volume in this Gapping uptrend, today, suggests traders are not buying into the ceasefire between Iran and Israel.
Additionally, the move in metals suggests a PANIC phase has setup in the US markets.
This type of panic phase typically leads to selling of assets and moving capital into CASH.
I suggest traders continue to prepare for a moderate melt upward trend over the next few days - but be prepared for any potential breakdown (possibly trying to FILL THE GAP).
This market appears to be running on fumes.
While I believe Trump's policies will lead to a stronger bullish price trend over the next few years, these disruptions and the potential for consumers to pull away from spending/economic activity over the second half of 2025 is still very real.
Buckle up.
At this point, hedge your trades, move some capital into CASH and prepare for bigger price volatility as we move into July 2025.
Get some.
#trading #research #investing #tradingalgos #tradingsignals #cycles #fibonacci #elliotwave #modelingsystems #stocks #bitcoin #btcusd #cryptos #spy #gold #nq #investing #trading #spytrading #spymarket #tradingmarket #stockmarket #silver

PREVIEW LONDON SESSION - Tue 24th June 2025 --- LONGWe had one demand filled day.
And I don't see it stopping. We have blown through 100 and 125 projections and I predict 150 will be reached soon. SO, after london open I will be looking for LONG discounts on the 5m/15m charts and targeting 6162.50 (poc strike) that coincides with 150 (PINS OFF) projection.

SPY/QQQ Plan Your Trade For 6-23 : Afternoon UpdateWhat happened to the CRUSH pattern?
Everyone wants to know why the CRUSH pattern didn't show up today. Well, I keep telling all of you these SPY Cycle Patterns are based on GANN, Tesla and Fibonacci price structures. They do not take into consideration news, global events, or anything outside of PRICE.
They are predictive - meaning they attempt to predict potential price shapes/patterns weeks, months, and years in advance.
The markets, obviously, are seeking some normalcy after the Iran conflict. I thought the CRUSH pattern would have been a perfect fit for today - but obviously the markets didn't agree.
If you have been following my videos, you know I keep saying the US stock market is acting as a global hedge for risks. Traders are pouring capital into the US stock market as a way to avoid global risk factors.
Traders are also pouring capital into Gold/Silver. Demand for physical metals is through the roof right now.
Time will tell if my Excess Phase Peak pattern plays out as I expect or if we rally to new ATHs.
Obviously, this sideways rollover topping pattern could present a breakaway in either direction.
Again, my patterns are not correlated based on news or other events. They are strictly price-based.
Get some...
#trading #research #investing #tradingalgos #tradingsignals #cycles #fibonacci #elliotwave #modelingsystems #stocks #bitcoin #btcusd #cryptos #spy #gold #nq #investing #trading #spytrading #spymarket #tradingmarket #stockmarket #silver

Futures Watchlist for week ending 6/27/2025Come join as i go through the future tickers that im watching this week and where i see them going. With war talks filling up on social media this will add to our volatility and we will look at key levels to capitalize off of it! Let me know your thoughts on these tickers. Also let me know if there is another symbol futures or stocks that you want me to breakdown for you!

SPY/QQQ Plan Your Trade For 6-23 : CRUSH PatternToday's CRUSH pattern suggests the markets will struggle to find any support for a rally. A CRUSH pattern is usually a large breakdown type of price bar that moves aggressively against the dominant trend.
Som, today I'm expecting some fairly large price action and I believe the markets may start a breakdown move this week as we continue to get more news related to the Israel/Iran/US conflict.
This week will be a "resettling" week in my opinion. Buyers will start to actively liquidate and reposition assets as we move deeper into this conflict. When buyers turn into sellers (to get out), the markets usually react very aggressively in trend.
Metals continue to hold up without making any big moves. I believe the increased FEAR level could play out as a moderate rally for metals over the next 15-30+ days.
BTCUSD broke down very hard (more than 6%) over the past 3-4+ days. This is a big move downward for Bitcoin and could suggest US technology stocks/sectors could also collapse on fear of a "rollover top" in the US stock market.
Smart traders will hedge and pull capital away from this potential top - just like I've been suggesting for the past 2-3+ weeks.
Oddly enough, if we do get a rollover/top this week because of the Iran conflict, it plays right into my Excess Phase Peak pattern and the predictions I've been making over the past 4+ months.
No, I don't foresee events like this Israel/US/Iran conflict. I can't see into the future.
What I can do, and continue to try to deliver, is the best analysis I can offer without becoming BIASED by indicators, comments, or other inputs.
I just read the chart and will tell you what I see as the most likely outcome.
Get some..
#trading #research #investing #tradingalgos #tradingsignals #cycles #fibonacci #elliotwave #modelingsystems #stocks #bitcoin #btcusd #cryptos #spy #gold #nq #investing #trading #spytrading #spymarket #tradingmarket #stockmarket #silver

A Trend on Borrowed Time, A Micro ED within a Larger ED?Since mid-last month, the broader equity market has been grinding higher — but not with confidence.
The advance has been marked by choppy, overlapping price action that feels more hesitant than bullish. Yes, prices continue carving out higher highs and higher lows, but MACD momentum tells a different story. With every push upward, the MACD weakens, flashing warning signs beneath the surface. Taken through the lens of Elliott Wave theory, this unfolding pattern carries all the classic fingerprints of an Ending Diagonal — a structure that often signals a trend on borrowed time.
Key Characteristics of an Ending Diagonal:
1. Position in the Wave Structure:
A. Occurs in Wave 5 of an impulse wave or Wave C of a corrective pattern (such as a zigzag or flat).
B. Rarely, but sometimes, seen in Wave 3 of an impulse, but this is generally associated with a leading diagonal, not an ending one.
2. Structure:
A. Composed of five sub-waves, labeled (i), (ii), (iii), (iv), (v).
B. Each of these sub-waves subdivides into 3 waves (i.e., they are all corrective or "3-wave" structures, often labeled as a-b-c).
C. This gives the whole pattern a distinct 3-3-3-3-3 internal structure.
3. Price Behavior:
A. Overlapping waves: Wave 4 often overlaps with the price territory of Wave 1, which is normally a rule violation for standard impulsive structures — but it's allowed in an ending diagonal.
B. Converging trendlines: The upper and lower boundaries of the diagonal typically form converging lines (like a wedge), though they can also be parallel in some cases.
C. Diminishing momentum: Often accompanied by momentum divergence, meaning price makes a new high or low, but momentum indicators (MACD, RSI) do not confirm.
4. Implication:
A. An ending diagonal suggests the current trend is running out of steam.
B. Once complete, a sharp reversal or significant correction is expected.
In my analytical view, the byproduct of an Ending Diagonal often lures market participants into a conflicted state — cautious, yet unable to ignore the persistent upward grind. You’ve probably heard the old market adage: “Don’t fight the tape.” In this case, that mentality sets in as traders, wary but worn down, finally throw in the towel and join the advance — only for the market to seemingly punish that decision with a sharp reversal.
Many experienced traders describe their Ending Diagonal experience the same way: “The moment I finally stopped fighting the trend and got long, it was as if the market was waiting for me — and reversed hard.”
That is how I would describe this micro ED we appear to be in the final stages of what I’m counting as the micro wave v of (v) of Minor A.
For now, no key structural support levels within the Micro Ending Diagonal have been breached, so the advance can certainly stretch a little higher. But make no mistake — in my opinion, this remains one of the most dangerous, deceptive patterns to engage with.
Last week, I closed my short out-of-the-money ES call positions during the micro wave iv pullback (not shown on the above chart). Ideally, I’m looking for an opportunity to reestablish a similar position this week. From there I will reassess the larger Ending Diagonal pattern you see outlined on the chart above.

SHORT @ London Open - Monday June 23rd 2025I believe Sellers are in control of the auctions. I see a nice distribution wall above to launch shorts from. Target the 150 where there seems to be liquidity target making sense of a short trade. ALWAYS wait for Lopen. Demand may come in and take over 6025/Dist Wall. If so there is plenty to like about the LONGS then with liquidity above. How price comes into 6025 at Lopen is what we need to be looking for.

SPY/QQQ Plan Your Trade For 6-20 : Pause Bar PatternToday's Pause Bar pattern suggests the SPY/QQQ will slide into a sideways type of PAUSE in price action today. I'm not expecting much to happen and if we do see any breakaway or breakdown trending it will likely be related to news.
While we have options expiration today and a host of other things that could drive the markets, I believe the markets are struggling to find direction right now. Thus, a pause in trading would be somewhat normal after a holiday-shortened trading week.
Gold and Silver are struggling after a brief rally last week. I believe this is fear related to the Israel/Iran conflict. Metals should continue to move higher.
BTCUSD is slightly higher (forgot to cover BTCUSD in the video), but not moving into a breakaway phase.
Overall, everything is very flat in early trading today. It may stay that way with my PAUSE BAR pattern.
Get some.
#trading #research #investing #tradingalgos #tradingsignals #cycles #fibonacci #elliotwave #modelingsystems #stocks #bitcoin #btcusd #cryptos #spy #gold #nq #investing #trading #spytrading #spymarket #tradingmarket #stockmarket #silver
