Support and Resistance Areas: 5879.75-5972.75
Hello, traders.
Please "Follow" to get the latest information quickly.
Have a nice day today.
-------------------------------------
(ES1! 1D chart)
There are two important support and resistance areas.
5879.75-5972.75 and 5664.75-5720.50 sections.
If it rises after receiving support near the 5879.75-5972.75 section, it is expected that the 6031.75-6051.50 section will act as resistance.
If it falls in the 5879.75-5972.75 section,
1st: 5664.75-5720.50
2nd: M-Signal indicator on the 1M chart
You should check whether there is support near the 1st and 2nd sections above.
-
Thank you for reading to the end.
I hope you have a successful trade.
--------------------------------------------------
Es1

Macro Outlook: Trade War Jitters, Deficit, NFP FridayAlthough there is a headline fatigue and markets have been stabilizing with the worst of trade war story behind us, the fact is that uncertainty still looms. President Trump announced over the weekend that he will double down on US steel and aluminum tariffs from 25% to 50% effective June 4th.
Highlight this week is US Jobs data this Friday. A key point to determine the resilience of the US labor market. With FED Chair Powell speaking today and FED speakers scheduled throughout the week, it will be key to watch how they shape markets' probability of rate cuts?
As we previously explained, ongoing uncertainty and dragging trade concerns present more risks until resolved. Here are some key points to consider:
It remains to be seen whether the trade deficit will continue to worsen or begin to reverse. April trade data, along with any policy shifts such as a reversal on reciprocal tariffs, will be important to monitor. These indicators will provide insight into how businesses are interpreting ongoing trade uncertainty. The key question is whether they will continue front-loading inventory in anticipation of future disruptions, or if the focus will shift toward restructuring supply chains and reining in spending as part of a longer-term strategic adjustment.
At the same time, consumer spending remains resilient, supporting overall demand. However, pressure may be building on business balance sheets, particularly businesses with poor cash flow to manage front loading inventory spending as the trade environment remains volatile. If consumer spending begins to weaken, businesses may be forced to cut costs, scale back investment, or offer steep discounts to clear excess inventory. This could lead to a cycle of margin compression, especially if firms attempt to pass higher costs onto price-sensitive consumers, potentially suppressing demand further.
Conversely, if businesses choose to absorb rising costs to maintain competitive pricing, they face deteriorating margins but may be betting on continued strength in consumer credit, household savings buffers as evident. Consumer confidence, despite being low, is not an accurate indicator in times of uncertainty. Here, we should watch what consumers do and not the sentiment.
In this scenario, firms may delay cost-cutting in the hope that continued strength in consumer spending will support revenues through the rest of the year.
A central tension remains: businesses must navigate a delicate balance between protecting margins and preserving demand. Meanwhile, persistent trade uncertainty and tighter financial conditions may slow capital investment and hiring, further complicating the outlook. Whether firms shift from defensive postures like front-loading toward long-term structural changes in supply chains will hinge on how durable current consumer strength proves to be and how responsive trade policy becomes in the months ahead.
Ongoing front-loading has caused ripples as the trade deficit has further widened. Will this reverse as businesses focus on sales and revenue instead of front-loading inventory?
In our analysis, trade imports, trade balance, consumer spending and corporate profits will be key to monitor despite being lagging indicators.
On the other hand, equally important to watch and monitor goods exports, durable goods to assess and evaluate the other side of the equation.
However, our focus is on imports as manufacturing jobs are at their lowest in US history.
Once the dust has settled and trade deals are locked in, it will be important to note if Exports by Country experience any significant shifts.
What does all this mean for the stock market and futures? In simple terms, the yearly pivot and last month’s high is a major resistance area for index futures. Until this is cleared, we may see a range bound market and two way trade. There is a lot of weak structure to revisit lower. Markets may perhaps retest this before resuming higher. What we would want to see is, last month’s low holding support and this month’s price action trading inside previous month’s range or resuming higher.
If we revisit May Monthly Lows, we may see increased selling pressure come in.

Bulls and Bears zone for 06-03-2025SPX has been trading in a range since mid May. Perhaps a pullback might be in the cards.
Level to watch: 5946 --- 5948
News to Watch:
US Factory Orders 10:00am
US JOLTS 10:00am

S&P500 Giant Inverse Head and Shoulders waiting for its breakoutThe S&P500 index (SPX) appears to be forming the Right Shoulder of a long-term Inverse Head and Shoulders (IH&S), the pattern that made the April 07 bottom of the Tariff War correction.
Currently supported by both its 1D MA50 (blue trend-line) and 1D MA200 (orange trend-line), once the overhead Resistance/ neckline breaks, we expect a +24.55% rise to the 2.0 Fibonacci extension, the equivalent of the rise it made from the April bottom up until now.
The target given is 7400.
-------------------------------------------------------------------------------
** Please LIKE 👍, FOLLOW ✅, SHARE 🙌 and COMMENT ✍ if you enjoy this idea! Also share your ideas and charts in the comments section below! This is best way to keep it relevant, support us, keep the content here free and allow the idea to reach as many people as possible. **
-------------------------------------------------------------------------------
Disclosure: I am part of Trade Nation's Influencer program and receive a monthly fee for using their TradingView charts in my analysis.
💸💸💸💸💸💸
👇 👇 👇 👇 👇 👇

Weekly Market Forecast: Monday UPDATES!How accurate were the forecasts for S&P 500, NASDAQ, DOW JONES, Gold and Silver futures given in the Weekly Market Forecast for this week?
BULLSEYE!
Enjoy!
May profits be upon you.
Leave any questions or comments in the comment section.
I appreciate any feedback from my viewers!
Like and/or subscribe if you want more accurate analysis.
Thank you so much!
Disclaimer:
I do not provide personal investment advice and I am not a qualified licensed investment advisor.
All information found here, including any ideas, opinions, views, predictions, forecasts, commentaries, suggestions, expressed or implied herein, are for informational, entertainment or educational purposes only and should not be construed as personal investment advice. While the information provided is believed to be accurate, it may include errors or inaccuracies.
I will not and cannot be held liable for any actions you take as a result of anything you read here.
Conduct your own due diligence, or consult a licensed financial advisor or broker before making any and all investment decisions. Any investments, trades, speculations, or decisions made on the basis of any information found on this channel, expressed or implied herein, are committed at your own risk, financial or otherwise.

S&P 500 – Projection to the SouthLooking at the market's behavior using the orange median line/fork, one can clearly see how the market reacts when it touches one of the lines.
Median lines/forks are not an oracle. They simply project the highest probable path of the price based on a mathematical calculation inherent to the tool.
If you follow the rule set, money management, and risk management, you have a wonderful framework that offers a significant advantage in trading the markets.
Let’s take a look at the current situation:
The orange fork:
– Price closes outside the fork (1)
– Multiple retests of the L-MLH (textbook behavior) (2)
– Break of the 1/4 line, heading toward the 1st warning line (3)
Next movement pattern according to the median line framework:
– Drop to the white centerline (4)
– Retest of the centerline (5)
– 1/4 line (6)
– Lower median line parallel (7) with a possible retest
– Orange centerline of the pendulum fork (8)
Wishing everyone a wonderful start to the week.

Weekly Market Forecast: Stocks, Gold, Silver & Crude OilIn this Weekly Market Forecast, we will analyze the S&P 500, NASDAQ, DOW JONES, Gold and Silver futures, for the week of June 2 - 6th.
Stock Indices are looking more bullish than bearish. Valid buys only!
Gold is moving sideways. Wait for confirmation before a buy/sell signal.
Oil prices may tick lower. Trade carefully.
Enjoy!
May profits be upon you.
Leave any questions or comments in the comment section.
I appreciate any feedback from my viewers!
Like and/or subscribe if you want more accurate analysis.
Thank you so much!
Disclaimer:
I do not provide personal investment advice and I am not a qualified licensed investment advisor.
All information found here, including any ideas, opinions, views, predictions, forecasts, commentaries, suggestions, expressed or implied herein, are for informational, entertainment or educational purposes only and should not be construed as personal investment advice. While the information provided is believed to be accurate, it may include errors or inaccuracies.
I will not and cannot be held liable for any actions you take as a result of anything you read here.
Conduct your own due diligence, or consult a licensed financial advisor or broker before making any and all investment decisions. Any investments, trades, speculations, or decisions made on the basis of any information found on this channel, expressed or implied herein, are committed at your own risk, financial or otherwise.

Stock Market Forecast | TSLA NVDA AAPL AMZN META MSFTStock Market Forecast | CME_MINI:NQ1! CME_MINI:ES1! SPY QQQ
Mag 7 Forecast | NASDAQ:TSLA NASDAQ:NVDA AAPL AMZN META MSFT GOOGL

S&P500 finishing re-accumulation and sets eyes on 6230.The S&P500 / SPX has turned sideways after an impressive recovery from April's lows.
The 1day MA50 provides the same kind of support as it did after the October 2023 rebound.
The RSI pattern on both sequences is also similar and it suggests that the price is at the point where it breaks upwards to the Rising Resistance.
Target 6230.
Follow us, like the idea and leave a comment below!!

NQ Daily Orderflow, MMXM swing points Market Efficiency ParadigmDaily orderflow on NQ. How it formed why it formed. Using Internal Liquidity and sub Internal Liquidity

S&P500: Inverse Head and Shoulders set to extend Apr-May rally.The S&P500 is bullish on its 1D technical outlook (RSI = 58.868, MACD = 85.480, ADX = 31.901) as it maintains a steady Channel Up pattern and just formed the first 1H Golden Cross in a month. Technically this is forming the Right Shoulder of an Inverse Head and Shoulders pattern, typically a bullish reversal formation, which not surprisingly was last seen in April when the Channel Up started and was completed with the previous 1H Golden Cross on April 24th. The result was a bullish extension fo rht 1.618 Fibonacci level. We're bullish on this, TP = 6,150.
## If you like our free content follow our profile to get more daily ideas. ##
## Comments and likes are greatly appreciated. ##

S&P500 6300 is the minimum short-term Target right now.The S&P500 index (SPX) is extending Friday's rebound on the 1D MA200 (orange trend-line) following an impressive rally after the April 07 bottom. That is technically the pattern's new Bullish Leg.
This quick consolidation technically resembles all 4 short-term pull-backs (blue circles) that took place since April 2023. The minimum % rise on those before they pulled back to the 1D MA50 (blue trend-line) again was +10%.
As a result, we expect 6300 to be the minimum Target by the end of July, which of course will be an All Time High.
-------------------------------------------------------------------------------
** Please LIKE 👍, FOLLOW ✅, SHARE 🙌 and COMMENT ✍ if you enjoy this idea! Also share your ideas and charts in the comments section below! This is best way to keep it relevant, support us, keep the content here free and allow the idea to reach as many people as possible. **
-------------------------------------------------------------------------------
Disclosure: I am part of Trade Nation's Influencer program and receive a monthly fee for using their TradingView charts in my analysis.
💸💸💸💸💸💸
👇 👇 👇 👇 👇 👇

Nasdaq 100. Mistakes and Daily Orderflow 27.05.25Covered the mistakes that I have made while reading the price. Wanted the shorts although the daily and the 4H suggested bullish price action. The good think was didn't forced. Just left the market after booking partials and breakeven
Post that took one long towards the Volume Imbalance

Weekly Outlook on Nasdaq 100, S&P 500, Dow Jones 30Expecting range bound consolidations on Index triad. High Resistance. Not expecting any further monthly highs. Want Internal Liquidity which means shorts. But the daily and the weekly are opposing each other.

Stock Markets, Gold, Silver: Run With The Bulls!In this Weekly Market Forecast, we will analyze the S&P 500, NASDAQ, DOW JONES, Gold and Silver futures, for the week of May 25 - 31st.
The Stock Markets are bullish, so run with valid buy setups when they form.
Gold and Silver are relatively strong. With tensions in Gaza and Iran, this is expected. Valid buys should be taken.
Crude Oil is a tad bearish due to US inventories, so valid sells are warranted in the short term.
Enjoy!
May profits be upon you.
Leave any questions or comments in the comment section.
I appreciate any feedback from my viewers!
Like and/or subscribe if you want more accurate analysis.
Thank you so much!
Disclaimer:
I do not provide personal investment advice and I am not a qualified licensed investment advisor.
All information found here, including any ideas, opinions, views, predictions, forecasts, commentaries, suggestions, expressed or implied herein, are for informational, entertainment or educational purposes only and should not be construed as personal investment advice. While the information provided is believed to be accurate, it may include errors or inaccuracies.
I will not and cannot be held liable for any actions you take as a result of anything you read here.
Conduct your own due diligence, or consult a licensed financial advisor or broker before making any and all investment decisions. Any investments, trades, speculations, or decisions made on the basis of any information found on this channel, expressed or implied herein, are committed at your own risk, financial or otherwise.

Dollar Bottoming Out Pretty solid bottom for USD. I am assuming more money flowing into USD when a correction is about to happen. We see that this morning when we had that quick drop from 7:00 - 8:00 EST. US10Y rate dropping, USD rising, and equity declining. Back to the old game. So I am suggesting long USD, and short equities, given the recent comeback is way too ridiculous and needs a correction now.

S&P500: First Trade War indicates that ATH comes soon.S&P500 is a very healthy bullish levels on its 1D technical outlook (RSI = 65.213, MACD = 111.000, ADX = 49.249), being considerably over its 1D MA200, with the 1D RSI very close to the overbought zone. This resembles the first Trade War in 2018, when once the 1D MA200 was crossed, it became a Support level and extended the rally to the index Highs and the R1. We remain bullish on SPX with TP = 6,150.
See how our prior idea has worked out:
## If you like our free content follow our profile to get more daily ideas. ##
## Comments and likes are greatly appreciated. ##

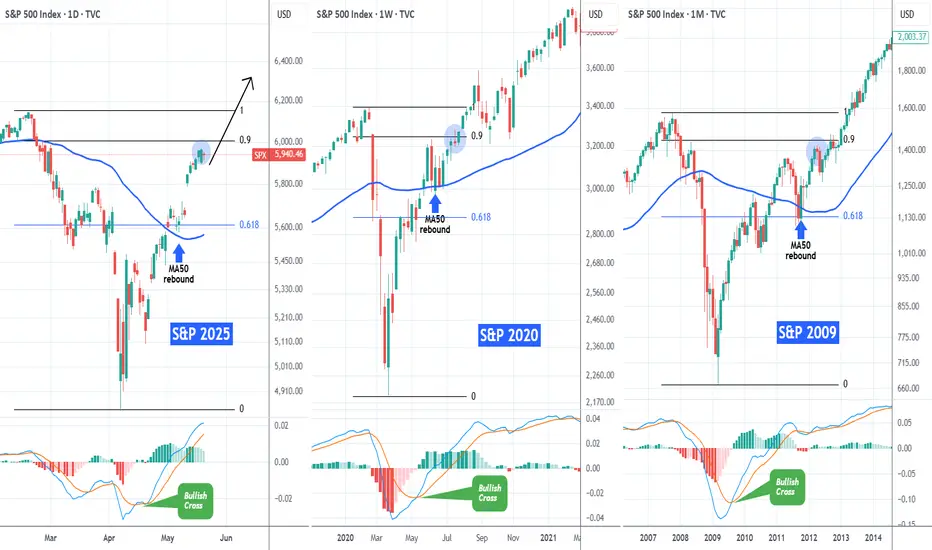
S&P500 Same recovery path with 2020 and 2009The S&P500 index (SPX) has recovered almost 90% of its losses since the February 19 2025 All Time High (ATH) and many have already started calling for a technical correction.
If we compare however this 2025 Tariff fueled correction with the recent most aggressive ones (COVID crash in 2020 and Housing Crisis 2008/2009) we see a different picture.
On their respective 0.9 Fibonacci levels (close to which we are today), both of those market recoveries went straight to new ATHs, without testing their MA50 (blue trend-line) until the next Cycle peak. They had that tested before when the price was trading near (or on)the 0.618 Fib. Notice also how a MACD Bullish on all three charts, confirmed the aggressive recovery pattern straight after the bottom.
Instead of a correction, history shows that we might be looking at new ATH soon.
-------------------------------------------------------------------------------
** Please LIKE 👍, FOLLOW ✅, SHARE 🙌 and COMMENT ✍ if you enjoy this idea! Also share your ideas and charts in the comments section below! This is best way to keep it relevant, support us, keep the content here free and allow the idea to reach as many people as possible. **
-------------------------------------------------------------------------------
💸💸💸💸💸💸
👇 👇 👇 👇 👇 👇
S&P500 Steady Channel Up to 6100The S&P500 index (SPX) has been trading within a Channel Up pattern from the moment (April 22) it broke above the 4H MA50 (blue trend-line). For that 1 month period, it has held the 4H MA50 and that maintains the bullish trend, generating Bullish Legs to High after High.
The last two Bullish Legs have increased by +4.92%, so as long as the 4H MA50 holds, we expect the current Leg to be completed at 6100.
-------------------------------------------------------------------------------
** Please LIKE 👍, FOLLOW ✅, SHARE 🙌 and COMMENT ✍ if you enjoy this idea! Also share your ideas and charts in the comments section below! This is best way to keep it relevant, support us, keep the content here free and allow the idea to reach as many people as possible. **
-------------------------------------------------------------------------------
Disclosure: I am part of Trade Nation's Influencer program and receive a monthly fee for using their TradingView charts in my analysis.
💸💸💸💸💸💸
👇 👇 👇 👇 👇 👇

Buyers Stand By And Be Ready! In this Weekly Market Forecast, we will analyze the S&P 500, NASDAQ, DOW JONES, Gold and Silver futures, for the week of May 18 - 24th.
The Stock Indices remain bullish. So buys are warranted for next week.
Gold and Silver pulled back last week on news of Trump's deals and sanction relief. But Gold is at support now. Watch for bullish setups for buys or a bearish market structure shift before seeking sells.
Crude Oil is near buy side liquidity. Look for short term buys before a longer term, high probability sell setup to form.
Enjoy!
May profits be upon you.
Leave any questions or comments in the comment section.
I appreciate any feedback from my viewers!
Like and/or subscribe if you want more accurate analysis.
Thank you so much!
Disclaimer:
I do not provide personal investment advice and I am not a qualified licensed investment advisor.
All information found here, including any ideas, opinions, views, predictions, forecasts, commentaries, suggestions, expressed or implied herein, are for informational, entertainment or educational purposes only and should not be construed as personal investment advice. While the information provided is believed to be accurate, it may include errors or inaccuracies.
I will not and cannot be held liable for any actions you take as a result of anything you read here.
Conduct your own due diligence, or consult a licensed financial advisor or broker before making any and all investment decisions. Any investments, trades, speculations, or decisions made on the basis of any information found on this channel, expressed or implied herein, are committed at your own risk, financial or otherwise.

E mini Nasdaq 100. Weekly walkthroughWeekly walkthrough on NQ. Huge gap up and continuation weekly profile towards the Major Buyside Internal Liquidity

Time to short MES (S&P500) - CRASH in comingThe assumptions are:
1) The economy is slowing down. Employment data will show it shortly and convincingly. Therefore a summer or fall crash is very likely.
2) The top for S&P 500 is already in. There is always the possibility for a melt up before the crash but I think the melt up has already occured.
3) The next drop will fall below the 2022 low and above or near the covid low.
4) This is obviously not going to be as clean as depicted but the drop is going to be fast and between 40 to 50% from the 2024 top.
5) This is a swing trade over a 6 months to 18 months timeframe.
6) Trump is going to keep messing with the tariffs until the damage to the economy takes a very long time to recover. Markets will discount this at a higher interest rate which will be very harsh for the markets.
I am starting to take positions now and will add if it moves up.

S&P500 Historic reversals like this delivered even +100% gains!The S&P500 (SPX) is making a remarkable bullish reversal and on the monthly (1M) chart is even more evident due to April's candle, which almost closed flat leaving a huge wick under it, a feat we've never seen in recent history.
What we have seen however since the 2008 Housing Crisis, is every time the index hits (or approaches) its 1M MA50 (blue trend-line), it reverses to an incredible rally, technically a new Bull Cycle.
This is what happened in April, the index came a breath away from the 1M MA50 and delivered the strongest monthly bullish reversal of our time. On top of that, it hit and rebounded exactly on the former All Time High Resistance, which held and turned into Support. All such Resistance levels since 2008 have held. Also note that the only time the 1M MA50 really broke (closed the month below it), was during the March 2020 COVID flash-crash, which is a non-technical event/ irregularity and still it rebounded on the 1M MA100 (green trend-line).
The minimum long-term rise that SPX had after such correction was +76.20% and the maximum +104.17%. Assuming the minimum price increase for the current emerging rise, we expect the index to hit 8300 by late 2027.
-------------------------------------------------------------------------------
** Please LIKE 👍, FOLLOW ✅, SHARE 🙌 and COMMENT ✍ if you enjoy this idea! Also share your ideas and charts in the comments section below! This is best way to keep it relevant, support us, keep the content here free and allow the idea to reach as many people as possible. **
-------------------------------------------------------------------------------
💸💸💸💸💸💸
👇 👇 👇 👇 👇 👇
