Yearly Open in Play — Is This the Real Bull or Just a Bounce?CME_MINI:ES1!
Macro Recap
Late Friday, Moody’s lowered the US’s sovereign rating from AAA to Aa1. This reflects a unanimous downgrade of the US, joining S&P and Fitch in stripping the US of its AAA status.
Would this result in a sell-off?
In our analysis, and consensus from the Street, is that it will be contained since the downgrade puts Moody’s in the same camp as S&P and Fitch.
There are talks of renegotiating UK–EU trade deals, which has boosted cable.
On the geopolitical side, not much has changed. Ceasefire talks are ongoing but stuck in neutral. No new catalysts—yet.
The spotlight, however, is firmly on the Fed. Over the weekend, President Trump called on Chair Powell to cut rates “before it’s too late,” echoing a post from April 17th where he labeled Powell’s speech “a complete mess” and added, “Powell’s termination cannot come fast enough.”
With a packed schedule of Fed speakers this week, the real question is whether they’ll double down on the Fed’s independence—or bend toward political gravity, especially with Trump reportedly eyeing the top job.
Economic data is light. That puts full attention on the Fed and headline risk. Traders should stay nimble and alert. Momentum could shift fast.
Markets are now pricing in two cuts of 25 bps each for September and December 2025.
This is very different from market pricing one month ago, when reciprocal tariffs were announced.
Monitoring rate cut expectations is another key theme this week, with multiple Fed speakers scheduled.
ES Futures
ES Futures have been one-time framing up — i.e., creating higher lows — on the weekly timeframe.
ES Futures have also created higher highs.
Key Levels:
• March 2025 High: 6052.50
• 2025 Yearly Open: 6001.25
• Previous Week High: 5977.50
• Previous Week Mid: 5856
Bull Market—or Just a Bear Bounce?
That’s the question traders are asking.
From our perspective, this looks like a recovery from a trade policy shock. The market took the hit, recalibrated, and bounced back.
But let’s not get ahead of ourselves. After a move this strong, some pause is natural. We’re watching for potential consolidation or profit-taking, especially with price action still holding below the yearly open.
Caution is warranted here—momentum’s in play, but the structure hasn’t fully confirmed the shift.
Scenario 1: Another Up Week, Capped by Yearly Open
In this scenario, the rally will be contained as the yearly open remains a strong pivot and resistance zone.
The LIS (Line in the Sand) for short trade opportunities is the yearly open pivot.
Scenario 2: Range-Bound Week
In this scenario, we expect markets to consolidate, remaining above last week’s low and finding support at the prior week’s mid-range.
We will look to initiate longs from the previous week’s mid-range, looking for level-to-level scalping opportunities in a range-bound market.
Es_1!

ES Futures Weekly Trade Plan & Navigating Turbulent Waters CME_MINI:ES1!
Macro Analogy
The current market landscape and macroeconomic environment can be compared to the dynamics of "sticks and carrots." The market is largely headline-driven, responding to the shifting expectations surrounding the Federal Reserve's stance, political events (such as the ongoing influence of the Trump administration), and sidelined investors who are waiting for a clearer signal on where to allocate capital.
Looking at the market action, the low on March 13th, 2025, could mark a point of sector reallocation. Specifically, the Russell 2000 index is currently leading, with the S&P 500 and Nasdaq trailing behind. This suggests a shift in investor sentiment from large-cap stocks to smaller, potentially more dynamic sectors.
In the backdrop, Federal Reserve speakers scheduled throughout the week may help clarify their position on the evolving macroeconomic situation, notably the persistent risk of stagflation. The challenge for central banks is becoming increasingly apparent: balancing rising inflation, increasing unemployment, and slowing growth while striving to meet their dual mandate of price stability and maximum employment. These pressures are intensifying the difficulty of effective policymaking.
If we liken the US administration to a ship navigating through turbulent waters, the Federal Reserve could be seen as a submarine working behind the scenes to stabilize and support the administration. Chair Jerome Powell, at the controls, is leveraging all available tools to ensure financial stability. Meanwhile, at the helm of the ship is the US President, whose decisions and actions impact the broader economic environment, either calming or exacerbating the turbulence. The new adventures of the Gulf of America have entered uncharted territory.
In this context, last week's actions, slowing the pace of Quantitative Tightening (QT)served as the "carrot," aimed at cushioning the economic pain despite worsening economic forecasts. However, the message that FED sounded was that, due to uncertainty, our forecasts are subject to change. Take them with a pinch of salt.
ES Futures Big Picture:
The ES futures market is currently testing key resistance levels, and this zone will serve as a critical inflection point for both bulls and bears. The next steps will likely hinge on the clarity emerging from both macro events and Fed commentary.
Key Levels to Watch:
• Yearly Open 2025: 6001.25
• Key LIS (Last Important Support/Resistance): 5850–5860
• Low Volume Node (LVN): 5770–5760
• Neutral Zone: 5705–5720
• Key Support Mid-Range 2024: 5626.50
• 2024-YTD mCVAL (Market Composite Value): 5505.25
• 2022 CVAH (Composite Value at High): 5341
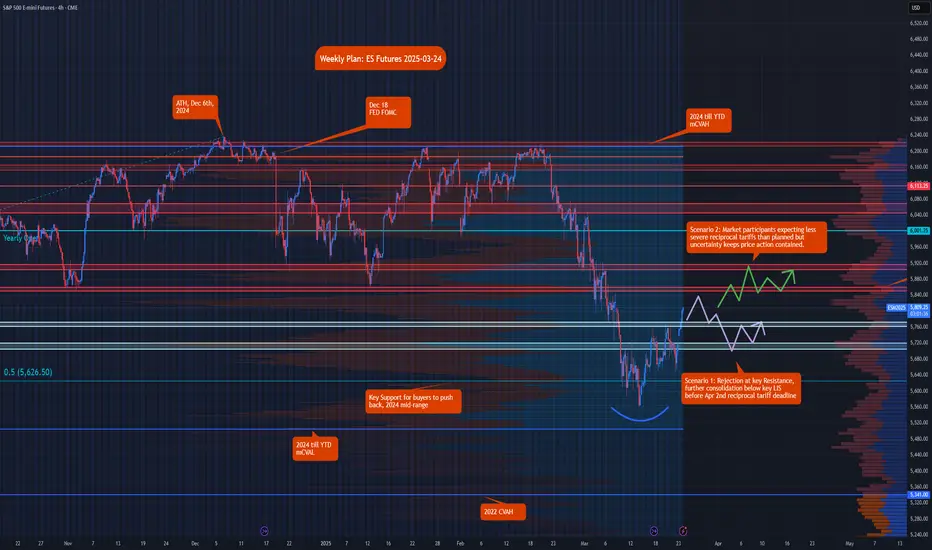
Scenario 1: Rejection at Key Resistance
In this scenario, we expect rejection at the key LIS levels, with further consolidation below the 5850–5860 range before the April 2nd reciprocal tariff deadline. This could lead to a retracement back toward the LVN area (5770–5760) and a potential drop to the neutral zone around 5705–5720.
Scenario 2: Market Participants Expecting Less Severe Tariffs
Should market participants anticipate less severe reciprocal tariffs than initially planned, but remain uncertain about the broader macroeconomic picture, we could see the price push above the key LIS levels. This would likely result in a consolidation phase until more clarity emerges, with the market continuing to trade in a volatile range above key LIS.
Recap ES Futures Weekly PlanCME_MINI:ES1!
In this TradingView blog, we’ll recap the price action and share our insights from the weekly trade plan posted on March 3rd, 2025.
Our Scenario 3 highlighted mounting risks, with weaker economic data reigniting the stagflation theme. While the price action largely aligned with our expectations, it extended further downward than anticipated. Economic data was mixed: PMIs exceeded expectations, while the NFP report came in lower than forecasted. The unemployment rate ticked up to 4.1%, and average hourly earnings data showed mixed results. The Month-over-Month figures were in line with expectations, but Year-over-Year average hourly earnings came in slightly lower at 4% versus the consensus of 4.1%.
In addition, headline news and tariff uncertainties dampened sentiment across the board.
Our approach primarily involves volume profiling and market auction theory to map out price levels and set expectations based on the prevailing market context at the start of each week. However, as fundamentals, macroeconomic factors, geopolitics, and headline news gain increasing significance and impact the market, we draw on our accumulated experience to incorporate these elements into our analysis.
When market regimes shift, technical analysis alone often proves insufficient. A strong understanding of fundamentals, macroeconomic conditions, and geopolitics is crucial to staying aligned with what’s actually happening in the markets, rather than relying on your personal thoughts and assumptions.
Given the myriad factors influencing the economy and markets, traders should recognize that each approach has its merits. We recommend sticking with the strategy that works best for you.

ES Futures & Macro Trends: Key Levels and Market ScenariosCME_MINI:ES1!
Macro and Geopolitics:
There was continued news flow over the weekend after derailed talks between Trump and Zelensky. Europe, UK and Saudi Arabia are still pushing for a Russia-US-Ukraine peace deal that will likely include rare earth minerals.
We also heard Trump commenting on an executive order on digital assets strategic reserves helping reverse losses in CME BTC futures. Investors see this as a positive development prior to the upcoming Crypto Summit in Washington on March 7th.
US March 4th tariff deadlines loom for Canada, Mexico, and China. Trump repeated America's first stance commenting that border security and stopping illegal drug trades should be America’s prime focus.
Economic Calendar:
Looking ahead this week, key economic events include manufacturing PMI data on Monday, employment and services data midweek, and major central bank decisions and labor market reports toward the end of the week. Here’s a breakdown of important releases:
Monday:
Manufacturing PMI data release
Wednesday:
ADP Nonfarm Employment Change
Services PMI
Crude Oil Inventories
Thursday:
European Central Bank (ECB): Interest rate decision & monetary policy statement
U.S. Data:
Weekly Initial Jobless Claims
Continuing Jobless Claims
U.S. Trade Balance
January 2025 Imports & Exports data
Friday:
U.S. Employment Data:
Nonfarm Payrolls (NFP) report
Average Hourly Earnings
Unemployment Rate
Federal Reserve Speakers:
Bowman & Powell scheduled to speak
ES Big Picture:
Despite increased volatility and risks mounting, looking at the daily chart shows that ES futures are still within range and trading above Nov 4th, 2024 and January 13th, 2025 low, however, 2025 mcVAH and R1 confluence has been acting as strong resistance and keeping the markets from reaching new all-time highs.
Despite the risks, our analysis suggests that with the U.S. economy showing resilience, a "buy the dip" approach remains favorable. However, staying selective and strategic with opportunities is key to balancing risk and reward.
Key Levels:
Key levels represent areas of interest and zones of active market participation. The more significant a key level, the closer we monitor it for potential reactions and trade setups in alignment with our trading plan.
2025 VAH: 6,150
2025 VPOC: 6,133.75
LVN: 6,113.25
Neutral Zone: 6,000 - 6,015
2025 VAL: 5,972.50
LIS/Yearly Open: 5,949.50
Neutral Zone: 5,916.50 - 5,927.25
Feb 2025 Low: 5,848
Jan 2025 Low: 5,809
Scenario 1: Range bound week
Market remains volatile, however, within the neutral zone below key LIS/yearly open and neutral zone above Key LIS/yearly open.
Scenario 2: Weak data points slowing economy
Worsening economic data points along with progress in Ukraine- US minerals deal points towards further buying. Weaker data points may provide room for further rate cuts should economic weakening further materialize.
Scenario 3: Mounting risks and weaker economic data
On the contrary, mounting risk and weaker economic data may point towards stagflation as inflation remains sticky while the economy weakens. This provides room for further decline in ES futures.

Is This Sell-Off Another "Buy the Dip" Opportunity?Macro Update
Index futures sold off during overnight trading as market sentiment turned risk-off.
Newswires reported that, after Colombia denied entry to two U.S. deportation aircraft, President Trump announced emergency tariffs of 25% on all Colombian imports, with plans to increase them to 50% next week. Additionally, The Wall Street Journal noted growing support among President Trump's advisors to impose 25% tariffs on Canada and Mexico as early as Saturday to initiate negotiations.
Meanwhile, Chinese startup DeepSeek is challenging U.S. dominance in the AI sector by introducing a low-cost model rivaling OpenAI's o1. This development may intensify geopolitical and economic tensions.
Adding to the unease, Chinese Manufacturing and Non-Manufacturing PMIs missed expectations. Manufacturing PMI came in at 49.1, below the forecast of 50.1. Markets in China and most of Asia will remain closed starting Tuesday for the Lunar New Year holiday, which could lead to lower regional liquidity.
Looking ahead, the week features several high-impact events:
Wednesday, January 29:
Federal Reserve interest rate decision and the first FOMC press conference of 2025.
Bank of Canada interest rate decision.
Thursday, January 30th:
ECB interest rate decision
Preliminary Q4 GDP data (QoQ).
Friday, January 31st:
Core PCE Price Index (Dec).
ES Futures Update
This week is packed with critical data releases, and macroeconomic developments are having a stronger influence on short-term price fluctuations. It’s an important time to step back, zoom out, and identify key levels of interest to engage with the market.
Despite the overnight sell-off and heightened volatility, the auction process remains orderly. Managing risk is paramount, as losses are an inherent part of trading.
Key Observations:
ES futures bounced off the yearly open in overnight trading, marking it as our critical Line in the Sand (LIS).
If prices stay above the LIS, markets are likely to consolidate further this week, with FOMC and other data releases determining the next move.
A break below the yearly open could open the door to short trade opportunities targeting the support zones identified on the chart.
Scenario 1: Wait and See
Allow the market to digest the sell-off. Look for long setups from the LIS. Key events like the FOMC decision will likely influence market direction, but unexpected negative news could overshadow these data releases.
Scenario 2: Sustained Sell-Off
If a catalyst triggers further downside, the market may test support levels near 5,750 and 5,800. Below the LIS, short setups may be viable if supported by news or price action that aligns with a bearish trade thesis.
For traders looking to manage risk more effectively, consider using Micro E-mini S&P 500 contracts , which are 1/10th the size of standard ES contracts.
This week’s data releases, geopolitical developments, and tariff announcements are likely to shape market sentiment. Stay cautious and adapt to new information as it unfolds. Risk management remains the cornerstone of success in volatile markets.
Not confident to incorporate these into your trading plan? Why not incorporate our trade ideas to your trade plan in TradingView and CME’s paper trading competition; “The Leap”.

ES SP500 Weekly Trade IdeaI'm looking to take a long into the PWH once H4 & M15 price action validate this HTF Narrative.

ES SP500 LONGThursdays Daily candle displaced and closed strongly above Wednesdays high and the fractal swing high from last week.
DOL is the PDH.
I want to see H1 bullish arrays respected to then look for M5 bullish displacement entry.
NFP volatility tomorrow will surely impact whether or not this idea works out or not.

ES SP500 ShortMonday's price action saw ES/SP500 trade above Fridays highs, but failed to displace above Friday's high.
My bias is for price to trade to Monday's low.
I am looking for H1/H4 bearish levels to be respected, and will then look for m5/m15 entry once I see premium bearish arrays are being respected.

#ES_F Levels of resistance going into Q2 closeAnother ugly quarter so far with US Equities officially going into a bear market, an abundance of bearish sentiment, and talks of recession.
Price is king and with the nice downward channel it looks like we may get a relief rally this week (possibly into next as well) given :
- Reversion to the mean with price now well beneath the 30 day moving average
- RSI near oversold on the daily
- Bottom MACD curl
- Quarter end window dressing
- Opex behind us
Until the regime changes it's a STFR (short the .. rip) trading plan . I'm trading around a core Bear Risk Reversal position with DEC opex in solid names and some China (mostly green with some slightly underwater after last week). Hedged with JUL QQQ put debit spread in case we open this week with a nasty leg down although R/R favors near term upside IMO.
Resistance levels charted but my eyes will focused on how price reacts at the 3925 zone (obviously assuming we get there) as I will take some long profit and start legging into shorts here.
Stay Liquid Friends
Cheers

$SPY respecting the support line so far!Respecting the downward channel support line so far. Started taking profits on some hedges and adding to longs. Break above 403 and will add more risk long. Sold puts this morning as downside may be capped for now but that doesn't mean we necessarily rip up .
Tough market to trade that's for sure !

ES_F: Daily Range Set - Tune in for This Weeks Levels!Defined range between 4450 - 4537 until proven otherwise. Try to stay away from buying 4480-4484 as that will be tough to find the direction. STAY VIGILANT TAKE PROFITS!

E-mini Defined Range Until Proven OtherwiseAs we spoke about last week, ES_F between 4273 and 4330 is our defined range until it isn't. There will be noise in-between, but until we get a daily close below or above those two areas it should be a very healthy area to long/short and make a lot of money with an elevated VIX.
We think we go revisit last weeks lows early in the week, only to bounce again. Once we breakout of 4330 and hold above on a daily close we should head back to 4700.

$ES Bear Flag or Accumulation - to be continuedInteresting time in the market - people calling a crash, people calling a melt up then crash etc.
Why try and predict ? As a trader your job is to react - level by level , price by price. Let price action determine next outcome.
Nice "Bear Flag" or "Accumulation pattern" ; you can trade the box or wait for a breakout higher / lower .
If you watched today you saw the fighting going on at SPY 430 , that's because these are important levels for the bulls. Similarly saw hard rejection at 441 zone , as these are important levels for the Bears.
React to what the price gives you and trade it. Quit trying to predict the direction solely on what Twitter or someone is saying. Easy way to burn your account.
Level by Level follow price action and react !
Good Luck !

ES: Bearish retest of breakdown then what? Looking for a bearish retest of the breakdown area of 4480, and then see if they chop into another leg up, or right back down on AAPL TSLA MSFT earnings. Take your profits when they are there this week.

Range Bound & Looking for a Local TopES flagging and creating a 30 point range. Take trades when you have them. A break and hold of 4800 should open up 4820 and possible 4840. Below 4770 is 4740 and a daily close under 4770 should get us to go retest that 4712 area which s/r flipped and hasn't been tested. Clean 100 point range to trade in.

$ES_F Squeeze OnBreakout here.. Possible squeeze to 4430 before it gets interesting.
PLAN : Anticipate a move to 4430 then close out longs. Wait for break of 4470 to reenter.
If rejection occurs go short. A direct move down to 4330 , close out longs and go short if this level breaks.

S&P 500 on its way to new ATHFor continued positive momentum, should hold 4208 overnight or at most 4190. Close below 4180 could mean deeper pullback till trend line support. Overhead trend line is possible resistance on its way to 4300 (target/resistance) there.

S&P 500 bulls under pressure Just like Nasdaq, bulls of S&P 500 are also under pressure. It rejected 4185 first and then unable to close above 4169 level. Now must hold 4129 level. Close below 4113 red flag. Trend line last line for bulls to defend. Then upside target still 4221. This week may decide direction for S&P 500. A cautious bullish bias.


Nearterm outlook on $SPX $SPX $ES_FConsidering the Thursday/Friday price action as an impulse wave to the downside


