ES looking for a green close - Main support to hold is 3748ES targets 3818
This is a fifth attempt to post
Main support to hold is 3748
Es_f

#ES Futures Day Trading Overview and Levels to Watch 06.13.22Last night before the Globex open I posted weekly overview with important levels to watch and that most likely we will get more downside being we are under the Supply and buyers in the area where we closed Friday might not be as responsive this time around. 3880-72 was our area to watch to the downside, Globex opened on a gap down and right in that area which gave us a sell to the downside pretty much all night with few pull backs. Looks like so far this morning we found some support at 3811-3804.50 level, our inventory is currently 100% short from Friday close which means there is 60-70% chance we might get some correction to it at the open, how much we will have to see unless we correct before and at the open continue lower, holding that 3811-3804.50 level can give us a test of 3821.25, 3835.50 and possibly 3853.25-3847.25 which will be our Key area to watch if we are to get any more upside from there. On the downside if we fail to get through 3821.25 - 3835.50 or we correct to those levels and come back down to break 3811-3804.05 then we will be looking at lower levels at 3791.50-3776.75 and possibly 3764.75-3758.5 which will be lower Key Support we would need to break to see any continuation lower, if we are going down on big volume and breaking through levels then we can see even lower areas tested, I wanted to see the mid point of the daily range tested this week around 3731-3676.50 but I did not think we might get close to there in Globex so we might get continuation in RTH or we might spend the day cleaning the Globex move and get ready for bigger market moving events this week. If 3764.75-3758.25 breaks we have 3745, 3728 and 3714.75-3709.75 as next Key Support. Careful with longs, we will get pull backs and corrections but we have a lot of people upside down and most likely will see more margin call selling today.

ES short term bearish, SPX closed below 3909 level!ES is bearish below 3855, next maj support is at 3805 and 3780
Monday is the low and turning day, resistance is at 3885 and 4000

#ES Futures 06.09.22 Daily Overview and Levels to WatchYesterday played out pretty much as first expected, was able to actually call the high and the low within a few points as mentioned I thought we might stay in tighter range between 4157 and our 4103-4099.75 level and we did. Today Globex attempted to break out of our Key Resistance at 4143.75-4137.50 and failed which trapped a lot of people, with that fail I will be looking for us to test the opposite side of this range and our Key Support at 4084.50-4077.25 I believe we should have enough supply to take it out but then we have to monitor how much extension we get and if we accept or come back in. On the downside if we get under 4103.25-4099.75 we can see Key Support at 4084.50-4077.25 and lower levels that I would like to see hold are 4061.50-4056.50 and especially 4046-4042.25, ideally if we will have a fail and come back in we will not break both of those but if we do we have next Key Support at 4030.75-4025.25 to keep in mind. On the upside if we again cant take Key Support which is also our T+2 low for the day then we can see rotation back up or what I will be watching for is a flush of that area and see if we can find buyers at lower levels that will bring us back into this range and that would confirm for me that most likely we are out of supply and can see higher levels of 4103.25-4099.75, 4123.75-4119.25 and Key Resistance at 4143.75-4137.50 and if that does happen today or tomorrow then we can see a run from the Key Resistance up to the next one at 4220. Have to manage expectations as we are still in tight range but today we already seen the signs of it breaking.

#ES Futures 06.08.22 Daily Overview with Levels to WatchYday I was short biased and thought we will have enough supply to flush Key Support at 4084.50-4077.25 but I did mention that if we do no break support and reach next level down then we can see a rotation back to 4103.25-4099.75 and 4123.75-4119.25, because of the short bias I did not think we will get back to Key Resistance at 4143.75-4137.50 and extend to next level up but I have been telling myself that we are in this 4170-4070 range since last week and will be that way until we see clear moves out with continuation. So far we are tightening up the range/coiling up looks like for next move out, we are getting lower highs and higher lows with tighter ranges since 27th which tells me we are just spending time cleaning up still and filling orders. Today we have our inventory long above our Key Resistance of 4143.75-4137.50 but also short from yesterdays close. Tricky spot here, we can see another day of tighter range if we do it should be between 4157 area below our 4168-4162.25 level and around our 4103.75-4099.75 area maybe 4090ish. Of course we watch level by level for order flow at those levels to see if we have enough to break and keep going or not so have to keep all possibilities open. On the upside holding above 4143.75-4137.50 can give us 4168-4162.25 that is our T+2 high and if we break it and extend then can see more buy ins and upper levels are 4191-4185.50 and next Key Resistance at 4020-4214.75 but T+2 high is important reference that must break in order to see continuation up. On the downside if we get under 4143.75-4137.50 then we can see 4123.75-4119.25 and 4103.25-4099.75 which is also our T+2 Low area that we will need to see break in order to get a chance at Key Support of 4084.50-4077.25 and lower levels, with T+2 High and T+2 Low being at the very spots we think that we might stall and tighten is another reason I think we might have a smaller range day again and tighten up more. Of any of those references break with volume then its a good sign for continuation because we have a week worth of inventory built up already, but might not happen until Thursday/Friday as we said we don't have any market moving events till then. Days like last few weeks its very important to not over trade and manage expectations in the trade.

#ES Futures 06.07.22 Overview and Levels to WatchYday we tried to extend out of our Key Resistance at 4143.75-4137.50 and as mentioned pre market holding above that level should give us a test of 4168-4162.25 BUT reaching T+2 high at 4179 was the what we were looking at for continuation higher which we failed to do and came back in under our Key Resistance which was the first sign of weakness, we did sell off from Key Resistance but we only had enough supply to reach and break 4123.75-4119.25 level and inability to get to 4103.25-4099.75 told me that we will not test the lows at that time. For Globex I was looking to see if we can down in this area and get under T+2 low at 4096 and we did which tells me we have supply and we are under T+2 low so we can expect some more selling, how much is the question. Today if we get under Key Support at 4084.50-4077.25 then that can give us a test of lower levels, a lot of people will be looking for a big break down from here but I will be cautious because the position is still below us and we are still inside the range from the 27th that is sign of strength to me so I will be monitoring lower levels for response if we do break support and head lower, on the downside we have 4061.50-4056.50 and 4046-4042.25 where I do want to see us hold ideally, if going down big volume then can also reach next Key Support at 4030.75-4025.25. So far market is still in balance in our 4170-4160 range but we should have enough supply built up to flush the Key Support and see how much comes out. On the upside if we do not break Key Support and reach next level down at 4061.50-4056.50 then we can see a rotation back to 4103.25-4099.75 and 4123.75-4119.25 where we should see sell response or if we break support and come back in with volume. As stated in Sunday weekly overview I would like us to flush this 4084.50-4077.25 level and then come back into this range for better confirm, will it all happen today or happen at all we will have to see in RTH. 4143.75-4137.50 has been my Key Resistance and 4084.50-4077.25 Key Support for a week now and it will stay so until we break and reach next Key Levels.

ES 4070 maj supportES 4070is the maj support, loose it and we will slip into the 39xx zone, 4035-40 will be on the way
Need above 4180ES for continuation higher

#ES Futures 06.06.22 Overview and Levels to Watch for the DayFriday we got a close in the middle of our 4143-4077 range, Globex failed to continue lower and break 4103.25-4099.75 level and reach Key Support at 4084.50-4077.25 instead we got a push over our Key Resistance at 4143.75-4137.50. Question today is do we hold above our Key Resistance and get continuation higher or do we come back in? We are currently inside our T+2 Range and inventory is long from Fridays Close, do we see a correction to the inventory or will this move hold and keep going. I am more on the cautious side today but failure to reach lower levels is a sign of strength and if we did clean out all the sellers above then could see a continuation today. On the upside holding above Key Resistance of 4143.75-4137.50 could give us a test of 4168-4162.25 then will be watching if we can reach T+2 high at 4179 if that goes and we get through 4191-4185.50 then we can see our next Key Resistance tested at 4220-4214.75 and maybe levels above but T+2 High area will be the tell if we get there. On the Downside getting back under 4143.75-4137.50 is our first sign of weakness and can give us a test of 4123.75-4119.25, 4103.25-4099.75 and always possible to see a run at T+2 low and key Support area of 4084.50-4077.25. Overall still seeing indecision and market doesn't feel clean for a move out yet but keeping it open and just monitoring for continuation at the levels to see if we accept or not.

#ES Futures Review for the week 06.05.22Last Tuesday I was doing a review and saw that Friday the 27th we broke into a balance where we still had plenty of supply over 4143.75 and our position is below 4084.50 which told me that we will most likely spend some time around here to consolidate before we can confirm direction for the next move, Tuesdays close confirmed that more and I gave myself a range we could possibly stay within which was 4170-4060 so we can clean things up and get ready for the next move, especially with it being the beginning of a new month I was looking for the range to tighten up which we started to do, we made an attempt to get out of 4170 Thursday but that move was sold and we went back towards the smaller position that was between 4100-4077, failure to reach 4077 for now and filling orders below it is a sign of strength for my MGI, it tells me that so far its just inventory moving and not LTF sellers. It takes time after large moves to clean things up, take care of business and confirm next move. We don't really have any market moving events until Thursday/Friday so I will be cautious in the beginning of the week because we are still closing within range and this is where it can tighten more or attempt stop runs before it chooses direction. This week I want to see if we attempt a break down under 4084-77 and come back in without reaching the next Key Support around 4030-25 to trade it from 4084 back up to 4137-43 and possible move higher to 4220-4214+ area or failure to take out 4084-77 and get back over 4143 to make a run at 4220-4214+. This week the only shorting locations I am interested in is if we get back to 4143-37 area without extending from it or if we lose 4046-42 and clear break and continuation on 4030-25.

#ES Futures 06.03.22 Overview and Levels to WatchYday we opened up right under T+2 and got some selling pressure right into the Key Support at 4084.50-4077.25, support held and we saw a rotation back towards the Key Resistance at 4143.75-4137.50 and we were able to break out and hold above it for continuation move to higher levels. In Globex so far we failed at our 4191-4185.50 level and failed to extend and reach the next Key Resistance at 4220-4214.75 and now came back to the previous range resistance and back into T+2 range for today. Question today is do we accept in this range and get another attempt at next Key Resistance or did we sell all the inventory from below in that run up and will come back into previous range to find buyers. On the upside holding above 4143.75-4137.50 is a sign of strength and can give us another test of 4168-4162.25, 4191-4185.50 and next Key Resistance area of 4220-4214.75 and if enough buying comes in the higher levels up to 4234.75-4229.25, 4252.50-4247.50 But have to show signs of strength and get back over T+2 high which is 4165 area. On the downside holding below T+2 high and if we get back under 4143.75-4137.50 then we have some single prints to fill and can test T+2 half back, if enough selling pressure can even bring us down all the way back to Key Support, levels to watch for buyers on the downside are 4123.75-4119.25, 4103.25-4099.75 and Key Support that we had for few days now is 4084.50-4077.25, ideally for us to see a move higher today we dont want it getting under 4123.75-4119.25 but have to give it time and show which way it wants to go.

#ES Futures 6.02.22 Overview Yesterday played out as expected without major changes, we stayed in the 4170-4060 range. We found sellers above our Key Resistance of 4143.75-4137.50 and sold off down to our Key Support of 4084.50-4077.25 where we found buyers. Today looks like we are set to open in yesterdays range and in our T+2 range. Today I am looking to see if we have another inside day unless we break the Key Resistance/Support and show sings of hold and continuation to the next levels, if not then this range could tighten up a bit more until we get next move.

#ES Overview 06.01.22If we look on the daily we are right in the middle between the trapped supply which we started selling out from on the 5th and the Position/trapped shorts below us, today we had an indecision day as we still have plenty of supply above and now buyers below. Im thinking possible inside day tomorrow or for the least inside Friday range, thinking we could hang out between 4170-4060 area for couple days until the next bigger move is ready. Of course have to watch levels and order flow but just thinking what can see, new month is starting as well so might take few days to warm up. I am looking at current Key Resistance 4143.75-4137.50 and Key Support at 4084.50-4077.25, looking to stay between those areas unless we extend and reach break next Key Resistance of 4220-4214.75 or next Key Support at 4030.75-4025.25. Until we can extend to next Key levels I will be reducing my expectations on the moves and waiting for the edges to enter.

#ES Futures 5.31.22 Overview Friday we opened up right in the Key Resistance area of 4084.50-4077.25 and got continuation of short covering through out the day and were able to break into our next range and over next resistance of 4143.75-4137.50, Sunday night Monday morning we count as one Globex session in which we pushed the price higher but were not able to reach next resistance area and last night we started seeing that inventory come out. Question today is how much of Fridays move will we take back and will see continuation higher once we work out the inventory from Globex. Currently we are hanging out below our Key Resistance of 4143.75-4137.50 but not selling off so product is being absorbed, if we cant get back over the resistance then we can see a test of 4110 and if we get enough selling we have our T+2 high and Key Support at 4084.50-4077.25. If we fail to accept in this range and RTH we get back over the Key Resistance then will be looking for another run to test next Resistance at 4220-4214.75.

#ES_Futures 5.26.22 Overview for Globex and RTH Today we broke into 3971-4030 range and came back in, N period bounced right from tomorrows T+2 High area of 3954, will we be able to stay above T+2 until tomorrow and get back over 3971-76 and maybe get more buy ins to take the upper stops and test the top of that range at 4025-4030 which is also a level we came through a few times already that hasnt been tested since last break down on the 18th, or do we accept back in T+2 and test the lower stops? Month end is coming up and 3 day weekend, maybe we can end on a positive note . Will watch what we do in globex tonight but so far we accepted in 3927-3976 range and trapped people short at the lower end of it with that flush after the 2pm minutes release. To the upside Key Resistance is 3976.50-3971.50 if we get through that watch for upper levels to get tested which are 3994.50-3988.75, 4012.50-4008.75 and next Key Resistance at 4030.75-4025.25. On the downside watching T+2 high area at 3957.25-3953.25 if that breaks we have 3944.25-3940.25 and Key Support at 3931.75-3927.25

$SPY respecting the support line so far!Respecting the downward channel support line so far. Started taking profits on some hedges and adding to longs. Break above 403 and will add more risk long. Sold puts this morning as downside may be capped for now but that doesn't mean we necessarily rip up .
Tough market to trade that's for sure !

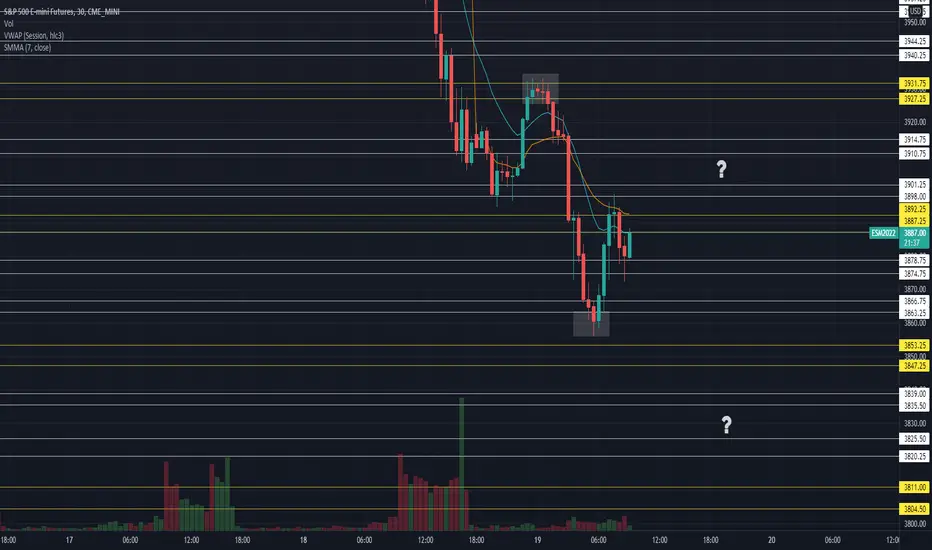
#ES Futures 5.19.22 Overview and Levels to WatchYesterday we had a big sell off, I had it market that we would visit our Key Support at 3976.50-3971.50 and if selling is strong then can see lower levels as well, did not expect to that much but we got what we got. Today we are set to open on a gap down and below T+2 low of Tuesday. Currently inventory is short and we found some buyers before our swing low and Key Support of 3853.25-3847.25, at the open I want to see if we get any correction and maybe try to fill the gap at around 3905 area, if we cant fill the gap and stay above our Key Resistance of 3892.25-3887.25 then on the downside my targets are 3878.75-3874.75, 3866.75-3863.25, Support at 3853.25-3847.25 if that breaks and then we have room to visit lower levels of 3839-3835.50, 3825.50-3820.25 and next support at 3811-3804.50, if the selling is strong as yday I expect us to test the bottom of this daily range we are in since we are currently at half point, those levels would be 3791.50-3787.75, 3780.50-3776.75 and KEY support at 3764.75-3758.25. On the upside holding above Key Support of 3892.25-3887.25 we can see a push to test 3901-3898, 3914.75-3910.75 and next Key Resistance at 3931.75-3927.25. Careful with longs today because we do expect margin call selling, will only be looking for longs if key levels hold and show support, other than that looking to short from Key levels down.
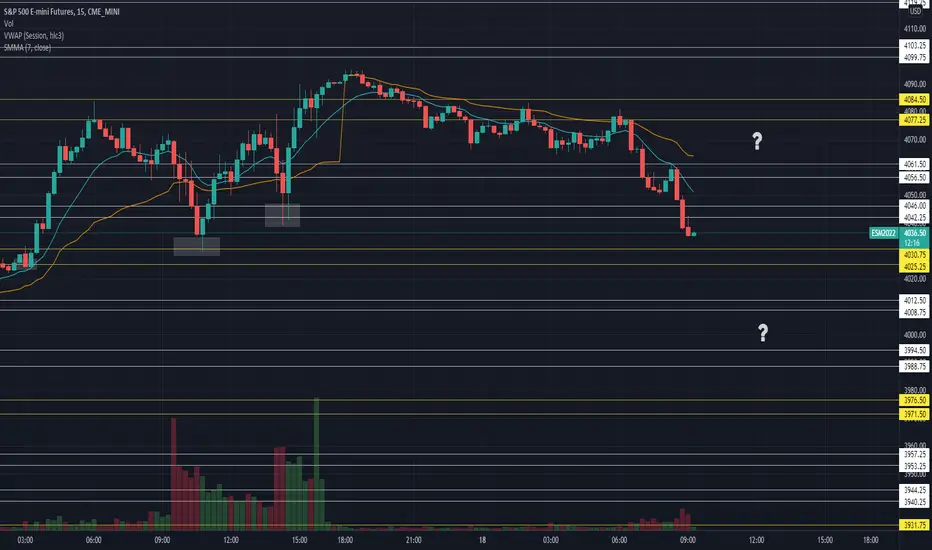
#ES Futures 5.18.22 Overview and Levels to WatchYesterday we found buyers at the levels we expected and were able to close above T+2 for today. Globex session we tried to push to extend into the next range over 4084.50-4077.25 but failed, currently inventory is short and selling off to find buyers. We have broke into and accepted into T+2 so far, if we dont come back out and hold then we can see lower levels get tested down to Half Back, T+2 low and maybe lower depending on sell volume. On the downside we have Key Support at 4030.75-4025.25 if that goes we have 4012.50-4008.75, 3994.50-3988.75 and next Key support at 3976.50-3971.50 if the selling is strong we can expect to look below that, would not buying until I see Key Supports holding. On The upside if we hold our Key Support or look below and fail we have 4046-4042.25, 4061.50-4056.50 Key Resistance at 4084.50-4077.25 which would need to be broken to see anymore upside, considering all the inventory that is now trapped above 4061.50-4056.50 it would take good amount of buying to chew through.
#ES Futures 5.17.22 Overview and Levels to WatchYesterday we had a balance day in our 4030.75-3976.50 range as were thinking it would be, in the Globex session we failed to go lower and did not even touch our 3994.50-3988.75 level which was a sign that we are out of supply. Once we got to our Key Resistance and todays T+2 high (Fridays High) we consolidated a bit and broke out, leaving single prints behind which is a short position/buyers. We reached our next Key Resistance at 4084.50-4077.25 where we found sellers and currently distributing product between that and the lower level of 4061.50-4056.50. Today we have to keep in mind that we have single prints below us where we can expect buyers to be active if we get into that area, seeing how many of them we can fill would be the tell of how much supply we have, being above T+2 with a gap again can force some buy ins today but will it be enough for us to extend higher. On the downside we have 4061.50-4056.50, 4046-4042.25 which is our first single print area where we can see buyers active, ideally if we are going to head higher we will not break both of those levels but if we do we have our gap fill of T+2 high at 4036 and Key support at 4030.75-4025.25. On the upside if we cant fill the singles and that gap to T+2 then we can rotate higher, our Key Resistance for now is 4084.50-4077.25 if that goes our upper levels are 4103.25-4099.75, 4123.75-4119.25 where we should see some sellers on the first test and our next Key Resistance at 4143.75-4137.50 where we should see a good sell response if we get there. I will be looking for long trades from single print areas and lower levels or when we get through the Key Resistance. Powell speaks at 2 so might be an interesting day, patience is KEY.

#ES Futures 5.16.22 OverviewToday we have inventory balancing our out 3971.50-4030.75 Range, we are above T+2 high which is 3961.75 which means we can see buy ins at levels above which is holding us up here and we were not able to extend over 4030.75 so far. Will we make a move out of this range today or will we spend time in this range for now until we are ready for next move? On the upside we have Key Resistance at 4025.25-4030.75 which we would need to break over and hold to see the upper levels of 4046-4042.25, 4061.50-4056.50 and next Key Resistance at 4084.50-4077.25. On the downside failure to get above 4030.75-4025.25 we can see lower levels get tested at 4012.50-4008.75, 3994.50-3988.75 and our Key Support at 3976.50-7371.50, as mentioned we should see buyers at lower levels as we have trapped shorts from T+2(Thursday) but if we do take out Key Support we must take out 3957.25-3953.25 to see any continuation lower, otherwise we will rotate back up. I expect a balanced day unless I see clear signs of us moving out of this balance.

#ES_F 5.13.22 OverviewYesterday we tested midpoint of the current range we are in on the daily, so far was a look below and fail. End of the day rally buyers were able to bring the price towards the T+2 low for today. All the sellers were taken out lower and in Globex be broke into the T+2 range and over out 3931.75-3927.25 Key Resistance, this morning we hit our next Key Resistance level of 3976.50-4971.50 and T+2 half back. So far it was look above and come back in so at the open will be watching for us to test lower levels down to 3957.25-3953.25, and 394.25-3940.25 where we should start seeing buying response, if we break under that we can test our Key support T+2 low area down to 3931.75-3927.25 but ideally we should see buyers step in before that if we will go higher today. If Key support holds and we can see a trip back over 3976.50-3971.50 and test the upper levels of that value zone, which are 3994.50-3988.75, 4012.50-4008.75 where we should see sellers because there is supply above, if we get through that then can test next Key Resistance of 4030.75-4025.25 and also the T+2 high area. Have to be patience we are in a market with supply, have to let things set up and show the way around important levels and not get caught up in the chop.

$SPX500: Top of relief rally?I'm short here, hedging my long book. Got a few long term positions that should do well regardless of whether this is part of a larger relief rally in a bear market, or a new leg up with new highs coming...but also have some growth positions I bot to capture the oversold names turning up that I need to manage risk for. I will be closing the ones that fail, but this signal helps control risk as individual charts pan out. Daily $SPX500 trend expires today, might see some rotation from stocks to bonds, as the quarter ends. Interesting at least, recession risk is substantial and bonds might react as well. Weekly charts for bonds show targets have been hit, so a rebound could occur.
Stay safe out there, I'm short 230% vs my stocks portfolio, since some names I hold have higher beta, and I have some leverage going as well. (long term positions are low beta, but got high beta names long still)
Cheers,
Ivan Labrie.

SPY Levels and Trendlines for tomorro 5/6SPY Levels and Trendlines for tomorro 5/6.
30min Chart. A break and hold of key level opens up the next level of interest.

ES: heading to 3760ES is heading to 3760 where it should form a buyable bottom. Do not miss this low! The low should come next week ideally may 5th.
