ES_F The Dip Before the Rip to 4700Looking for a week to let out some fluff and find new buyers going into the first full week of April before another sell-off down to 4100 possible 4000 before April is over. I do think it seeps into May where we may get another jump up towards the end of April, but we will see where we are at with rate hikes, inflation, etc. For now, I am eyeing 4380 as the weekly low and to buy against going into next week for an eventual move back to 4750. It may take a few days to get the fluff going, but should be a nice short once it hits. High side is 4565, low side 4380.
Es_f

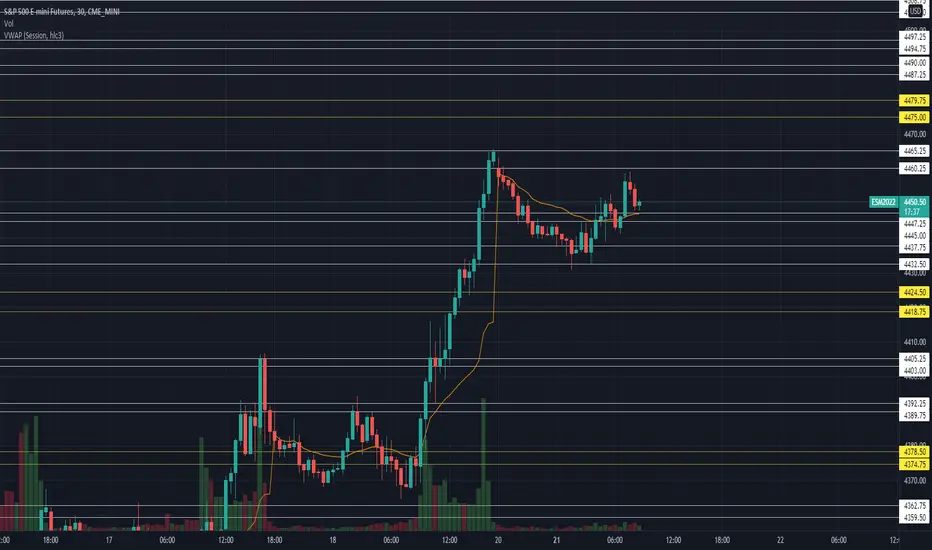
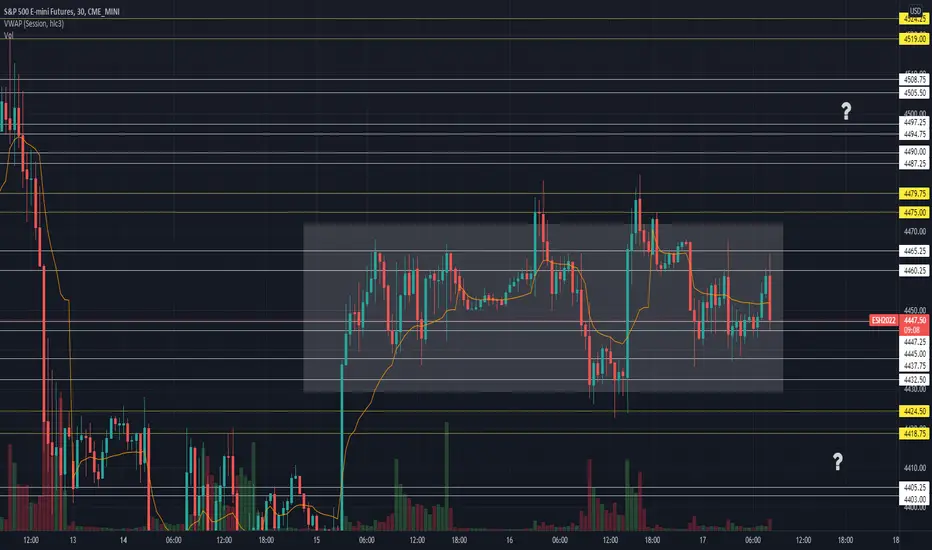
#ES Futures 3.21.22 Thesis with Levels to Watch.Looks like we should open in Friday's value unless we get a move out before the open. Today we have 4437.75-4432.50 as our PM support and holding above is a sign of strength, this should give us a test of 4465.25-4460.25 and next Key Resistance at 4479.75-4475, if we take that out and able to hold above it then our higher levels are 4490-4487.25, 4497.25-4494.75, 4508.75-4505.50 and next Key Resistance at 4524.25-4519. On the downside if we get under 4447.25-4445 that can give us a test of PM support 4437.75-4432.50 and our Key support at 4424.50-4418.75 which if gets taken out we can see more downside to 4405.25-4403, 4392.25-4389.75 and next Key support at 4478.50-4374.75.
ES: The Ripper Continues?Watch 4454 moving forward as we may chop at this level before a retest of 4350. They may want to push ahead to 4580, fail, and then go test 4350, area. Look for 4454 to hold moving forward for a test of 4580, and then possible drop. Want to see how tonights Europe session goes with peace/no peace talks.

$SPY $ES_F $SPX Analysis, Key Levels and targets… $ES_F $SPY $SPX Analysis, Key Levels and targets…
So as of right now ES is NOT holding above the mid-length EMA…
In my personal opinion, I think we have a lot lower to go.
(A LOT)
I bought SPY 17 June 442 puts on Friday…
Looking for a good down move to maybe sell some puts against it… but I’m looking to hold for a bit…
I can easily see 400 by then and my target is definitely lower.
Please do your due diligence here… I am definitely aggressively bearish at this point….
I had a few really great call plays last week, but I’m really focusing on the down moves in the next few months.
I was playing the “denial” rallies…
I’ll try to repost soon on SPY when I see how this opens and where I might sell puts…
I might not sell them until we get a decent drop though…
GL and let me know what you think… and also I'm super sorry that I'm behind on responding to messages... just got back from spring break!!!
---------
I am not your financial advisor. Watch my setups first before you jump in… My trade set ups work very well and they are for my personal reference and if you decide to trade them you do so at your own risk. I will gladly answer questions to the best of my knowledge but ultimately the risk is on you. I will update targets as needed.
GL and happy trading.
IF you need anything analyzed Technically just comment with the Ticker and I’ll do it as soon as possible…

#ES_F 2.10.22 Overview and Levels to watchMarket is waiting to make a move, could we see it today after the morning releases? We have been knocking on key resistance area since yesterday, the questions is will we break through and keep going or run out of buyers and go back down. Today we have 4570-4562.50 as our PM Support being under there would give us first sign of weakness and below we have 4551.25-4548.75 as minor support and 4536.75-4532.50 as our KEY Intraday Support which needs to be broken to see more downside levels which are 4524.25-4519, 4508.75-4505.50 and if going down on big volume can see 4497.25-4487.25, 4479.75-4475, 4465.25-4460.25. On the upside we have 4589.50-4584.75 as our PM Resistance that we need to break and hold over to see upside to 4603.25-4598.75 and our KEY Intraday Resistance at 4623.25-4614.50 that if broken can give us 4636.50-4632.25, 4650.50-4646.25 and 4675.25-4666.25 which is our next big area of resistance. Lets see if we make our move today or keep snoozing.

ES: The Ripper Continues?Watch 4454 moving forward as we may chop at this level before a retest of 4350. They may want to push ahead to 4580, fail, and then go test 4350, area. Look for 4454 to hold moving forward for a test of 4580, and then possible drop. Want to see how tonight's Europe session goes with peace/no peace talks.

#ES Futures 3.14.22 Overview and Levels to Watch Globex inventory built up between our 4220-4214.75 and 4234.75-4229.25 levels and when we failed to extend and hold this morning we started selling out. We are under our Key level and question today is will we see more downside or will we get back over and test our upper levels. On the downside holding below our Key Level 4220-4214.75 is a sign of weakness and leaves the door open for a test of 4191-4185.50, 4168.4162.25 and next Key Support at 4143.75-4137.50 if that gets taken out look for 4123.75-4119.25, 4103.25-4099.75 and next Key Support at 4084.50-4077.25. On the upside if we get back over 4220-4214.75 we can see a test of PM resistance at 4234.75-4229.25 if we can take that out then we should see 4252.50-4247.50 and next Key Resistance at 4272-4265.50. We do have a lot of inventory over 4220 so it should be a challenge to get back over there unless we run out of supply.

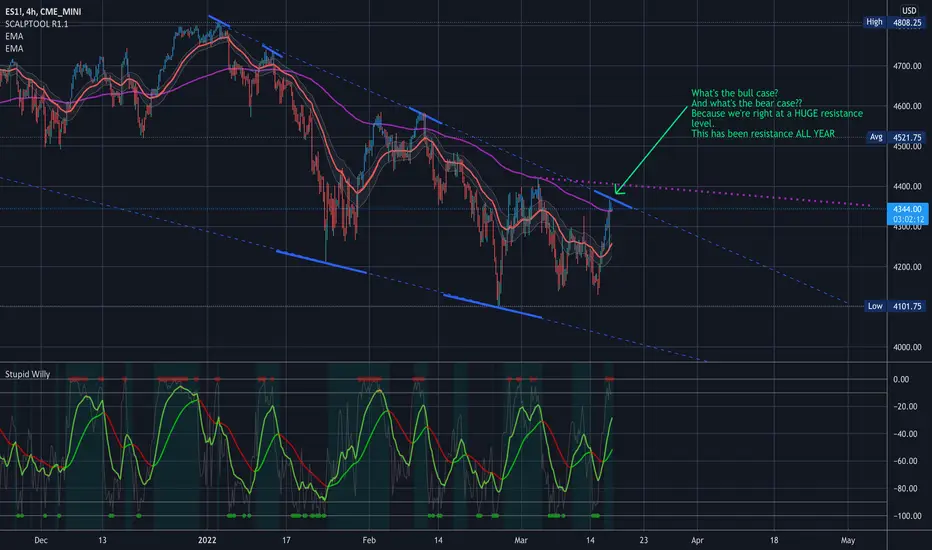
$SPY and $ES_F I try my best to stay away from "call-out" type posts because that's not really what I'm about. That being said, I'm doing one today in conjunction with an educational post because they fit together pretty well.
Note: on the main chart I'm submitting with this, the topmost moving average (where price is resting as I write this) is the 200HMA using daily candles. The bottommost moving average is the 200HMA using monthly candles.
SHORT VERSION
The short version is that I'm looking for a short entry on CME_MINI:ES1! and/or AMEX:SPY .
THE LONG VERSION
In roughly the past 10 years, ES futures and SPY have fallen below the 200HMA on the weekly candle a handful of times. My data plan on TradingView I guess doesn't give me far enough data to show it, but on my other charting platform you can see that as far back as 2011 almost every single time ES has fallen below the 200HMA on the weekly it has been caught by the 200HMA on the monthly. 100% of the time that price has fallen below the 200HMA on the weekly it has resulted in a sustained period of volatility.
Currently, ES has not breached this sufficiently but it looks to be close. What I'm looking for as confirmation before entering is:
the weekly candle for the week of 1/23/2022 opens below the 200HMA on the weekly candle
daily volume on ES has not fallen below 1.2mn (click the related idea for my overview of using volume to help time when the bottom may be in)
If this criteria is met, I'm going short on ES selling short contracts but also buying puts on SPY as well. While you don't want to buy calls as a way to "buy the dip" due to the impact of elevated TVC:VIX after a sell-off, you may want to buy puts if you are expecting a sell-off due to the impact that an exploding VIX will have on your options premiums.
To be clear, I am not calling for some catastrophic market crash. I'm calling for a technical correction to a regularly established baseline that's all.
PT 1 for me would be 4100. PT 2 for me would be 3400. For context 1 contract for CME_MINI:MES1! (the little brother to ES) nets you $5 per point. If I were to enter at 4400 then by PT 1 (if I'm right), that results in $1500/contract excluding fees.
CLARIFYING STATEMENTS
This is a play I'm entering with or without posting this. If you decide to follow along, you're making a conscious decision of your own. If you decide to enter and this fails, you will get no sympathy from me, I will award you no points, and my God have mercy on your soul.

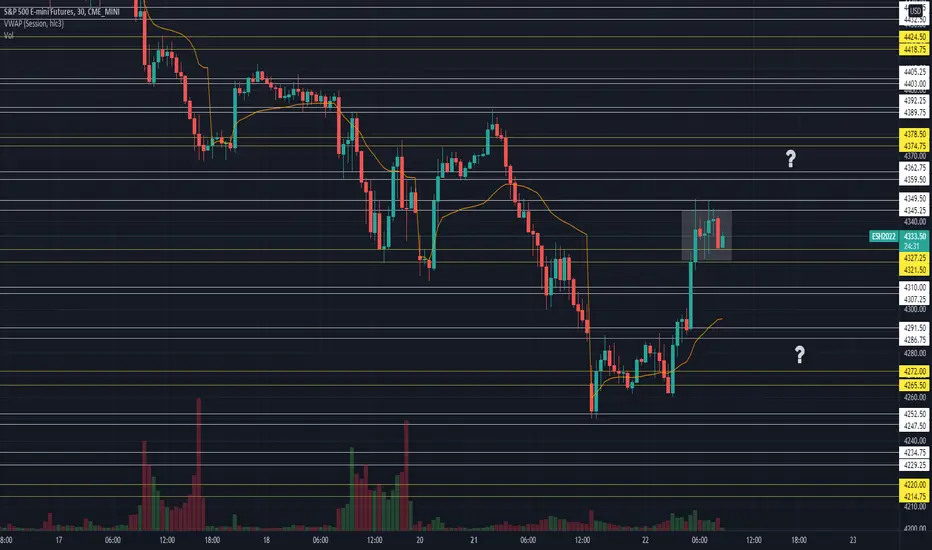
#ES Futures 2.28.22 Overview and Levels to Watch Globex opened on gap down and below our Key Level of 4327.25-4321.50 which tells us all the buying Friday was just shorts getting bought it. Will we fill the gap today and keep going or will we keep going down? Failure to touch 4349.50-4345.25 this morning once we broke Key Resistance is a sign of weakness, on the downside if we do not get over 4327.25-4321.50 and 4349.50-4345.25 then that leaves door open for test of 4310-4307.25, 4291.50-4285.75, 4272-4265.50 which is our next Key Support and Globex low at 4252.50-4247.50 if that gets broken then we have more downside to 4234.75-4229.25 and 4220-4214.75. On the upside if we get over and hold 4327.25-4321.50 and can take out 4349.50-4345.25 then we can see 4362.75-4359.50 and Key Resistance at 4378.50-4374.75 which needs to be taken out for continuation higher, if that happens then our levels are 4392.25-4389.75, 4405.25-4403 and 4424.50-4418.75.


ES_F THE RIPPPEEERRRRRLooking for emini futures to continue the upswing towards 4700-4800 as we get an early week pullback. The only thing that can stop this is a Nuke being dropped. There will be volatility, and there will be red days in there, but overall market will get to 4500, chop chop chop, then finally get the fed to increase bps and we rocket off that.

#ES Futures 2.25.22 Overview and Levels to Watch for the DayGlobex session last night we put together a position under 4272 and currently running the stops to sell it, will we continue higher after or come back down? Today we have on the downside 4291.50-4286.75 as our recent support, breaking that would be the first sign of weakness, under we have our Key Support at 4272-4265.50, if we break that then that leaves the door open for our lower levels at 4252.50-4247.50, 4234.75-4229.25 and our next Key Support at 4220-4214.75. On the upside, continuing to hold above 4291.50-4286.75 is signal of strength, if we manage to break 4310-4307.25 that leaves us with Key Resistance of 4327.25-4321.50 and a level we need to break for continuation into next Value would be that and 4349.50-4345.25. Its Friday the day to protect gains and trade safe!

#ES Futures 2.24.22 Overview and Levels to Watch Lots of news and lots of selling in Globex, hoping everything ends without many losses. Where we at on ES today? Currently the inventory is under our 4143.75-4137.50 Key Level, will we get back over and go higher today to fill order on the way up or will the sell off continue? On the upside we need to get over the Key Resistance at 4143.75-4137.50 and hold in order to test 4168-4162.25, 4191-4185.50 and next Key Resistance at 4220-4214.75. On the downside holding under the key level and under 4123.75-4119.25 leaves us open for tests of 4103.25-4099.75 and next Key Support at 4084.50-4077.25, if that breaks we have 4061.50-4056.50, 4046-4042.25 and 4030.75-4025.25 as next Key Support. Careful trading today because order flow will be volatile with sell orders hitting hard and bounces sharp, could be very difficult to trade and levels can be stretched, better to wait for good locations to enter and mostly observe.

#ES Futures 2.23.22 Overview and Levels to Watch Globex session was quite tonight, we are right at a Key Level and waiting for our direction. Lets take a look at our options today. On the Upside we have 4349.50-4345.25 as our PM Resistance, if we break and hold over it then that leaves the door open for tests of 4362.75-4359.50 and our Key Resistance for the day at 4378.50-4374.75 where we should have sellers active, we would need to break that and 4392.25-4389.75 to see it extend into next Value area. On the downside, if we don't get over PM Resistance then we can see a test of 4327.25-4321.50 and our PM Support at 4310-4307.25, if that goes then we have 4291.50-4286.75 and 4272-4265.50 as our next Key Level, if that breaks and we get under 4252.50-4247.50 then our lower levels where we can see response are 4234.75-4229.25 and next Key Area at 4220-4214.75.
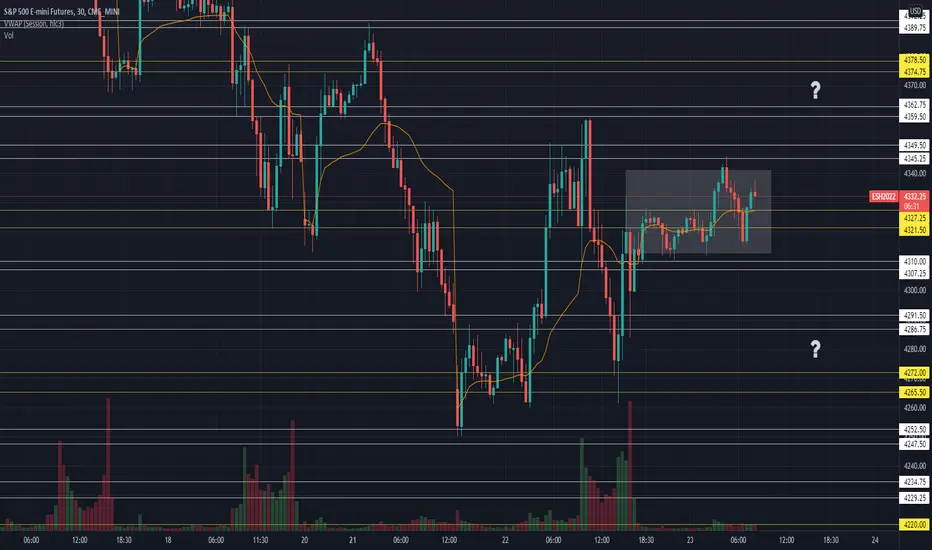
#ES Futures Overview and Levels to WatchWe had some selling in our Sunday/Monday Holiday session which got us down to one of our Key Levels at 4272-4265.50. We looked below, came back in and were able to rally back up and get over upper Key Level at 4327.25-4321.50. So what can we see today? Last night Globex was a double distribution, on the downside we have 4327.25-4321.50 as our current PM support, getting below that will be our first sign of weakness and opens the door for 4310-4307.25, 4291.50-4286.75, Key Support at 4272-4265.50 and our Globex Low at 4252.50-4247.50 which if gets taken out can see more downside. The upside scenario, holding above our Key Support levels, leaves the doors open for a test of PM resistance at 4349.50-4345.25, 4362.75-4359.50 and T+2 Low which is right at our next Key Resistance at 4378.50-4374.75, Key resistance and 4392.25-4389.75 needs to be broken for any more upside. Lets see what this week will bring.

#ES_F 2.18 Overview and Levels to WatchYesterday our downside scenario played out perfectly, what can we expect today? In the Globex session inventory got too short and we got a nice squeeze up to our 4405 level but could not break and and reach our Key level at 4424.50-4418.75 and that was our sign of weakness and that we have more inventory above us. This morning we finally broke PM support and got under our Key Support at 4378.50-4374.75. On the downside if we stay below our Key Support then that leaves us open for a test of 4362.75-4359.50, 4349.50-4345.25 and next Key Support at 4327.25-4321.50, If that gets taken out and we take out 4310-4307.25 we can see more downside to 4291.50-4286.75 and 4272-4265. To get upside we need to get back over 4378.50-4374.75 and then we can test higher levels of 4392.25-4389.75, 4405.25-4403 and 4424.50-4418.75 but right now we have inventory above and more likely be looking for the downside scenario to play out again. Trade safe!

#ES Futures Thesis Trade RewievOne example of how my thesis played out today. In the morning I posted for the downside scenario for today we had - all this inventory between 4440-4480 that if gets no upside then we can see it start selling out and level we are watching are 4445-4437.75 as our PM Support and 4424.50-4418.75 as our Key Intraday Support, breaking PM support is first sign of weakness and getting under the Key support leaves the doors open for 4405.25-4403, 4392.25-4389.75 and 4378.50-4374.75 as our next level where we should see good support unless we break that and 4362.75-4345.25 level then we can see more downside. Trade entry was when we failed to get back in previous value with a stop right above and take profits at each level lower until we found buyers at our next big support.

#ES_F 2.17.22 Overview and Levels to watchWe spent two days in this value area with two failed break outs and one failed breakdown. We are bound to make a move out so lets see where can we head if we do. Today we have 4465.25-4460.25 as PM Resistance and 4479.75-4475 as our Key Intraday Resistance that we need to see break and hold to get upside into 4490-4487.25, 4497.25-4494.75, 4508.75-4505.50 and 4524.25-4519 as our next big area of resistance. On the downside we do have all this inventory between 4440-4480 that if gets no upside then we can see it start selling out and level we are watching are 4445-4437.75 as our PM Support and 4424.50-4418.75 as our Key Intraday Support, breaking PM support is first sign of weakness and getting under the Key support leaves the doors open for 4405.25-4403, 4392.25-4389.75 and 4378.50-4374.75 as our next level where we should see good support unless we break that and 4362.75-4345.25 level then we can see more downside into 4349.50-4345.25 and our bigger support and gap fill at 4327.25-4321.50 area.
#ES_F 2.16.22 Overview and Levels to watchDid we even move since Yesterday morning?? Market is awaiting direction, we have Retail Sales 8:30am and FOMC Minutes at 2PM. So far Globex failed at our 4479.75-4475 level and we came back in yesterdays range and we wait and see where will it take us. Failing to extend is our first sign of weakness today, on the upside we have 4479.75-4475 as our Key Intraday Resistance, we need to get through that and hold in order to see range extension to 4490-4487.25, 4497.25-4494.75, 4508.75-4505.50 and our next bigger area of resistance at 4524.25-4519. On the downside if we fail to extend higher, then we have 4447.25-4445 as our PM support, if we get under that leaves door open for 4437.75-4432.50 and our Key Intraday Support at 4424.50-4418.75. If our Key support gets taken out we can see a nice move down to 4405-25-4403, 4392.25-4389.75 and 4378.50-4374.75 which is our next bigger area of support but if going down on big volume can get taken out and if we do our levels lower are 4362.75-4359.50, 4349.50-4345.25 and 4327.25-4321.50. Lets see what they have in store for us today and where will the market head.

#ES_F 2.15.22 Overview and Levels to watchIn Globex we had a break out from Mondays Value and we are currently in our T+2 Range which is Friday. Today during RTH we will want to monitor and see if we will get a continuation and test the high of settlement, fail and come back in or if we found our next temporary balance that we need to fill in before next move. Globex is in double distribution and here are the levels I will be watching today. On the Upside we have 4465.25-4460.25 as our PM resistance and 4479.75-4475 as our KEY Intraday Resistance, if broken and we can build value over we can see 4490-4487.25, 4497.25-4494.75, 4508.75-4505.50 and bigger area of resistance and Friday High at 4524.25-4519. On the downside we have 4437.75-4432.50 as our upper distribution support and our Key Intraday Support at 4424.50-4418.75. Holding under the distribution support will be our first sign of weakness and if we break and hold under the Key Support then we can see a test of 4405.25-4403, 4392.25-4389.75 and bigger area of support at 4378.50-4374.75. Another option I will be looking at is after this big move in globex we need to digest and can stay between 4424-4480 before it makes next move.

#ES_F 2.11.22 Overview and Levels to watchYesterday we got another rejection from our Key area and with no further upside inventory sold off. Today we have Globex inventory short and set to open under T+2. We have 4497.25-4494.75 as our PM Resistance and 4479.75-4475 as our PM Support. On the downside holding below PM Support leaves the doors open for moves lower to 4465.25-4460.25, 4447.25-4445, We have single prints to fill around the 4437.75-4432.50 level and our bigger area of support at 4424.50-4418.75 and of course if we have a lot of inventory can see even lower. On the upside if we get over and build over PM Resistance we can then test the upper levels of 4508.75-4505.50, 4524.25-4519 and 4536.75-4532.50 as our upper key levels. It might take some time to clean things up after yesterday but lets see what they have for us.
