April 15th Trade Journal & Stock Market AnalysisEOD accountability report: +940
Sleep: 8 hour, Overall health: Good
**Daily Trade Recap based on VX Algo System **
9:30 AM Market Structure flipped bullish on VX Algo X3! - easy money
10:10 AM VXAlgo ES X1 Sell Signal - easy money
1:02 PM Market Structure flipped bearish on VX Algo X3! - easy money
1:40 PM VXAlgo ES X1 Buy signal (triple signal) -a bit tuff but still work out
3:30 PM VXAlgo ES X1 Sell Signal (double signal) - a bit tuff but still work out
**Wed plan: ** Watch for 48M support or 195M support to tag around 5200-5300s.
Es_f

April 14th Trade Journal & Market AnalysisApril 14th Trade Journal & Market Analysis
EOD accountability report: +565
Sleep: 6 hour, Overall health: recovering, cant seem to get over 6 hour sleep.
**Daily Trade Recap based on VX Algo System **
9:30 AM VXAlgo ES X1 Sell Signal (triple sell signal)
9:41 AM Market Structure flipped bearish on VX Algo X3
11:02 AM Market Structure flipped bullish on VX Algo X3!
12:20 PM VXAlgo ES X1 Buy signal (Triple buy signal)
2:11 PM Market Structure flipped bullish on VX Algo X3!
3:20 PM VXAlgo ES X1 Sell Signal (triple sell again)
Today traded inside the zone, tested the 10min MA from the other day, held very well and bounced strong.
Bot alerts were on fire today.
Tuesday plan: Look for a backtest to support again on 48 min and push up to the MOB.

April 11th Trade Journal & Market AnalysisApril 11th Trade Journal & Market Analysis
EOD accountability report: +1566.50
Sleep: 6 hour, Overall health: going thru Flu symptoms
**Daily Trade Recap based on VX Algo System **
12:08 PM Market Structure flipped bullish on VX Algo X3!
1:00 PM VXAlgo ES X1 Sell Signal (2x Signal)
Today was a very choppy for the early part of the day, tested pre market lows and almost broke it because of consumer sentiment.
We eventually bounce and started moving upward toward the 5 min and 10 min resistance , and eventually broke out with the market structure flipping bullish at 12:08, we went back for a 1 min MOB backtest and pushed up further.
Monday plan; look for back to support as noted on the video

April 10th Trade Journal & Market AnalysisEOD accountability report: +$3087.50
Sleep: 6 hour, Overall health: going thru Flu symptoms
**Daily Trade Recap based on VX Algo System **
10:27 AM VXAlgo ES X1 Buy signal (double buy signal)
12:30 PM VXAlgo NQ X1 Buy Signal (triple buy signal)
1:45 PM VXAlgo NQ X3 Buy Signal (triple buy signal) + market structure = A+ set up
Took some time off the last few days from trading futures to
re-organize the options account and long term port, got back into trading futures today.

Paradigm Shift or Panic Selling? ES Futures Weekly PlanCME_MINI:ES1!
Macro Update:
The escalation of reciprocal tariffs and China's countermeasures have sent shockwaves through markets, with widespread selloffs across asset classes, including gold. Fund managers and investors were forced to liquidate positions to cover margin calls. The likelihood of a global recession has surged, with Goldman Sachs raising the probability of a US recession to 45% from 35%. Meanwhile, JPMorgan increased its global and US recession odds to 60%, up from 40%, due to intensifying tariff tensions.
The March 2025 Federal Reserve’s SEP projections suggest slowing growth amid rising inflation concerns, pointing in the right direction. Is this a paradigm shift, or was it already set in motion earlier in the decade? Or is this simply panic selling, with the expectation that US administration policy will soon stabilize markets?
If it is a paradigm shift—as seems more likely based on recent developments—the current environment could prove historic, aligning with Ray Dalio's concepts on the changing world order, debt crises, and how nations go bankrupt.
Investor Confidence: ES futures are currently down over 20%, entering bear market territory for the first time since the 2020 pandemic crash. The big question now is whether we’ll see a relief rally or continued sell-offs with occasional pullbacks, or if markets are establishing a new value range based on auction market principles.
• 2024 YTD mCVAL: 5379.75
• 2022 CVAH: 5376
• March 2025 Low: 5533.75
• August 5th, 2024 Low: 5306.75
• Neutral LVN: 5191.50 - 5156.25
• April 4th, 2025 Low: 5074
• 2024 Yearly Low: 5016.25
• CVPOC 2022: 4610.50
Scenario 1: Further Downside The key downside level for ES Futures is 4610.50, where the most volume has been transacted since 2022. Currently, ES Futures are trading above this level. If the market establishes a value range between 4900 and 4500, further selling with brief pullbacks and consolidation above the 2022 CVPOC seems likely.
Scenario 2: Relief Rally For a rally to take hold, ES Futures faces key resistance levels: the 2024 Low at 5016.25 and the pWeek Low at 5074. If markets sustainably stay above these levels, we could see a rally toward the 2022 CVAH at 5376. However, the sustainability of such a rally remains in question given the mountain of uncertainties ahead.
It is important to note that uncertainty tends to create highly volatile market regimes. Traders should adjust the expected daily range accordingly. A good indicator to measure this is “Daily Average True Range”, many traders also rely on close-to-close standard deviation bands to gauge range on a given trading day. As such, we could see moves of 3% or more in either direction on any day.

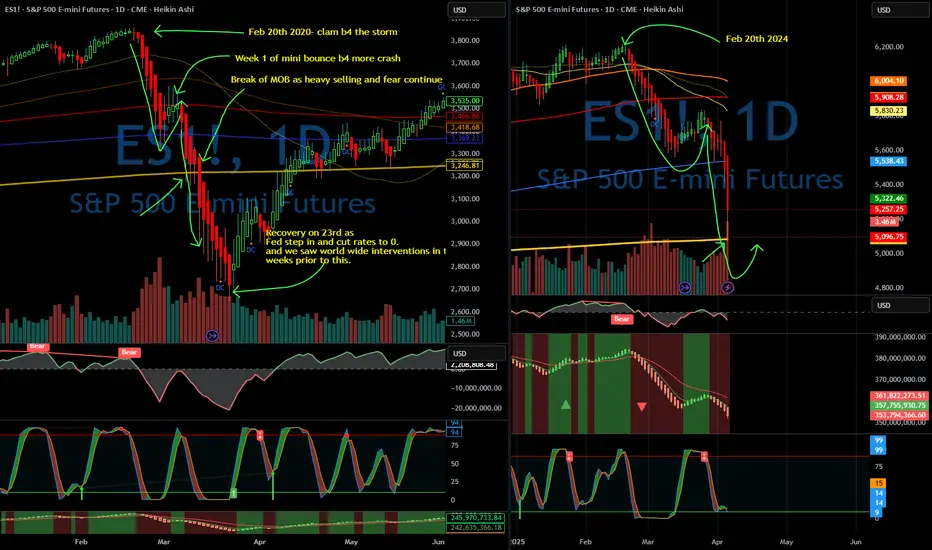
Are We Witnessing a Black Swan Event?I’ve spent most of the day digging through charts and studying past crashes — because what we’re living through right now might be a once-in-a-decade opportunity.
This current market crash feels eerily close to a black swan event.
No one really expected Trump to push tariffs this far, and the consequences are already rippling through global markets. If this escalates into true economic isolation, the effects could be both tremendous and long-lasting.
That said, there’s another possibility:
This might just be a blip in history — a bold negotiating tactic that works out, shocks the system temporarily, and fades away.
There’s even speculation this could mirror the 1989 crash, with some analysts warning of a potential 20% drop by Monday.
If that happens, I’d rather not be frozen by fear. I want to act with intention. I want my plan in place and my orders ready.
Before I share stock ideas I believe can outperform in the long run…
Let’s first walk through what I believe might be playing out — at least for now. (Keep in mind, these theses can change fast.)
Before the crash, it looked like a replay of 2022:
Markets were clearly overvalued and due for a correction — back then, it was driven by regional bank failures, and the Fed quickly stepped in to stabilize things.
But now, selling pressure is accelerating.
This looks less like 2022 and more like 2020 — where markets broke down in response to a larger, fast-moving, global crisis.
Even though we’re seeing similarities, things can shift very quickly.
We still haven’t seen key reversal signs — like a Doji candle — and more importantly, there’s been no intervention yet from the government or global forces.
Until that happens, panic may continue to snowball.
And as we know from history, panic doesn’t operate on logic.
Source:
📚 2020 Stock Market Crash en.wikipedia.org
April 3rd Daily Trade Recap EOD accountability report: +$161.25
Sleep: 6 hour, Overall health: not good at all.
**Daily Trade Recap based on VX Algo System **
9:42 AM Market Structure flipped bullish on VX Algo X3!
10:30 AM Market Structure flipped bearish on VX Algo X3!
11:11 AM VXAlgo ES 10M Buy signal (double signal)
12:04 pm Market Structure flipped bullish on VX Algo X3!
1:31pm Market Structure flipped bearish on VX Algo X3!
1:40 PMVXAlgo NQ 10M Buy Signal double signal
Another wild day, market went extremely bearish and has been rejecting the 5 min resistance and playing out as expected.

Daily Trade Recap based on VX Algo System EOD accountability report: +$2,337.50
Sleep: 5 hour, Overall health: not gud
**
Daily Trade Recap based on VX Algo System **
9:36 AM VXAlgo NQ 48M Buy Signal,
9:44 AM Market Structure flipped bullish on VX Algo X3!
11:13 AM VXAlgo ES 10M Sell Signal (lost $525 on this play)
1:21 PM VXAlgo ES 10M Sell Signal
2:05 PM VXAlgo NQ 48M Sell Signal
2:40 PM VXAlgo ES 10M Buy signal (triple signal)
Overall a pretty wild day, I'm extremely glad that we have a system that works and reads the MM very well.
The only thing we need to do is be extremely disciplined and pull the trigger without hesitation.

Daily Trade Recap based on VX Algo SystemEOD accountability report: +$446.25
Sleep: 10 hour, Overall health: Meh
**Daily Trade Recap based on VX Algo System **
9:30 AMVXAlgo ES 10M Sell Signal
2:57 PM VXAlgo NQ 10M Buy Signal

Liberation, Altercation or Doom? ES Futures weekly planCME_MINI:ES1!
Quick Update
The upcoming week is poised to be critical for financial markets as President Donald Trump's so-called "Liberation Day" on April 2 approaches. On this date, the administration plans to implement new tariffs aimed at reducing the U.S. trade deficit by imposing reciprocal duties on imports from various countries.
As April 2 looms, the full impact of these tariffs remains uncertain, leaving markets and investors in a state of heightened anticipation.
We may get clarity on the tariff situation on April 2, 2025.
Universal tariff announcement of categories of imports may clarify US administration’s maximum tariff escalation approach.
A phased out and unclear tariff approach may keep markets in limbo.
Economic Calendar
Keep an eye on the data docket, NFP and other key releases are due this week.
Tuesday, Apri 1, 2025 : ISM Manufacturing PMI, JOLTS Job Openings
Wednesday April 2, 2025 : ADP Employment Change, Factory Orders MoM
Thursday April 3, 2025 : Balance of Trade, Imports, Exports, ISM Services PMI, Initial Jobless Claims
Friday, April 4, 2025 : Non-Farm Payrolls, Unemployment rate, Average Hourly Earnings MoM,Average Hourly Earnings YoY, Fed Chair Powell Speech
Key Levels to Watch:
Yearly Open 2025 : 6001.25
Key Resistance : 5850- 5860
LVN : 5770 -5760
Neutral Zone : 5705-5720
Key LIS Mid Range 2024 : 5626.50
2024-YTD mCVAL : 5381
2022 CVAH : 5349.75
August 5th, 2024 Low : 5306.75
Scenario 1: Bold but Strategic Tariffs (Effective Use of Tariff to reduce trade deficit and raise revenue) : In this scenario, we may see relief rally in ES futures, price reclaiming 2024 mid-range with a move higher towards key resistance level.
Scenario 2: Maximum pressure, maximum tariff (All out trade war) : In this scenario, we anticipate a sell-off with major support levels, such as 2024- YTD mCVAL, 2022 CVAH and August 5th, 2024 low as immediate downside targets.
Scenario 3: Further delays in Tariff policy (A negotiating tool, with looming uncertainty) : In this scenario, sellers remain in control and uncertainty persists, while we anticipate that rallies may be sold, market price action may remain choppy and range bound.
Daily Trade Recap based on VX Algo SystemEOD accountability report: +$537.50
Sleep: 8 hour, Overall health: Energized
As mentioned in our trade recap video yesterday, today was suppose to be really bearish and go down more,
However, the inflation report ended up being really bad and that just crashed the market all day.
I was expecting to see some bounces here and there along the way but it was just straight drill with no buyers in sight.
Daily Trade Recap based on VX Algo System
8:24 AM Market Structure flipped bearish on VX Algo X3! Look to STR at 1 min MOB or resistance.
11:10 AM VXAlgo NQ 10M Buy Signal
3:36 PM VXAlgo NQ 48M Buy Signal

Daily Trade Recap based on VX Algo SystemEOD accountability report: +$786.25
Sleep: :ok: Overall health: Day 1 of fasting, edgy as f
I finally got to test Caffeine and lions mane on an empty stomach and it was crazy, really sharp focus but jumpy as well.
We started the day off pretty scary, Huge drop to 5720 and instant recovery to the top. Traded a bit on one of my APEX evals that renewed today but
Didn't really touch the funded account until 11:20 when we hit the 48m resistance and got a 10m signal.
Overall day was pretty decent, 10m and 5 m chart worked really well.
Daily Trade Recap based on VX Algo System
9:50 AM VXAlgo ES 10M Buy signal 2x
11:10 AM VXAlgo ES 10M Sell Signal 2x
12:24 PM Market Structure flipped bearish on VX Algo X3!

Daily Trade Recap based on VX Algo SystemEOD accountability report: +$790
Sleep: Great Overall health: :check:
Overall pretty decent trading day, spotted long term sell signals on market across the board this morning pre market so I was expecting thing to be bearish and drop. It played out as expected and helped with the trades today as thing went according to plan most of the time.
I did expect a V shape recovery at some point but that didnt happen.
Daily Trade Recap based on VX Algo System
10:36 AM VXAlgo NQ 10M Buy Signal,( didn't work that well)
1:30PM 10min MOB bounce :check:
2:09 PM VXAlgo ES 10M Buy signal + 10min MOB (Double Signal) :check:
3:36 PM VXAlgo NQ 48M Buy Signal :check:

Daily Trade Recap based on VX Algo SystemEOD accountability report: +$760
Sleep: Bad Overall health: drained
Daily Trade Recap based on VX Algo System
9:50 AM VXAlgo ES 48M Sell Signal ( didn't work that well)
10:10 AM VXAlgo ES 10M Buy signal (Double Signal) :check:
12:47 PM VXAlgo ES 10M Buy signal (Double Signal) :check:
3:30PM doji trade + expecting 48m to flip up
Market stalled a it today as expected because we ran up a lot yesterday,
We did go a bit higher but not much up from yesterday's high.
Overall decent range day if you trade the 1 min MOB.

Daily Trade Recap based on VX Algo SystemEOD accountability report: +$650
Sleep: 🆗 Overall health: feeling drained today.
Health wise, Feeling really tired today, might need to really add red light therapy to my morning process.
Daily Trade Recap based on VX Algo System
11:39 AM VXAlgo NQ 48M Sell Signal (took mes but got stopped out)
12:26 PM VXAlgo ES 48M Sell Signal +NQ 48 sell (made money)
1:30 PM VXAlgo ES 10M Buy signal (avg down at support & made money)
In regards to the market today, we broke over the 48 min resistance yesterday night when market opened and it pushed us into bullish zone,
naturally when market is in bullish zones, it can push hard so you just have to sit back and watch if you missed the entry.
Which was what I did and just waited until we get a sell signal.

ES Futures Weekly Trade Plan & Navigating Turbulent Waters CME_MINI:ES1!
Macro Analogy
The current market landscape and macroeconomic environment can be compared to the dynamics of "sticks and carrots." The market is largely headline-driven, responding to the shifting expectations surrounding the Federal Reserve's stance, political events (such as the ongoing influence of the Trump administration), and sidelined investors who are waiting for a clearer signal on where to allocate capital.
Looking at the market action, the low on March 13th, 2025, could mark a point of sector reallocation. Specifically, the Russell 2000 index is currently leading, with the S&P 500 and Nasdaq trailing behind. This suggests a shift in investor sentiment from large-cap stocks to smaller, potentially more dynamic sectors.
In the backdrop, Federal Reserve speakers scheduled throughout the week may help clarify their position on the evolving macroeconomic situation, notably the persistent risk of stagflation. The challenge for central banks is becoming increasingly apparent: balancing rising inflation, increasing unemployment, and slowing growth while striving to meet their dual mandate of price stability and maximum employment. These pressures are intensifying the difficulty of effective policymaking.
If we liken the US administration to a ship navigating through turbulent waters, the Federal Reserve could be seen as a submarine working behind the scenes to stabilize and support the administration. Chair Jerome Powell, at the controls, is leveraging all available tools to ensure financial stability. Meanwhile, at the helm of the ship is the US President, whose decisions and actions impact the broader economic environment, either calming or exacerbating the turbulence. The new adventures of the Gulf of America have entered uncharted territory.
In this context, last week's actions, slowing the pace of Quantitative Tightening (QT)served as the "carrot," aimed at cushioning the economic pain despite worsening economic forecasts. However, the message that FED sounded was that, due to uncertainty, our forecasts are subject to change. Take them with a pinch of salt.
ES Futures Big Picture:
The ES futures market is currently testing key resistance levels, and this zone will serve as a critical inflection point for both bulls and bears. The next steps will likely hinge on the clarity emerging from both macro events and Fed commentary.
Key Levels to Watch:
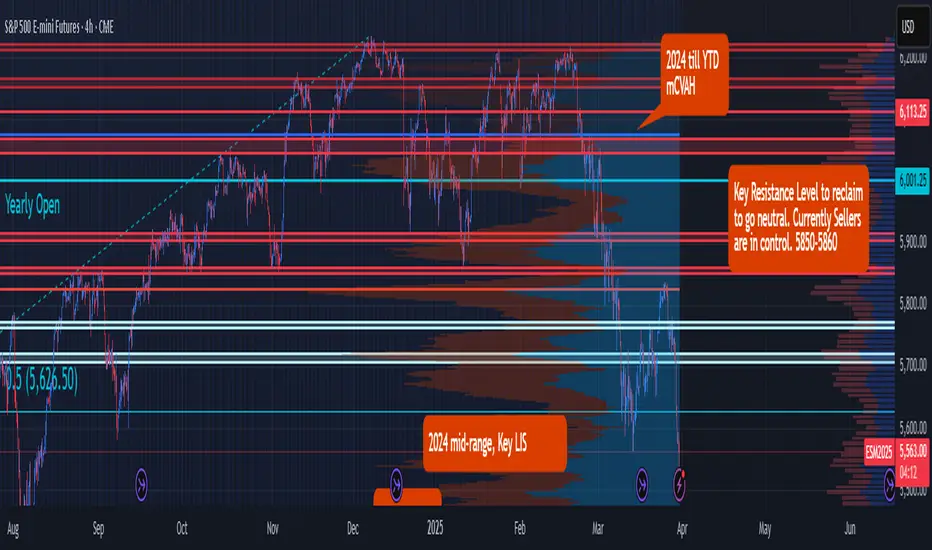
• Yearly Open 2025: 6001.25
• Key LIS (Last Important Support/Resistance): 5850–5860
• Low Volume Node (LVN): 5770–5760
• Neutral Zone: 5705–5720
• Key Support Mid-Range 2024: 5626.50
• 2024-YTD mCVAL (Market Composite Value): 5505.25
• 2022 CVAH (Composite Value at High): 5341
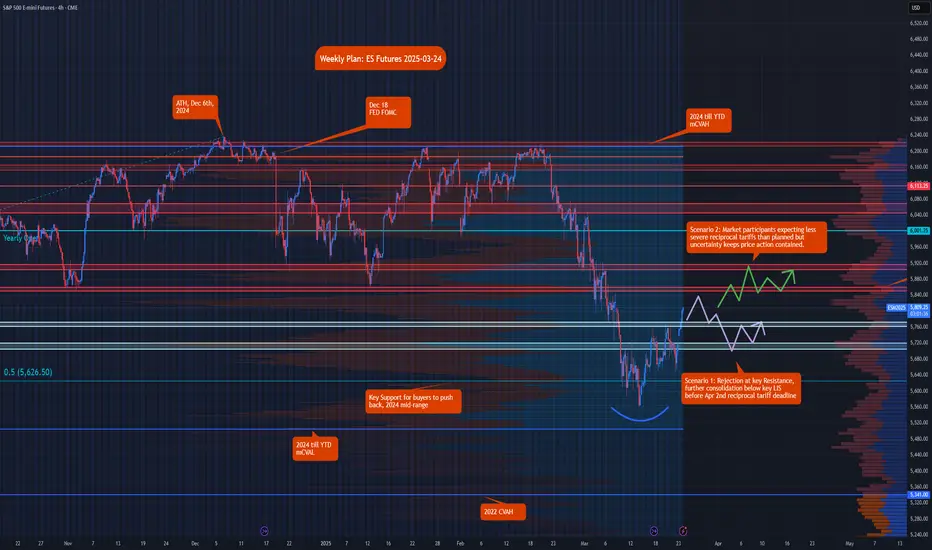
Scenario 1: Rejection at Key Resistance
In this scenario, we expect rejection at the key LIS levels, with further consolidation below the 5850–5860 range before the April 2nd reciprocal tariff deadline. This could lead to a retracement back toward the LVN area (5770–5760) and a potential drop to the neutral zone around 5705–5720.
Scenario 2: Market Participants Expecting Less Severe Tariffs
Should market participants anticipate less severe reciprocal tariffs than initially planned, but remain uncertain about the broader macroeconomic picture, we could see the price push above the key LIS levels. This would likely result in a consolidation phase until more clarity emerges, with the market continuing to trade in a volatile range above key LIS.
Recap ES Futures Weekly PlanCME_MINI:ES1!
In this TradingView blog, we’ll recap the price action and share our insights from the weekly trade plan posted on March 3rd, 2025.
Our Scenario 3 highlighted mounting risks, with weaker economic data reigniting the stagflation theme. While the price action largely aligned with our expectations, it extended further downward than anticipated. Economic data was mixed: PMIs exceeded expectations, while the NFP report came in lower than forecasted. The unemployment rate ticked up to 4.1%, and average hourly earnings data showed mixed results. The Month-over-Month figures were in line with expectations, but Year-over-Year average hourly earnings came in slightly lower at 4% versus the consensus of 4.1%.
In addition, headline news and tariff uncertainties dampened sentiment across the board.
Our approach primarily involves volume profiling and market auction theory to map out price levels and set expectations based on the prevailing market context at the start of each week. However, as fundamentals, macroeconomic factors, geopolitics, and headline news gain increasing significance and impact the market, we draw on our accumulated experience to incorporate these elements into our analysis.
When market regimes shift, technical analysis alone often proves insufficient. A strong understanding of fundamentals, macroeconomic conditions, and geopolitics is crucial to staying aligned with what’s actually happening in the markets, rather than relying on your personal thoughts and assumptions.
Given the myriad factors influencing the economy and markets, traders should recognize that each approach has its merits. We recommend sticking with the strategy that works best for you.

ES Futures & Macro Trends: Key Levels and Market ScenariosCME_MINI:ES1!
Macro and Geopolitics:
There was continued news flow over the weekend after derailed talks between Trump and Zelensky. Europe, UK and Saudi Arabia are still pushing for a Russia-US-Ukraine peace deal that will likely include rare earth minerals.
We also heard Trump commenting on an executive order on digital assets strategic reserves helping reverse losses in CME BTC futures. Investors see this as a positive development prior to the upcoming Crypto Summit in Washington on March 7th.
US March 4th tariff deadlines loom for Canada, Mexico, and China. Trump repeated America's first stance commenting that border security and stopping illegal drug trades should be America’s prime focus.
Economic Calendar:
Looking ahead this week, key economic events include manufacturing PMI data on Monday, employment and services data midweek, and major central bank decisions and labor market reports toward the end of the week. Here’s a breakdown of important releases:
Monday:
Manufacturing PMI data release
Wednesday:
ADP Nonfarm Employment Change
Services PMI
Crude Oil Inventories
Thursday:
European Central Bank (ECB): Interest rate decision & monetary policy statement
U.S. Data:
Weekly Initial Jobless Claims
Continuing Jobless Claims
U.S. Trade Balance
January 2025 Imports & Exports data
Friday:
U.S. Employment Data:
Nonfarm Payrolls (NFP) report
Average Hourly Earnings
Unemployment Rate
Federal Reserve Speakers:
Bowman & Powell scheduled to speak
ES Big Picture:
Despite increased volatility and risks mounting, looking at the daily chart shows that ES futures are still within range and trading above Nov 4th, 2024 and January 13th, 2025 low, however, 2025 mcVAH and R1 confluence has been acting as strong resistance and keeping the markets from reaching new all-time highs.
Despite the risks, our analysis suggests that with the U.S. economy showing resilience, a "buy the dip" approach remains favorable. However, staying selective and strategic with opportunities is key to balancing risk and reward.
Key Levels:
Key levels represent areas of interest and zones of active market participation. The more significant a key level, the closer we monitor it for potential reactions and trade setups in alignment with our trading plan.
2025 VAH: 6,150
2025 VPOC: 6,133.75
LVN: 6,113.25
Neutral Zone: 6,000 - 6,015
2025 VAL: 5,972.50
LIS/Yearly Open: 5,949.50
Neutral Zone: 5,916.50 - 5,927.25
Feb 2025 Low: 5,848
Jan 2025 Low: 5,809
Scenario 1: Range bound week
Market remains volatile, however, within the neutral zone below key LIS/yearly open and neutral zone above Key LIS/yearly open.
Scenario 2: Weak data points slowing economy
Worsening economic data points along with progress in Ukraine- US minerals deal points towards further buying. Weaker data points may provide room for further rate cuts should economic weakening further materialize.
Scenario 3: Mounting risks and weaker economic data
On the contrary, mounting risk and weaker economic data may point towards stagflation as inflation remains sticky while the economy weakens. This provides room for further decline in ES futures.

#ES_F Day Trading Prep Week 03.02 - 03.07.25Last Week :
Globex opened above VAH of 6054 - 5933 HTF Range and February RTH Cost basis which gave a hold to start the week to push us into the above Edge but more strength didn't come in, instead we ended up holding under 6074 - 60s and closer to Monday RTH open price failed in the Edge giving us a move into lower Value with a close inside it. Holding under Cost Basis meant weakness for longer term buyers and triggered moves lower all week as they needed to get out closer to month end we got. Lower Edge kept giving bounces back into Value which kept building more supply and when MM Month end came on Thursday we were able to take the stops under 5930 to give us continuation to test lower Value under 5870s. To finish the week we found buying inside lower Value and what I think was end of the Week short covering before the weekend which pushed us back into the Edge in the afternoon, all momentum traders had to do was buy it up under the Edge to push price back inside which triggered stops on the way up to give us end of day squeeze back into above VAL where all the supply was.
This Week :
We are starting a new Month and things can be tricky to start, we are at interesting locations on Weekly, Daily and Hourly charts with quite a few options going into this week so we really have to be open to different scenarios as things are not as clear as they were last 2 weeks going into Month End.
On Daily TF we have showed a failure over Daily Edge Top and at the same time have transitioned into a correction mode under it which gave us the move from Daily Edge into Daily VAH at 987 - 67 and flushed the buyers under it through Daily Mean towards Daily VAL at 846 - 28 without tagging it. End of week covering took us back into Daily VAH but left Daily TF in Correction mode under its MAs.
On Weekly TF we had a long consolidation in new Weekly balance over 5950s but we never transacted through the whole balance which means no acceptance in it, instead we built up a lot of Supply inside which at the end of the Month gave us this move back into lower Balance with a strong break and close under smaller MA with price closing right at the top/bottom ( depends which way we look at it ) of Weekly Balance. For now this tells us that we could see more weakness going into this new Month, as long as we hold under Weekly Smaller MA which is around 6010s and don't accept back above Daily VAH of 5987 - 67 then that could bring in continued weakness to rotate lower back towards Daily Mean and possibly test Daily VAL and maybe see a push under it.
Holding under the Daily Edge of 6073 - 43 implies continued weakness as well and will continue to target lower Daily areas all the way down into its bottom Daily Edge at 5754 - 24 which has Weak Stops and a Gap to fill under which was made during contract roll. Does not mean we will go there right away or go there at all of course BUT there are lots of things stacked up for more downside so far, of course we have to watch each area for continuation through but if there is still more sell volume to come out then we have to watch out looking for much higher prices from here and instead look for balances with weakness and rotations back down.
This week could play out as an inside week with weakness towards the bottom of previous week and IF there will be stronger volume then we could see last weeks lows get taken to give us pushes towards Previous Distribution Balance that we have made back in October which would be next big spot to visit.
On the Upside IF buying from Friday sticks and we start holding over 5930 - 40s then need to be careful forcing downside as we could build up enough and bring in more buying to push into above Value again, we do have trapped buyers inside it from last week so it would be a spot to be careful at as we could continue to see selling out of that Value on any pushes into it, for more strength inside that Value we would really need to push through VAL and start holding over 5970 - 90s which would signal stability and could have the price balance inside that Value and of course for anything higher we would need to take out February RTH cost basis above VAH because we have most of the buying from last few months trapped over it.

#ES_F Day Trading Prep Week 2.23 - 2.28.25Last Week :
Globex opened inside the Mean of HTF Ranges Value where we found balance to start the week, we had supply over 6144 so any pushes over which were made during afterhours kept coming back into the Mean but failing to continue tag VAL which kept the market stable and balancing over until we had RTH Volume make a push over 44 which held and brought in more buying to test previous ATH areas at 6160s but market needed to hold over 60s after such a move to bring in anymore strength, instead we came back in, trapped more volume over 44s towards the end of the week once we flushed into VAL, holding under 44 into the end of the week forced all the trapped volume over to sell out which started taking stops giving the move lower we were looking for that kept triggering continuation with every lower area it hit to finish the week right at lower VAH inside the RTH Cost Basis that was build on top of the gap down that failed to continue during beginning of the Month.
This Week :
A bit tricky week to start here or should I say finish this Month off as we are heading into last week of February we have few things to look at here. Yes we had strong selling, trapped a lot of buy volume this month over 6050s which is not getting the upside and time to pay or close has come, we finished last week with a strong sell back into 6054 - 5933 HTF Range which tells us that as long as we stay under the upper Edge could bring in more weakness and we should see continuation inside and towards lower targets BUT question this week is will it come during the beginning of the week or will February RTH Cost Basis make us wait until later in the week, of course that is IF more weakness comes at all right ?
For now what we know is we have close Friday inside 6064 - 6023 Intraday Range, we have a cost basis here under 6034 which could possibly prove to be good enough to give us some sort of a hold/balance at/over it to start the week, if this will be the case then we need to watch out for slower action again and some back and forth in this 6020 - 40s area, with any pushes towards 43 - 54 - 58 areas to be possibly met with weakness so need to watch out for price not sticking around there too long or not continuing over and instead returning back towards VAH into that cost basis. How long this area would hold is for us to find out but we don't have much market moving data to start the week, unless whatever news from Friday or this weekend will be enough to give us bigger moves to start the week. IF we do hold over to start the week I would still watch out for thinking bigger bounces from here back over upper Edge as we could find more sell volume come in Tuesday or Wednesday as long as we hold under 6050s that can bring in more selling closer to Month End as that will force more size to close out above positions.
If we do have strong volume and can open under VAL or get under 6023 - 18 area and hold under then that would change things and could bring in more selling sooner. Either scenario if we get under this cost basis we would be looking for continuation towards lower Globex Cost basis into VAL and that area may fold with volume and can give us pushes out of Value again for the lower Edge which would be the spot to watch again for any more weakness.
And of course for any strength to the upside from here we would need to climb back into the Edge and start holding over 6054 area AND see strong push over 70s that can hold over, until then really need to be careful with looking for more upside from 40 - 50s as selling could come and push us lower. If we do start holding inside/around the Edge then will need to be careful looking for too much downside from here as we need to keep holding under 50s to really bring in that weakness and cause more selling, if selling doesnt come this 6064 - 23 Intraday Range could become our balance range until we will be ready to accept above or below it which would cause back and forth inside it with pushes out coming back in.

#ES_F Day Trading Prep Week 2.16 - 2.21Last Week :
Sunday Globex again opened on a gap down just like previous week but this time it opened right at lower VAH and got a push back into over 6074 - 54 Edge. Holding over 6050s and inside/over the Edge meant stability for the market which brough in more buying but as we can see it took us a whole week of consolidating under VAL before we were able to push into upper Value towards the end of the week. We pushed into the Mean right up against our previous Supply area and that served as good resistance to keep us in small balance to finish the week on Friday.
This Week :
Tricky spot we find ourself in this week, on higher time frames like Monthly we are having inside month, weekly we are still holding sideways/up trend inside this 6230s - 5950s balance but one thing to note is we have mostly been back and forth between this balances Mean area and the low, so far dips under the low kept getting bought but we are not really getting any upside or holds over the Mean areas which could mean no acceptance inside it to cause continuation towards the top. On Daily TF we have been holding over between the Daily upper Edge of 6073 - 43 and upper Daily VAL of 6144 - 25 where we found balance to end the week on Friday.
Going into this week we are again inside the Value of this 6074 - 6195 Hourly's range and there are few things we can watch from here. If the market has truly accepted inside this range then we may hold inside the Value which will mean ranges will tighten up and we look to balance inside Current Intraday Range of 6155 - 6114, we have supply over 6144 so any pushes over it towards 6155 could find their way back into the Mean and we could see covering under 6125 over VAL. BUT something we have to watch out for is IF we again fail inside this Value and get into/under VAL this will be our first signal for a failure which can bring in weakness towards lower Edge, IF that happens and we find ourself inside lower Edge under 6074 - 60s that would confirm the failure and may bring in more weakness for market to try and go find Value lower, we do have lots of HTF stops lined up under us which would keep bringing weakness if we start taking them. We don't have any market moving data until Fed on Wednesday which could mean a slow start to the week and we must be careful forcing for downside IF we are holding over VAL because that keeps us stable. Of course IF we do again open on a gap down like we did last 2 weeks then that could change things BUT this time around IF we do then we need to be careful looking for a full return back like we had last 2 times.
For more strength out of this Value we would want price first show us holds over 6144 AND find stronger buying that can take us into/over upper VAH, until this happens we really need to watch out over 6140 as we may finish this month either inside +/- month inside this Value under 6160s OR since its our 3rd month in these areas without any upside, we could see size sell us back down towards Monthly balance lows which are down at 5950s.

Recap: CL and ES Weekly Plan analysis & Key LevelsNYMEX:CL1!
CME_MINI:ES1!
In this trading trading view blog we will refer to our February 3, 2025, weekly trading plans.
Our main idea for ES futures was to get long above yearly open, also our key LIS (Line in Sand). And our main idea for CL futures was to stay short below February monthly open targeting mcVAL and then waiting for an opportunity to get long at our key bullish support zone.
Below we explain our thoughts behind these ideas and how we choose our key levels and the process to create our plan.
ES Trade Idea: Key Levels and Strategies Amid Macro Uncertainty :
From our ES trade plan, scenario 1 played out. The line in sand for long trades was Key LIS/Yearly open. Click on the link above to see how this played out!
Our key levels for the trade idea noted in the blog were:
(mcVAH) micro composite value area high: 6,134.25
Key LIS/Yearly Open: 5,949.25
(mcVAL) micro composite value area low: 5,914.25
(CVAH) Composite Value Area High: 5,924
mcVAH held as an area of initial resistance. Our neutral zone at 6,068.25 - 6,051.50 acted as a zone for pullback after initial push higher. The remaining week was choppy with some days more volatile and playing out per our scenario 1 in our trading plan.
CL Trade Idea: Key Levels & Strategies Amid Volatility:
From our CL trade plan, scenario 1 also played out.
Why we favored this as scenario 1 was due to rejection confirmed at January 2025 mid range. The provided a good short opportunity below Jan 2025 mid or February monthly open towards our key levels as specified in the trading plan. We mentioned the following key levels in last week’s plan.
Micro Composite Value Area High (mCVAH) January 2025: 76.00
January 2025 mid- range: 74.96
February Monthly Open: 74.14
Micro Composite Value Area Low (mCVAL) January 2025: 71.82
Yearly Open: 70.52
2024 Mid- Range: 70.40
mCVAL provided a good target for short trades, while Yearly open and 2024 Mid-range confluence at our key bull support provided a good spot to initiate the long trade idea.
Following a consistent process can help traders stick to a trading approach that can help them achieve consistency. Losses are an inherent part of trading, executing the trade plan also involves weighing which scenario will play out on the hard right edge in real- time. However, our market analysis blogs are aimed to educate traders, showing whatever their methodology or approach, consistency in preparation and having a roadmap of important price levels will help them distinguish between getting caught in noise versus important areas to engage with markets.

ES Trade Idea: Key Levels and Strategies Amid Macro UncertaintyCME_MINI:ES1!
ES futures opened with a gap down on Sunday.
With numerous macro headlines, President Donald Trump’s comments on the Fed’s decision last week, and ongoing trade war tariffs, traders may struggle to distinguish what truly matters for the markets from the noise.
In our opinion, do not let macro headlines cloud your judgement. Have a trade plan and be ready to adjust with market conditions and volatility. One way to mitigate risk is by utilizing micro CME contracts , allowing for more precise risk management during volatile market conditions. Additionally, you can participate in the CME and TradingView paper trading competition, giving you the opportunity to test your skills in The Leap without risking real money.
Remember, it's NFP week, and several other key economic data releases are also on the calendar.
In our view, it is important to zoom out and reduce key levels on your charts to ones that are significant.
Key Levels:
Key levels represent areas of interest and zones of active market participation. The more significant a key level, the closer we monitor it for potential reactions and trade setups in alignment with our trading plan.
(mcVAH) micro composite value area high: 6,134.25
Key LIS/Yearly Open: 5,949.25
(mcVAL) micro composite value area low: 5,914.25
(CVAH) Composite Value Area High: 5,924
Scenario 1: Long above Key LIS
Our key LIS is still Yearly open as it was discussed in last week’s idea. We are looking for long trade setups at this level.
Scenario 2: Short below Key LIS
If the price moves lower and holds below a key level, we will look for short trade setups targeting our green support zones on the chart from mcVAL and CVAH confluence.
