17/11/2020 #SPX #ES_F Be bullish, just don't be the last buyerIt is pretty amazing how they can release vaccine news one Monday after another, and the market just spike up (prob due to algo) like that. Interestingly it happened after Presidential Elections, I mean Trump is like boasting how much he did to help USA with the Covid isn't it? But yet this news came later. Are the CEOs of the 2 companies Biden supporters?
My plan yesterday was titled #SPX bullish for now.
This is in view of the 3510 level which I said need to break, which hasn't. But if you didn't follow me on Twitter, I said that downside risk for all indices #SPX #DJIA #RUT exist as long as #NDX 12080 not broken. Do note this
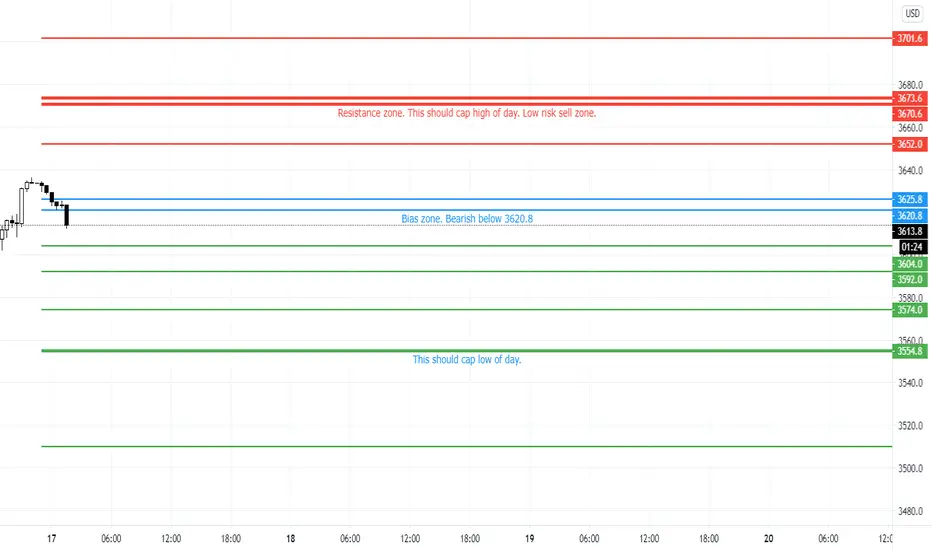
Today we started off with a gap up but now is coming down. #NDX went above 12080 but fail (look above and fail). IMO is bearish.
Price has already crossed my blue zone - bearish. Below targets are 3604, 3592, 3574. 3554.8 should cap low of day but if that breaks, 3510 (the important level!) is below.
Above 3625.8, look for longs, targeting 3640, 3652, 3670. 3670 is really a strong R. Expect it to hold. But anyway above it, we have 3701.6
Es_f
16/11/2020 #SPX Bullish for nowI was wrong with my bias on Friday but no damage done. Above my blue zone go long (multiple re-test of my blue zone) would give good profits.
Today price opened and rallied. A strong one I would say, above my initial R to the next R. Above R are 3640.2 and ATH 3670.6-73.6
Now price stuck at 3614. I had tweeted this to be a strong R together with #NDX 12060. Inability to go above will bring us back to 3592 and blue zone at 3568-73.
To even come back to this level would be interesting. Expect fast sell if 3568 breaks, targeting 3542.4, 3526, 3508.6. 3498 should cap low of day but I included 3480 (Fri's projected low in).
Also do note in my tweet I said that #SPX 3510 needs to be break to invalidate the upmove.A close below it will be interesting.


13/11/2020 #SPX Friday the 13th. BewareAs warned yesterday, don't be too bullish for #SPX. We had a sell lower and based on price action, we are looking for further down today. Blue zone, bearish below 3552.4.
Now price is firmly below the blue zone, with targets at 3516, 3503.4, 3480-86.5 will offer a strong buy zone, while if we do hit 3454.6, will offer a low risk buy level.
Above, 3552.4, we have 3566.5, 3576.2 as resistance. Unlikely price will go above 3608-14 strong resistance zone today.

12/11/2020 #SPX Don't be too bullishYesterday we had a rally brought up by #NDX. #RTY was quite flat. Where's the money? Any MORE left?
Blue zone at 3576.2-3580. Cautiously bearish below. Upside targets are 3596 and 3612 and 3641.2 will offer a low risk sell level.
Price is now already below my 1st support at 3566.6 (I tweeted on a return to 3552 and took a short at 3576). Lower support at 3550.4, 3536, 3520.9, 3500.6-3504. 3474.6-80.2 should cap low of day, can look to buy there.

11/11/2020 #SPX Either way. We have a Doji daily close yesterday. In terms of price action, difficult to predict. Either way is possible
#NDX weakness will continue to weigh on #SPX though #RTY is strong (staying new highs).
Price now in my blue zone 3544-54. Above we have 3573.2-76 and 3600 as resistance. 3614, if we reach there should offer low risk sell level.
If 3544 breaks, look for 3520-22 then 3480-88 if yesterday's low are taken out. This is a strong support zone so might have a bounce. 3464 is next level while 3446 should cap the lows of day

10/11/2020 #SPX volatile times aheadYesterday was a volatile day. Made ATH and more but on low volume and it back came down.
But RTY didn't came down as much thus this is something to take note of if you think a crash is coming. But bias to the downside below 3584. 3572-84 is the zone to watch, for a pullback and good short.
Below targets are 3510,3492.6, 3470-80, 3466, 3452, 3426-35.6.
If 3584 breaks, upside resistance will be 3614, 3644 and 3673.4, yesterday's high and R, should cap high of day

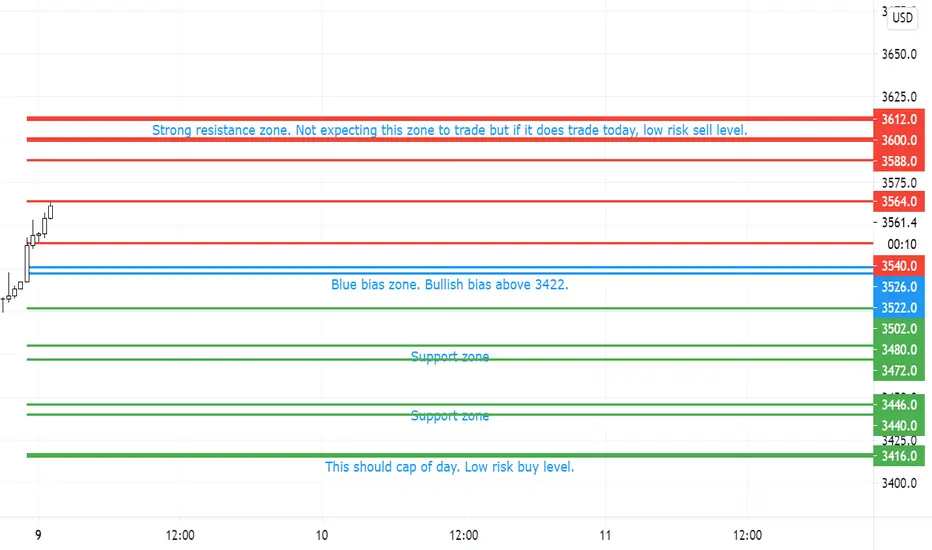
09/11/2020 #ES_F #SPX Trade what you see not what you thinkSimilarly to NDX, price gap up and is going higher. Pullback will come and difficult to short a strong market.
Initial resistance at 3540 breached and now at next R 3564. If fail, look for re-test of 3540 for a bounce. If it holds, we are looking at ATH and higher.
If 3422 breaks, look for shorts to 3502, 3472-80, 3440-47. 3416 is a low support which will cap low of day.
S&P 500 E-Mini Futures (ES) Resumes Rally HigherShort Term Elliott Wave View in S&P 500 E-Mini Futures (ES) suggests that the Index remains within the cycle from March low as an impulse Elliott Wave structure. The 60 minutes chart below shows the Index ended wave ((4)) at 3226.90 and it has resumed higher. Up from wave ((4)) low at 3226.90, 1 ended at 3323.5 and pullback in wave 2 ended at 3272. Index resumed higher in wave 3 towards 3397 and wave 4 pullback ended at 3328.50. Index then extended in wave 5 towards 3432.25. This completed wave (1) in higher degree.
Pullback in wave (2) then ended at 3319. Index has then resumed higher within wave (3). Up from wave (2) low at 3319, wave ((i)) ended at 3408 and pullback in wave ((ii)) ended at 3357. Wave ((iii)) ended at 3480, wave ((iv)) dips ended at 3428.25, and wave ((v)) higher ended at 3522.50. This completed wave 1 of (3) in higher degree. Wave 2 pullback is now in progress to correct cycle from November 4 low in 3, 7, or 11 swing before the rally resumes. As far as pivot at October 31 low (3226.90) stays intact, expect the Index to see further upside.

SPY - Wednesday, November 4Bulls showed up today. We've pierced thru a couple significant resistance levels in the past couple days. But will it continue? If we're going to go long at this point we want to see a big volume candle bust thru the cloud, pullback and bounce to continue the trend that's been developing over the past couple days. Momentum has been steadily rising over the past few days, which has made me want to put on my bull hat, but note the OBV divergence across the day. This is not what you would normally see when price is ready to break out. Momentum may be artificially propping these prices up. If you cycle down to the lower time frames, pay attention to when price action runs away from you, as it did in the last 5 minutes of todays trading session. There was some bullish buying, but the sellers aren't gone yet. Might need to range at these prices for another week while the VIX cools down before we see headway into the $440s, otherwise, expect a blowout top with a quick breakdown to the past week lows. The bounce at $335 was enough to get me to close my short position, but I still want to see some evidence that prices can hold at these levels before going long.

05/11/2020 #SPX #ES_F Bullish yes but pullback will be healthy
Yesterday was US Presidential Elections Day. Outcome still not known but seem like Biden is going to win it. Lots of up down in between and fake downs but bulls win it.
No doubt price is bullish but based on price action, pullback is possible today. Price now at my 1st R and pullbacked 20pts. See if this level will hold.
Bias still up above 3412-22. But in the event that this breaks, look for 3392, 3356 (strong support level) to trade. If 3324 breaks, look for reaction at 3324. In the event 3262 trades today, it will be a low risk buy level.
VIX - Scythe PatternI see these a lot in crypto charts. Look for a steep and rapid ascent in volatility with a sharp point and fast breakdown after the tip is formed. In simple language, short the market and buy the dollar thru the end of November, and anticipate a steep drop in volatility into December.

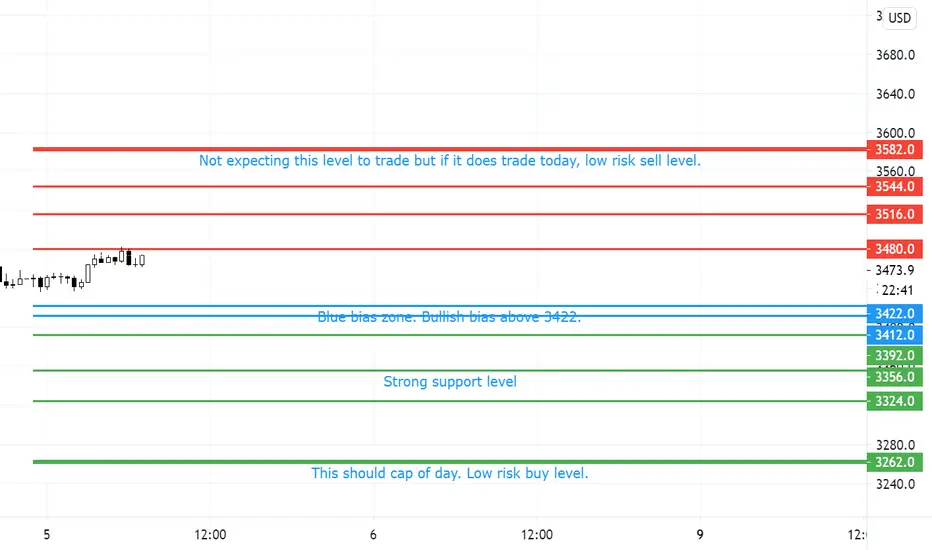
04/11/2020 #ES_F #SPX Today decides the next trendAt time of this plan, price has made alot of reaction with my levels, which is a gd sign that such levels still hold during volatile times like this.
I have a hunch, yes HUNCH that we are going to sell off by end of day. I am often wrong so #comeandfademe.
Upside targets above my blue bias zone (3356-70) are 3402, 3415.2, 3436, each of which have nicely held some advances. Upper resistances are 3480 and 3544.
Below short targets are 3322-24 support zone, 3316.6, 3304, 3276, 3242, 3224. In the event of heavy sell off, 3196 should cap low of day.
Trade safe

03/11/2020 #SPX #ES_F Either way is possible Elections day.
Market was up yesterday and do look to continue - though on my system it is bearish on both monthly and weekly. But expect some volatility today (or maybe tomorrow) and thus either direction is possible.
My bias zone is at 3306-12. Currently price is up, supported by my 3320-24.6 resistance zone. Upside targets are 3345.2-50. 3362-64 should cap high of day.
Based on price action, we might have a deeper pullback to 3292-98.6 but still go up. Do nothing between 3298.6-3306.
Below 3292, look for shorts, target 3266, 3212-8.6. If 3196 trades, it should cap low of day, presenting low risk buy level.

VIX/SP500 Price Action Air Pocket - Heavy Volatility Comingif you pull up a 2-day chart of the VIX and analyze price action using a 200 period MA, you'll notice that price action NEVER creates a pocket of dead space between its moving average and the price action (see turquoise boxes), except prior to a period of major/increasing volatility. I've highlighted the present anomaly as well as the 2007-08 global financial crisis. You'll find the same anomaly prior to all major crashes (dot com bust, etc.) After examining numerous stocks using a daily chart and 200 period MA, I see a LOT of downside when the market eventually corrects. I suspect Feb/Mar 2020 is a preview of what is to come. I also recognize that quantitative easing has created tremendous upward momentum since it was first started in late 2008. The recent market sell-off is evidence that no amount of QE will prevent the market from attempting to revert to its fundamentals.

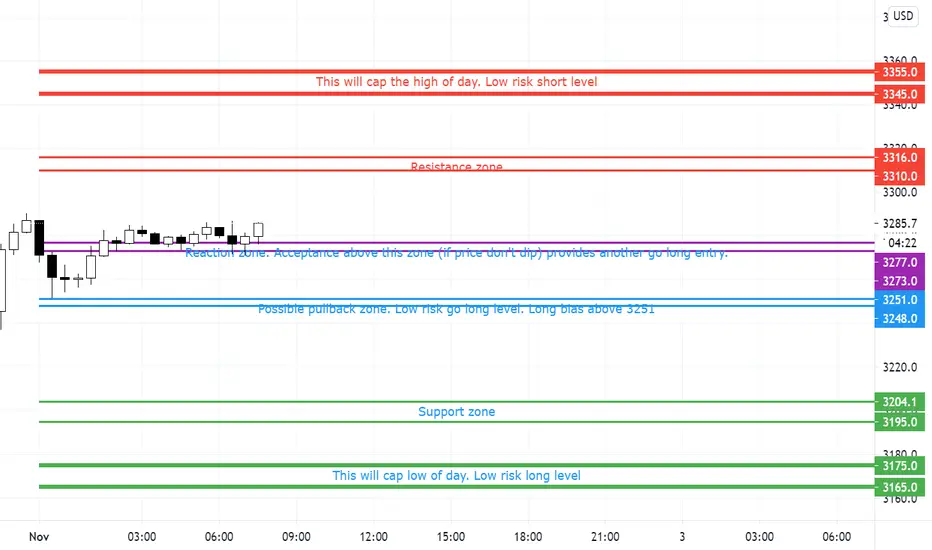
02/11/2020 #SPX Possible Up DayOn monthly, weekly, daily, #SPX is on a downtrend based on my system.
But price action wise, with Friday's doji close, we look to go higher.
This post is later than my usual, some opportunity might be lost already. Price already pullback to 3251 which was my long/short zone. 3273-77 is the other reaction zone to go long, and price is currently above.
Upside resistance will be at 3310-16. 3345-3355 is strong resistance, and it should cap high of day.
In the event 3248 breaks, unlikely today IMO, 3195-3204 will be support. 3165-3175 is strong support, and should cap low of day.
SPY ZoneWhat I'm looking to take as my trade into the election.
Never played an election so please don't copy this trade.

30/10/2020 #SPX Cautiously BullishI tweeted on 22 Oct when SPX is at 3422, we will see a down before end of year to 3140, 3062, 2888.
I called a possible pullback yesterday (29/10) in #NDX. Pullback occurred. When everyone is bullish, news out. Market tanked 300 pts - just at the hit of my R zone (see my other #TradingView post). So where next?
I am bearish longer term but intraday, we MIGHT see price go up today. Yesterday's daily candle was a doji. Price action wise, going up 1st looks more likely. It is not easy to call another up day when a pullback has already happened. But I shall.
3267-73 is support zone. Going long here with a tight stop below 67 offers good R:R, targets are 3295, 3323, 3331, 3355. If some news cause some rally, 3363 should cap high of day. Low risk sell level.
If you are conservative, close above 3295 will provide confirmation for a up day.
If 67 breaks, target 3249, 3212.5. 3185 should offer strong support to cap down move.

28/10/2020 #SPX #ES_F looking for more sell, till I am wrongYesterday (27 Oct) #SPX #ES_F closed at the lows. It is still ranging now. Normally if we are to pullback, it should come quickly from open, but not so yet, thus probably we will sell in Europe session. But do note that 3402-3406 is a valued area of yesterday, there is always a probability we might pullback to there. That will present a low risk short level.
Purple lines 3382 and 3390 are probably R. If you want to trade the pullback you can trade level to level, but as per my plan, the upside (above the blue zone) is limited - 3412 and 3420.
Below support are 3364.8, 3350.8. If 3323.8 hits, it should present a low risk long level.

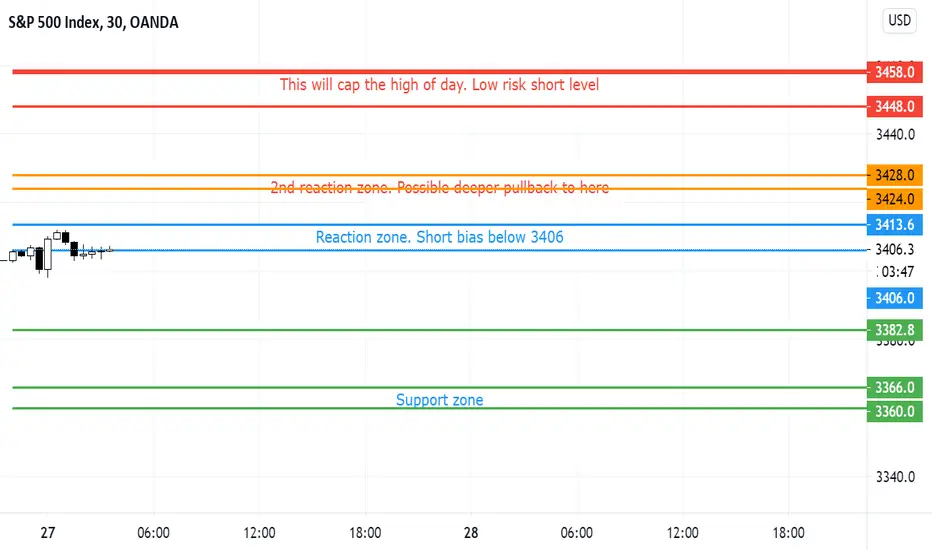
27/10/2020 SPX ES_F Let the sell continueMy post yesterday was titled "Let the crash begin?"
Probably will be more apt without the ?
We had a 100pts downmove then a pullback of 50pts. I still see further down; as I tweeted yesterday, no news is bad news.
Blue zone is usually my buy/sell level.But given the large movement yesterday, I actually put in an orange zone.
Be short below 3406 target 3382.8,3360-66 and even 3318. 3272, if we somehow reach there, will offer low risk buy level.
Do nothing between 3413.6 and 3424. If price pullback to this deeper levell, 3424-28 is the level to hold. If rejected, lower targets as mentioned above will be in play.
I will only want to look for longs above 3428, targetting 3448. 3458 should cap high of day - low risk sell level.
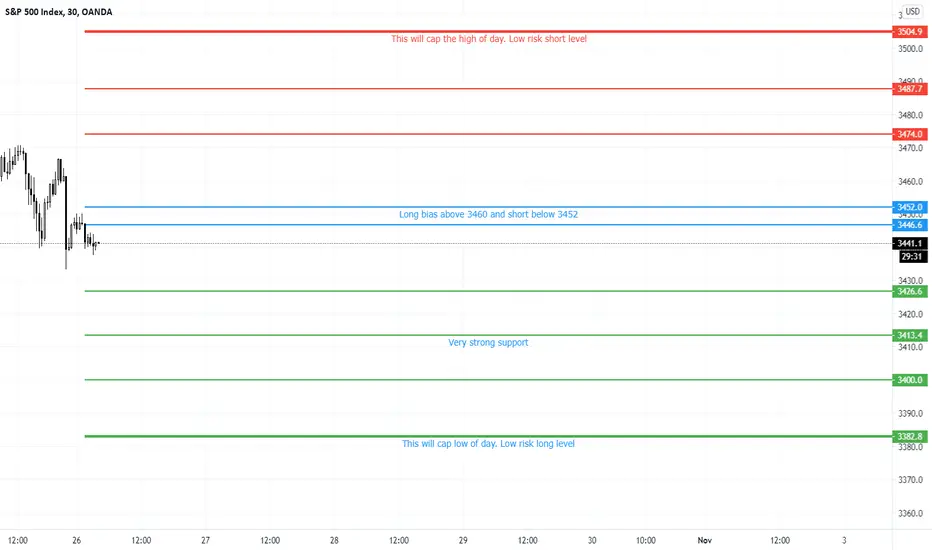
26/10/2020 ES_F SPX Let the crash begin?Price still ranging, in balance. 3 things which could affect the next move in SPX are the earning announcement, elections news, stimulus talk.
On a broader picture, as per my tweet last week, I am seeing a set up for a bigger correction coming before end of year.
Anyway for 26 Oct, look for longs only above 3460, targeting 3474, 3487. 3504 should cap high of day, offering low risk sell level.
Below 3452, bias is to the downside, targeting 3426, 3400. 3382 should cap low of day, offering low risk buy level
SPY - Bearish Divergence Accumulation/DistributionI would not be bullish until we see this distribution wedge broken. Price action is misleading.

SPY - Descending TriangleI'd love to see some arguments why this is NOT a BEARISH descending triangle. Post away! Please reference more than one indicator/chart time frame. A bullish/bearish case may be made at any time using one point of perspective.
