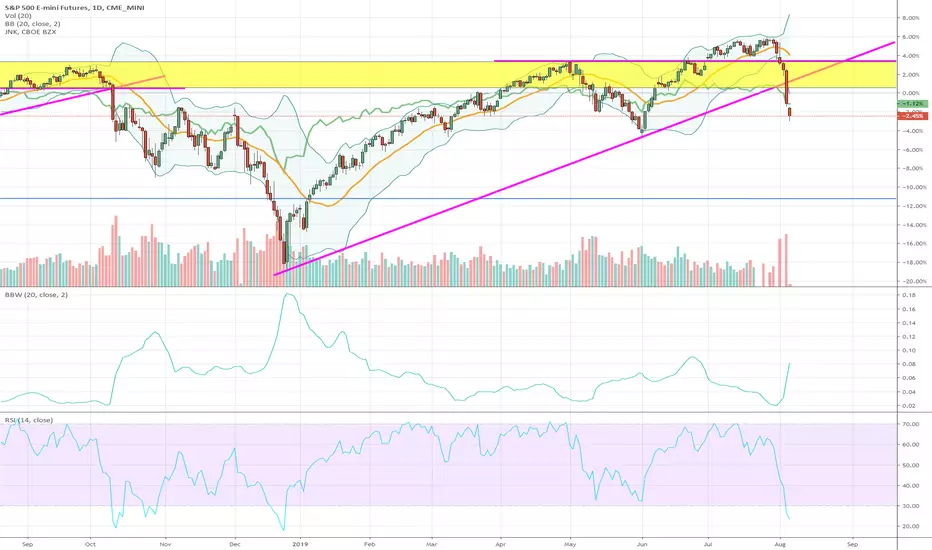
Slashing through support levelsAfter failing to breakout, $ES_F SPX futures slashing through support areas, leaving gaps. The declining RSI in my previous post appears to have been a key sign that this move was not going to hold.
While the market is oversold near term, the veracity of the move shouldn't be ignored. Breakout failures in the past have not been kind to markets. While there may be some retracement back to these support levels, i'd consider that to be a offloading/shorting opportunity as the market outlook seems grim at the moment. Futures at the moment seem to signal further move to the downside, but we shall see if there's any positive development overnight.
Es_f
"Don't tell me what to buy, tell me when to buy it."Tyler Jenk's idea of #Consensio taught me to be pay attention to the 2,7, and 30 week moving averages to identify short, intermediate, and long-term trends. These averages are used to approximate the standard daily averages of 20/50/200 onto a weekly chart. The weekly closes are more important than the noise with each candle.
#Consensio tells me to be cautious here and have some CASH available for a potential buying opportunity if price stays above the blue line on this dip.
Peter Brandt, Aksel Kibar, and Ian McMillan's charts have taught me to look for buying opportunities in a daily breakout launched from a large weekly horizontal pattern (often retested, but sometimes not).
I see this large area of "consolidation at the top" as a garbage pattern, but I believe the spirit of it to be an ascending triangle. It's just a very abused ascending triangle. The breakout was short and the retest has been steep but the blue line has recently turned back upward after some hesitation and price is still above it.
To me, finding a local bottom above the 200 would be a signal to buy anything with a pulse that isn't nailed down.


SPY: 292 broken into no man's land... 289.7 likely tomorrowAMEX:SPY
6/25 (update) - broke through 292 into no man's land... it could further go down to 289.7 area or if it open higher >291 i may go sideway. If I was a betting man, I'd say it would gap down b/c the close was below today's POC.
6/21 (original post) - Price closed below POC of the day on Friday. Thin order flow between 293 and 294. If 294 is held, target is 304. We are in uncharted territory from here now. If 294 is broken, next major support at 292.25


SPY: Gann Analysis on Daily ChartAMEX:SPY
Overlay of 4 different gann fan at recent peaks and lows since Q1 2019. The yellow triangle seems to be the area that it needs to break through in order to keep the bullish trend going.
Fall below the bottom of the triangle (~290) would indicate a reversal of recent bullish trend in the short term with a target of 50 MA around 287.

Expanding triangleContrary to popular belief I don't believe triangles form as sole waves by themselves but are a collection of 3rd and 4th waves of different degrees as demonstrated. It's a nice pattern to pick up because it has a predictable pattern.
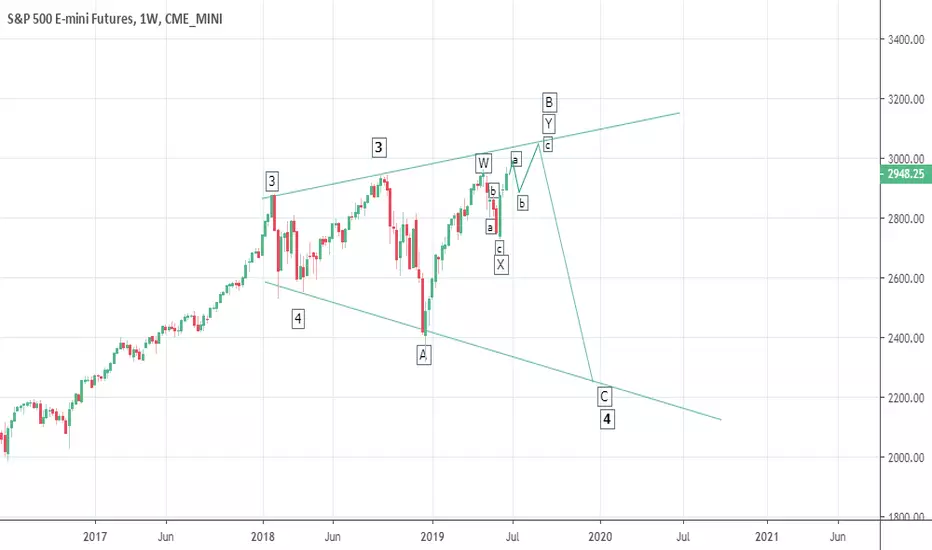
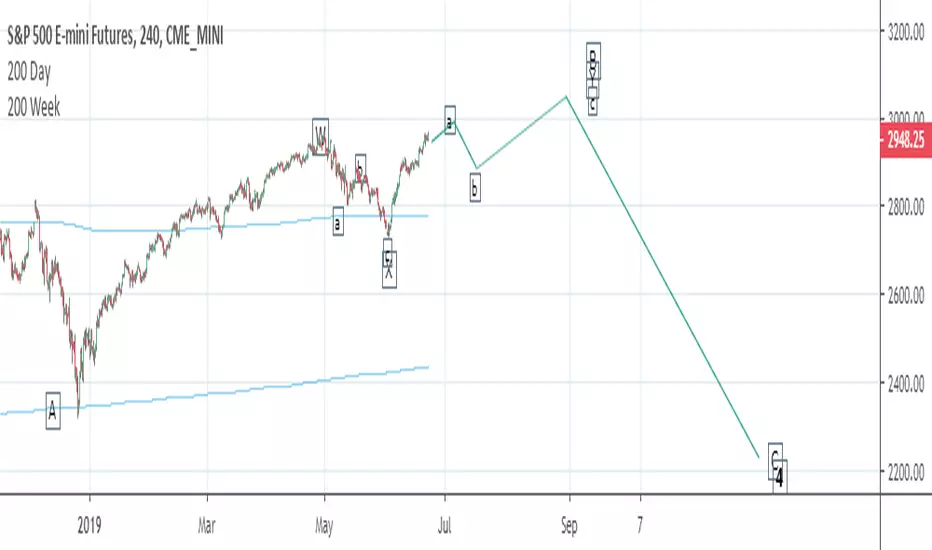
Updated countThis move off the May 31st lows is very powerful and I don't think it's still correction of our W wave but the start of the Y wave. The correction for the W wave, is the X that ended on May 31st. Given the length of this correction from last September, this is most likely a primary wave 4 we are in (or 4th wave correction since rally from 08' lows). We are in Y of B here and almost completed a. Upside target changed to ~3050, should get choppy up there though. We are going way too fast up for this to be a significant top.
The medium term picture has changed though and is no longer a regular flat but an expanded flat because we are making new ATHs, and we could drop to 2200 by the end of the year.
The alternative which is unlikely is that this is a wave 3 of some degree.
Change in countToday was very informational, the fat that we got new ATH made me have to change my long-term count. Instead of a regular flat we are making an expanded flat and we are still in B of the flat. I think we will hit target of 3000+.


E-Mini 500 BullishA very interesting week last week for the ES! (E-Mini S&P 500)
What with the tweets, corporate earnings and the continued trade war!
Uncertainty still prevails. This should be another interesting week. A lot of opportunity and I am expecting a considerable amount of volatility.
There is much in the way of scheduled news events.
Sunday open could be either be a gap down or an inside or a bounce to the upside.
Price action and closed is signalling an upside. However, there is chance that price will want to test Friday low and naked POC at 2814.25 before a move up.
Also of note is that price touched 2827.00 a 0.786 Fib
A confirmation for a bullish day we should see:
1. Price take out Friday’s high
2. Price closing above VWAP
3. Value area must remain in upper area of Friday’s VA or more
4. POC must be equal or above Friday’s


DOW JONES 1960's - comparisonLooking at broadening formations: similar pattern 1960's-80's. Larger span of time then.. just interesting to me

Special formula to spot buys and sells v1.1Special formula to spot buys and sells v1.1 ... buy side amended in related to v1.0... "buys" at green in vertical shade works now better with residual fake signals... the algo results speak for himself take a look for a historical since 2008 and see the signals vs the consequent market reaction if the signals sell and buys are good or not...

$RTY_F $rut $spx VIDEO ANALYSIS - Small Caps Mega Breakout!While the large-cap stock indexes like the $SPY $SPX $QQQ $DIA have been running higher, they are now at resistance and should stall out or at least slowdown. Small-cap stocks have been building a base for a mega rally that could make the large-cap run look like chump change!
See more analysis on the small-cap sector: Click Here

Update S&P 500: A bull in a bears clothing, DOWN first!1 to 1 target for Wave 5 would complete somewhere around $2,940. At present there is no opportunities to buy or sell the S&P 500.

S&P 500 - Recession and the first bullish correction.For those that followed my prediction for the top of the market and the crash (
), here comes the next step in the recession. Yes, we are in a recession. The bullish correction should peak at around 0.382 retracement. Follow the chart analysis posted. Have conviction and don't doubt the trend.
I'll provide future analysis when we hit the targets provided above. The next wave will be a long one but panic selling should commence when we get near the previous lows.
For future updates follow me on twitter as I'm not sure I'll be posting them here.
Follow me on twitter. @starman0112

Short Play Setup for $SPX $ES_F $SPXS $SDS $SPXUBroad market setting up for another leg down after this week's short covering pop and overly bullish sentiment.
See More Videos at www.TheTechnicalTraders.com

US MAJORS COMBINED INDEX PAINT CLEAR PICTUREPrevious significant market top that formed a mini double top and drop looks to be happening again.
Monday we should see another gap down and continued follow-through selling, or at least next week which should create a spike in the vix as shown here: www.thetechnicaltraders.com
