SPX Is Pure RiskAbsolutely insane for people to be saying things like "a new bull market" when it never ended. All of the risk is to the downside. If markets ran another 10% to the upside that gives investors a chance to determine if they want to buy a correction to see new highs or not. But to say that a bull market is coming is the antithesis of thinking when current risk is all downside.
This is risk management 101:
Lets say you have a SP:SPX target of 10,000, would you rather buy it at 6,500 where you know your downside is 7-8% or right here at 6300 with a potential downside of 22%+?
Who in the market is long right now? Everyone because all the short sellers are stopped out, and the dumbest of money the guys who just got promoted to the rank of captain in the branch of hindsight bought the "breakout."
The retracement to the highs has been one of the most hated rallies off of a bounce ever seen and why? Because it required a large amount of vibes and to a degree stupidity to buy where it bounced but it paid off. So if it was borderline stupid to do that, what does it mean to lever up at the top?
The correct method is to either be short here or be patient for a breakout with volume and a successful retest. There you can limit your downside and have nearly unlimited upside if it plays out that way.
Esfutures

ES Futures Play – Long Bias Despite MACD Caution (June 11, 2025)📈 ES Futures Play – Long Bias Despite MACD Caution (June 11, 2025)
Ticker: NYSE:ES | Bias: ✅ Moderately Bullish
Setup Time: Market Open | Confidence: 65%
🔍 AI Model Consensus Breakdown
📍 Price: ~6,027.25
📊 Trend: Above 20-, 50-, and 200-day MAs
📈 RSI: 64.25 – bullish but nearing overbought
📉 MACD: Bearish crossover → possible short-term pullback
📎 Bollinger Band: Price near upper band – may act as resistance
✅ Majority Long Bias (3 of 4 Models Agree)
Grok/xAI, Llama/Meta, Gemini/Google:
• Solid technical structure (higher highs/lows)
• High open interest and positive momentum
• Slight MACD concern, but bullish setup intact
• R:R ≈ 1.5:1 with upside target in 6,100 area
⚠️ Contrarian View – DeepSeek:
• Warns of overextension after a 30-day rally
• Suggests bearish MACD could drive pullback
• Recommends short targeting 5,930
📌 Recommended Trade Setup
🎯 Direction: LONG
📥 Entry: 6,027.25 (at market open)
🛑 Stop Loss: 5,980.00 (below short-term support)
🎯 Take Profit: 6,098.00 (R:R ≈ 1.5:1)
📊 Size: 1 contract
📈 Confidence: 65%
⚠️ Risk Watch
• 📉 MACD crossover = potential short-term weakness
• 🧊 Near upper Bollinger Band = possible resistance
• 💨 Volatility at open can cause whipsaw → manage risk strictly
• 🌐 Monitor news/macro events for any directional shift
📣 Are you taking the NYSE:ES long today or fading it like DeepSeek?
Drop your view ⬇️ | Follow for more AI-powered market setups.

ES Futures Trading Signal - 2025-05-25ES Futures Analysis Summary (2025-05-25)
Comprehensive Summary of Each Model
Grok/xAI Report
Market context: Price $5,875 above 9-, 20-, 21-, 50-day MAs, just under 200-day SMA at $5,804.75; RSI ~59 neutral; price near upper Bollinger Band. Bias: Moderately Bullish, potential breakout above BB. Trade Plan: Long at 5,900; SL 5,840; TP 6,050; 1 contract; confidence 0.65.
Claude/Anthropic Report
Market context: Price above 20/50/200-day SMAs; RSI ~59; MACD histogram slightly negative; healthy pullback within uptrend. Bias: Moderately Bullish. Trade Plan: Long at 5,875; SL 5,825; TP 5,975; 1 contract; confidence 0.68.
Llama/Meta Report
Market context: Price above 20/50-day SMAs, just under 200-day SMA; RSI neutral; BB middle at 5,787.7. Bias: Moderately Bullish. Trade Plan: Long at 5,880; SL 5,810; TP 6,000; 1 contract; confidence 0.65.
Gemini/Google Report
Market context: Price above all key MAs (20/50/200, EMA9/21); RSI neutral; MACD lines above zero but slight bearish cross; recent 24h bounce after 5-day pullback; BB upper at 6,060.7. Bias: Moderately Bullish. Trade Plan: Long at 5,875; SL 5,845; TP 5,935; 1 contract; confidence 0.70.
DeepSeek Report
Market context: Same MAs and indicators, but emphasizes MACD bearish crossover, price rejection at upper BB, recent pullback. Bias: Moderately Bearish near-term. Trade Plan: Short at 5,875; SL 5,925; TP 5,800; 1 contract; confidence 0.65. Areas of Agreement and Disagreement
Agreement:
All models note price trading above short- and medium-term MAs. RSI ~59 (neutral, room to run). BB upper band is resistance; MACD histogram negative. Consensus that recent 5-day pullback is either consolidation (bullish view) or warning sign (bearish view).
Disagreement:
Directional bias: Four models bullish vs. one moderately bearish. Entry levels: range 5,875–5,900. Stop-loss zones: 5,810–5,840. Take-profit zones: 5,935–6,050. Clear Conclusion
Overall Market Direction Consensus: Moderately Bullish Recommended Trade: Long ES futures
Entry Range: 5,870–5,880 (target 5,875) Stop Loss: 5,845 (30-point risk) Take Profit: 5,935 (60-point reward, 2:1 R:R) Position Size: 1 contract (adjust per account risk; ~1% equity) Entry Timing: Market Open Confidence Level: 70%
Key Risks and Considerations:
Short-term bearish MACD crossover may lead to choppy action or minor pullback. Volatility spike at market open can cause slippage. Negative macro or news catalysts can derail technical setup. ES is highly correlated with broader equity futures; cross-asset moves may amplify moves.
TRADE_DETAILS (JSON Format)
{ "instrument": "ES", "direction": "long", "entry_price": 5875.00, "stop_loss": 5845.00, "take_profit": 5935.00, "size": 1, "confidence": 0.70, "entry_timing": "market_open" }
📊 TRADE DETAILS 📊 🎯 Instrument: ES 📈 Direction: LONG 💰 Entry Price: 5875.0 🛑 Stop Loss: 5845.0 🎯 Take Profit: 5935.0 📊 Size: 1 💪 Confidence: 70% ⏰ Entry Timing: market_open
Disclaimer: This newsletter is not trading or investment advice but for general informational purposes only. This newsletter represents my personal opinions based on proprietary research which I am sharing publicly as my personal blog. Futures, stocks, and options trading of any kind involves a lot of risk. No guarantee of any profit whatsoever is made. In fact, you may lose everything you have. So be very careful. I guarantee no profit whatsoever, You assume the entire cost and risk of any trading or investing activities you choose to undertake. You are solely responsible for making your own investment decisions. Owners/authors of this newsletter, its representatives, its principals, its moderators, and its members, are NOT registered as securities broker-dealers or investment advisors either with the U.S. Securities and Exchange Commission, CFTC, or with any other securities/regulatory authority. Consult with a registered investment advisor, broker-dealer, and/or financial advisor. By reading and using this newsletter or any of my publications, you are agreeing to these terms. Any screenshots used here are courtesy of TradingView. I am just an end user with no affiliations with them. Information and quotes shared in this blog can be 100% wrong. Markets are risky and can go to 0 at any time. Furthermore, you will not share or copy any content in this blog as it is the authors' IP. By reading this blog, you accept these terms of conditions and acknowledge I am sharing this blog as my personal trading journal, nothing more.

S&P ES Long setup target 5963.50 / Calls SPY target 596Fibonacci technical analysis : S&P 500 E-mini Futures CME_MINI:ES1! has already found support at the Fib level 78.6% (5623.50) of my Down Fib. Last Daily candle (May 2) has closed above retracement Fib level 78.6%. My Down Fib guides me to look for CME_MINI:ES1! to eventually go up to hit first target at Fib level 127.2% (5963.50).
CME_MINI:ES1! – Target 1 at 127.2% (5963.50), Target 2 at 161.8% (6205.50) and Target 3 at 178.6 (6322.75)
Stop loss slightly below the 61.8% retracement Fib level (5506.25).
Option Traders : My AMEX:SPY chart Down Fib shows price to go up to Target 1 at 127.2% (595.82), Target 2 at 161.8% (620.50) and Target 3 at 178.6 (632.50)
Stop loss slightly below the 61.8% retracement Fib level (549).
Enjoy the trading process and take time to smell the roses🌹

Liberation, Altercation & Boom: US China Trade talks CME_MINI:ES1!
Pointing to our previously written blog post (Liberation, Altercation or Doom) on March 31st. A mix of all scenarios played out.
Global universal tariffs with reciprocal tariffs layered on top. It resulted in a huge sell-off on April 2nd.
After months of tit-for-tat tariffs and growing economic friction, the US and China have agreed to hit pause. In a joint statement that’s given markets some breathing room, both countries announced a 90-day suspension on a large portion of their punitive tariffs—an initial step toward dialing back tensions and restarting dialogue.
Key Tariff Measures from US-China Joint Statement (90-Day Pause)
US Tariff Reductions:
Tariffs on Chinese goods were reduced from 145% to 30% for a 90-day period.
24 percentage points suspended, leaving a 10% base tariff in place.
China Tariff Reductions:
Tariffs on US goods reduced from 125% to 10% for the same 90-day period.
China also suspends 24 percentage points of additional ad valorem duties.
Retains a 10% baseline tariff on US imports.
Non-Tariff Measures: China to suspend or remove all non-tariff countermeasures imposed since April 2.
Includes sanctions on certain US companies.
Lifts export controls on some critical minerals.
Timeline & Commitment:
Both parties agree to implement these actions by May 14.
Commitment to continue trade and economic talks through a new bilateral mechanism.
Talks may be held in alternating locations (US/China) or via third-party venues.
No Agreement On:
Currency policy.
E-commerce “de minimis” exemptions.
Sector-specific tariff frameworks.
Future Key Dates and Timeline:
May - Potential US semiconductor tariffs.
May/June - Potential US pharmaceutical tariffs.
July 8th - 90-day tariff lowering for "worst offenders" expires.
July 14th - US tariffs on Mexican agriculture goes into effect.
August 10th - US-China tariff relief expires.
Was this really mutual or just a game of chicken?
There’s an argument to be made that this is more of a tactical pause than a full reconciliation. With China’s GDP in purchasing power parity terms now surpassing that of the US, and its continued technological advancements across sectors like aerospace, semiconductors, and critical minerals, the balance of economic leverage is shifting. For investors, this isn’t just about tariffs—it’s about the evolving structure of global trade.
Geopolitical undercurrents continue to shape the backdrop. China’s strategic influence in regional security, technology supply chains, and commodity access adds another layer to its negotiating position. Recent developments—such as China's reassertion of dominance in strategic corridors and growing control over key mineral exports—suggest its economic posture is becoming more assertive. This, in turn, has implications for US firms dependent on Chinese inputs or facing retaliatory restrictions.
In short, the 90-day window presents a tactical opportunity, but the structural story remains complex. Investors would be wise to monitor not just tariff updates, but broader shifts in trade alliances, export controls, and supply chain vulnerabilities—especially in sectors like tech, energy, and defense-adjacent industries.
ES Futures:
ES Futures and risk on assets are positive across the board following this announcement.
Key Levels:
Key LVN/ Key LIS: 5861-5837.25
200 Day MA: 5872.99
0.786 Fib Retracement level: 5921.75
0.618 Fib Retracement level: 5688.75
pWkHi: 5741
mCVAL 2025: 5639.75
Expectations for the week ahead:
US CPI and Retail Sales data on the docket this week along with slew of FED speakers.
Scenario 1: Risk on
ES Futures get back above 200-day moving average clearing the key LVN resistance zone and our key LIS, head towards 0.786 Fib retracement level before pulling back and consolidating for the remainder of the week.
Example trade:
Entry: 5861
Stop: 5837
Target: 5921.75
Risk: 96 ticks
Reward: 243 ticks
Risk/Reward ratio: 2.5 R
Scenario 2: Further consolidation
Markets consolidate below the key LVN resistance zone and prior weekly high.
Example Trade:
Entry: 5837
Stop: 5861
Target: 5741
Risk: 96 ticks
Reward: 384 ticks
Risk/Reward ratio: 4 R
Glossary:
VA: Value Area
VPOC: Volume Point of Control
VAL: Value Area Low
C: Composite (used as a prefix: VA, VAL, VAH, VPOC, etc.)
mC: micro Composite (used as a prefix: mCVA, mCVAL, etc.)
LNV: Low Volume Node
LIS: Line in Sand
Important Notes:
These are example trade ideas not intended to be a recommendation to trade, and traders are encouraged to do their own analysis and preparation before entering any positions.
Stop losses are not guaranteed to trigger at specified levels, and actual losses may exceed predetermined stop levels.

Overnight Futures Pop 2.8% on Surprise Tariff TruceYou either woke up to a panic… or to a profit.
This morning, markets are ripping higher - not because of earnings, not because of data - but because two superpowers shook hands over fondue in Switzerland.
If you're feeling blindsided, you probably chased last week’s noise.
If you're feeling calm, you’re probably following the AntiVestor way.
---
SPX Market Briefing
The headlines are loud. So let’s talk facts.
Over the weekend, the United States and China agreed to a 90-day tariff rollback:
US duties drop from 145% to 30%
China drops theirs from 125% to 10%
Both sides now pretending to like each other until mid-August
Markets reacted the only way they know how: with euphoria.
SPX futures are up 2.8%. Nasdaq is flying. The Dow surged more than 900 points premarket.
Here’s what we did:
Nothing reckless. Nothing oversized. Nothing emotional.
The system turned bearish late last week, and we followed it - small, tactical, mechanical. Not a bet. Just a position.
And here’s the kicker:
I still held a few bullish positions from the prior bias. They were so far out-of-the-money, I didn’t even bother closing them.
Guess what?
They’re in profit - and my net exposure is green despite the initial bear swing going underwater.
So while the news makes others overreact, we get to do what we always do:
Let the market come to us.
The real money isn’t made chasing this 2.8% pop.
It’s made waiting for the next confirmed setup.
...and a little good luck always helps ;)
---
Expert Insights:
Mistake: Jumping into emotional gap openings
AntiVestor Fix: Let others panic. Let your system speak.
Gap moves on news tend to retrace or fade - and even if they don't, entering late is a coin toss. Smart traders wait. Pros wait. We wait.
---
Rumour Has It…
Whispers from the Swiss hotel bar claim the entire US-China agreement was sparked when both delegates reached for the same dessert spoon. One espresso and a bottle of Pinot later, tariffs were slashed and SPX gapped 2.8%.
This is entirely made-up satire. Probably!
Breaking scoops courtesy of the Financial Nuts Newswire-because who needs sanity?
Fun Fact
According to CBOE data, Monday gap-ups following geopolitical “resolutions” average a +2.2% open… but only hold those gains 41% of the time by Friday’s close. Which means chasing the open? Not your best trade. Waiting for follow-through? That’s the edge.

Intraday Playbook ES Futures: Trade Setup & Context CME_MINI:ES1!
Big Picture Context
Please see related trade idea.
In this analysis, we refine our intraday levels to identify potential trade setups. We also review recent price action and present a high-probability long trade example that frequently offers favorable risk-reward dynamics when it plays out successfully.
See chart image below reviewing yesterday’s long trade opportunity.
Example Trade Setup: SFP Long
Time frame: 1 hour or 30 mins
• Entry: 5612
• Stop: 5595.50 (below SFP candle)
• Target: 5682 (mCVAH — confluence with recent highs)
• Risk: 66 ticks
• Reward: 280 ticks
• Risk/Reward Ratio: 4.2 R
Note: Past performance is not indicative of future results.
________________________________________
Intraday Market Structure Review
What has the market done?
• ES Futures have rallied and reclaimed a key technical level.
• Currently trading above:
o March 2025 low
o 2025 mid-year level
o Developing Value Area Low (VAL) for the 2025 Volume Profile
What is the market trying to do?
• Recover prior months' losses.
• Price action is climbing steadily, establishing higher lows.
How well is it doing?
• Despite headline risks, ES futures show resilience.
• Price has painted green candles in the full session for the past 10 consecutive days—a strong bullish structure.
________________________________________
What Is More Likely to Happen from Here?
Scenario 1: Pullback and Continuation Higher
A pullback toward the 0.618 Fib retracement and mCVAH confluence could offer another long setup, targeting the April 2nd high. This is further supported by NQ already reclaiming those highs, with ES still lagging but showing strength.
Example Trade Idea:
Time frame: 1 hour or 30 mins
• Entry: 5688
• Stop: 5680
• Target: 5724 (May 2 High)
• Risk: 32 ticks
• Reward: 144 ticks
• Risk/Reward Ratio: 4.5 R
Target may be adjusted if relative volume and delta support strong momentum toward April 2nd highs.
________________________________________
Scenario 2: Further Consolidation
• Sellers push prices back into last week's balance/value area.
• Market consolidates and builds energy for a likely next leg higher.
• No short setup is presented, as current risk and stop placement do not justify initiating short positions.
Important Notes:
• These are example trade ideas not intended to be a recommendation to trade, and traders are encouraged to do their own analysis and preparation before entering any positions.
• Stop losses are not guaranteed to trigger at specified levels, and actual losses may exceed predetermined stop levels.

ES weekly trading plan for May 6 - May 9ES closed bullish last week. I expect the high of previous weekly candle to be taken out. 15M structure is bullish and in discount zone. I expect manipulation in London open on Tuesday, reversal and move to previous week high

ES Futures at a Crossroads: Fed Steady, Market ReadyCME_MINI:ES1!
Recent Market Performance
ES Futures experienced a significant decline of 22.30% from the February 19, 2025 high of 6218.50 to the recent low of 4832 on Monday, April 7th, 2025. This drawdown included a sharp 16.30% sell-off, triggered by the announcement of reciprocal tariffs, marking a decline from the April 2, 2025 high to the April 7th low.
Since forming that low, ES Futures have rebounded impressively—rallying 18.48% into the May 2nd high, retracing well over 50% of the losses. Notably, price action has closely respected Fibonacci retracement levels, as illustrated in the accompanying chart.
Macro Fundamentals
There are several macroeconomic considerations at play:
• Quarterly GDP data appears skewed due to front-loaded imports, evident in the January and February import numbers.
• This week’s March trade balance, imports, and exports data for both the U.S. and China will be crucial. These figures will shed light on how escalating tariff tensions have influenced Q1 business activity.
• The key event this week is the Federal Reserve interest rate decision and FOMC press conference. Of particular interest will be how the Fed’s risk outlook has evolved in light of Trade War 2.0, along with updates to growth and inflation forecasts.
While the Fed is expected to hold rates steady, there are increasing calls from President Trump to cut rates. Although recent soft data has shown signs of deterioration, this has not yet translated into hard data. In fact, April’s Non-Farm Payroll (NFP) report beat expectations, underscoring continued economic resilience.
Key Question: What Comes Next?
Will ES Futures continue to trend higher, reverse lower, or consolidate?
Key Technical Levels
• mCVAL: 5635
• Upper Neutral Zone : 5620 – 5585
• March 2025 Low: 5533.75
• Lower Neutral Zone : 5171.75 – 5150.75
Fibonacci Retracement Levels (2025 High to Low)
• 2025 High: 6218.50
• 0.786 Retracement: 5921.75
• 0.618 Retracement: 5688.75
• 0.5 Level (Mid-Range): 5525.25
• 2025 Low: 4832
Our View
We believe downside risks are currently minimized, barring a new market-moving development—such as a disruptive social media post. Q1 earnings have broadly reflected strength, reducing the probability of further downside in the near term.
Given the current backdrop:
• Positive news could act as a catalyst for higher prices.
• In the absence of significant newsflow, we expect consolidation, followed by a potential resumption of the upward trend.
Scenario 1
A pullback to either the blue support zone near the 0.618 Fibonacci retracement confluence, or a deeper pullback towards the confluence of the 2025 mid-range and March 2025 lows, followed by a continuation higher.
Scenario 2
Seasonality supports consolidation. Historical index behavior at this time of year further aligns with the potential for sideways movement before the next leg higher.

ES Futures: Upcoming Mag 7 Earnings and NFP Report
This week, although there was not much market-moving macro newsflow over the weekend, we are approaching month-end. In addition, several key catalysts are on the horizon, including earnings from the Magnificent 7 and the release of Non-Farm Payrolls (NFP) data, which typically arrives on the first Friday of the month.
The Federal Reserve is currently in its blackout period ahead of the interest rate decision scheduled for May 7th, 2025.
As part of our process, we will be reviewing technical levels and drawing a plan based on current market structure. ES futures are currently trading above the March 2025 lows. A “death cross” — where the 50-day moving average crosses below the 200-day moving average on the daily timeframe — was recently observed. This pattern is commonly touted by analysts as a bear market indicator.
However, in a macro-driven environment, this could potentially be a false signal.
Key Levels:
• mCVAL: 5622
• Upper Neutral Zone: 5620 -5585
• March 2025 Low: 5533.75
• 2022 CVAH: 5384.75
• Lower Neutral Zone: 5171.75 -5150.75
Our scenarios are as follows:
Scenario 1: Range-bound price action
A P-shaped micro composite profile suggests resistance at our neutral zone. It is labeled neutral because the price is trading above the March 2025 lows. However, if the level above acts as resistance, we expect further range-bound price action. Markets may trade below the mCVAL for further price discovery and potentially establish a new short-term range, with the 2024 lows acting as downside support.
Scenario 2: Mag 7 and NFP as bullish catalysts
Four of the Magnificent 7 companies are reporting earnings this week. The Mag 7 collectively represent around one-third of the S&P 500 index by market capitalization. Microsoft and Meta are scheduled to report on Wednesday after the close, while Amazon and Apple report on Thursday after the close.
On Friday, the NFP data will be released. This could serve as a fundamentally net-positive catalyst for U.S. markets, especially in light of recent shocks that have weakened sentiment.
In this scenario, we will be closely watching our neutral zone and mCVAL as potential areas to initiate long trades.
Glossary Index for all technical terms used:
Blue Zones: Neutral zones.
C: Composite (prefix before VAL, VAH, VPOC, VP, AVP)
mC: micro-Composite (prefix before VAL, VAH, VPOC, VP, AVP)
VAL: Value Area Low
VAH: Value Area High
VP: Volume Profile
CME_MINI:ES1!

SP500 what to expect next?As a seasoned trader with over a decade of experience navigating the markets, I’ve been closely monitoring the S&P 500’s current price action. The index is presently confined within a well-defined range, with resistance at 5,528 and support at 5,146, based on recent price behavior. We’ve observed a notable deviation below the lower boundary of this range, which often signals a potential reversal or absorption of liquidity before a move higher.
My analysis suggests the next likely target is the upper boundary of the range at 5,528, coinciding with a weekly Fair Value Gap (FVG) that has yet to be filled. Should the price approach this zone, I anticipate a strong market reaction, potentially driven by aggressive order flow as participants defend or challenge this key level. If the weekly FVG is invalidated—meaning price sweeps through this area without significant rejection—the S&P 500 could be poised to break out and target new all-time highs from its current position.

A Tolled BellThe first bell has rung. A bridge is being paved across the $6000 range.
IF it blows up, it likely won't happen until the bridge is constructed and sentiment improves. Expect a few heartfelt endeavors to shoot above $6,660. Base case is long term crab market.

Paradigm Shift or Panic Selling? ES Futures Weekly PlanCME_MINI:ES1!
Macro Update:
The escalation of reciprocal tariffs and China's countermeasures have sent shockwaves through markets, with widespread selloffs across asset classes, including gold. Fund managers and investors were forced to liquidate positions to cover margin calls. The likelihood of a global recession has surged, with Goldman Sachs raising the probability of a US recession to 45% from 35%. Meanwhile, JPMorgan increased its global and US recession odds to 60%, up from 40%, due to intensifying tariff tensions.
The March 2025 Federal Reserve’s SEP projections suggest slowing growth amid rising inflation concerns, pointing in the right direction. Is this a paradigm shift, or was it already set in motion earlier in the decade? Or is this simply panic selling, with the expectation that US administration policy will soon stabilize markets?
If it is a paradigm shift—as seems more likely based on recent developments—the current environment could prove historic, aligning with Ray Dalio's concepts on the changing world order, debt crises, and how nations go bankrupt.
Investor Confidence: ES futures are currently down over 20%, entering bear market territory for the first time since the 2020 pandemic crash. The big question now is whether we’ll see a relief rally or continued sell-offs with occasional pullbacks, or if markets are establishing a new value range based on auction market principles.
• 2024 YTD mCVAL: 5379.75
• 2022 CVAH: 5376
• March 2025 Low: 5533.75
• August 5th, 2024 Low: 5306.75
• Neutral LVN: 5191.50 - 5156.25
• April 4th, 2025 Low: 5074
• 2024 Yearly Low: 5016.25
• CVPOC 2022: 4610.50
Scenario 1: Further Downside The key downside level for ES Futures is 4610.50, where the most volume has been transacted since 2022. Currently, ES Futures are trading above this level. If the market establishes a value range between 4900 and 4500, further selling with brief pullbacks and consolidation above the 2022 CVPOC seems likely.
Scenario 2: Relief Rally For a rally to take hold, ES Futures faces key resistance levels: the 2024 Low at 5016.25 and the pWeek Low at 5074. If markets sustainably stay above these levels, we could see a rally toward the 2022 CVAH at 5376. However, the sustainability of such a rally remains in question given the mountain of uncertainties ahead.
It is important to note that uncertainty tends to create highly volatile market regimes. Traders should adjust the expected daily range accordingly. A good indicator to measure this is “Daily Average True Range”, many traders also rely on close-to-close standard deviation bands to gauge range on a given trading day. As such, we could see moves of 3% or more in either direction on any day.

ES Futures Weekly Trade Plan & Navigating Turbulent Waters CME_MINI:ES1!
Macro Analogy
The current market landscape and macroeconomic environment can be compared to the dynamics of "sticks and carrots." The market is largely headline-driven, responding to the shifting expectations surrounding the Federal Reserve's stance, political events (such as the ongoing influence of the Trump administration), and sidelined investors who are waiting for a clearer signal on where to allocate capital.
Looking at the market action, the low on March 13th, 2025, could mark a point of sector reallocation. Specifically, the Russell 2000 index is currently leading, with the S&P 500 and Nasdaq trailing behind. This suggests a shift in investor sentiment from large-cap stocks to smaller, potentially more dynamic sectors.
In the backdrop, Federal Reserve speakers scheduled throughout the week may help clarify their position on the evolving macroeconomic situation, notably the persistent risk of stagflation. The challenge for central banks is becoming increasingly apparent: balancing rising inflation, increasing unemployment, and slowing growth while striving to meet their dual mandate of price stability and maximum employment. These pressures are intensifying the difficulty of effective policymaking.
If we liken the US administration to a ship navigating through turbulent waters, the Federal Reserve could be seen as a submarine working behind the scenes to stabilize and support the administration. Chair Jerome Powell, at the controls, is leveraging all available tools to ensure financial stability. Meanwhile, at the helm of the ship is the US President, whose decisions and actions impact the broader economic environment, either calming or exacerbating the turbulence. The new adventures of the Gulf of America have entered uncharted territory.
In this context, last week's actions, slowing the pace of Quantitative Tightening (QT)served as the "carrot," aimed at cushioning the economic pain despite worsening economic forecasts. However, the message that FED sounded was that, due to uncertainty, our forecasts are subject to change. Take them with a pinch of salt.
ES Futures Big Picture:
The ES futures market is currently testing key resistance levels, and this zone will serve as a critical inflection point for both bulls and bears. The next steps will likely hinge on the clarity emerging from both macro events and Fed commentary.
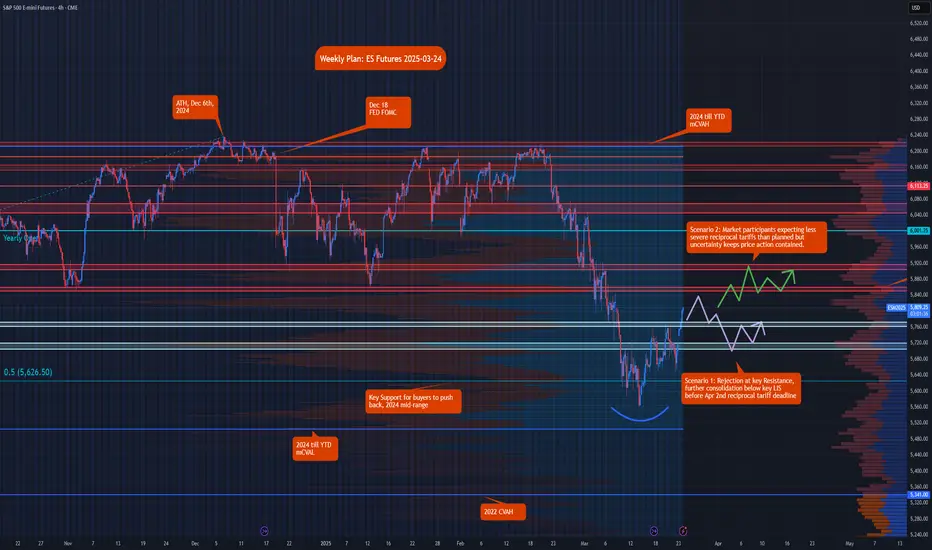
Key Levels to Watch:
• Yearly Open 2025: 6001.25
• Key LIS (Last Important Support/Resistance): 5850–5860
• Low Volume Node (LVN): 5770–5760
• Neutral Zone: 5705–5720
• Key Support Mid-Range 2024: 5626.50
• 2024-YTD mCVAL (Market Composite Value): 5505.25
• 2022 CVAH (Composite Value at High): 5341
Scenario 1: Rejection at Key Resistance
In this scenario, we expect rejection at the key LIS levels, with further consolidation below the 5850–5860 range before the April 2nd reciprocal tariff deadline. This could lead to a retracement back toward the LVN area (5770–5760) and a potential drop to the neutral zone around 5705–5720.
Scenario 2: Market Participants Expecting Less Severe Tariffs
Should market participants anticipate less severe reciprocal tariffs than initially planned, but remain uncertain about the broader macroeconomic picture, we could see the price push above the key LIS levels. This would likely result in a consolidation phase until more clarity emerges, with the market continuing to trade in a volatile range above key LIS.
Recap: Weekly Trade Plan March 10th, 2025CME_MINI:ES1!
In this TradingView blog, we will recap our trade plan posted on March 10th, 2025.
Please note that this is a recap, and since then, we have also published our updated price map and weekly plan for the current week. Today is also the Federal Reserve's decision day.
Here is our updated price map from the weekly plan published on March 10th, 2025:
Our updated price map for ES Futures
Key Levels:
• Important Level to reclaim if no correction: 5795.25 - 5800
• Key LVN: 5738 - 5696
• Mid 2024 range: 5574.50
• Key Support: 5567.25 - 5528.75
• 2024-YTD mCVAL: 5449.25
• 2022 CVAH: 5280.25
It is important to note that when we provide our thoughts and reasoning for the levels we map in our recap, we have the benefit of hindsight. Likewise, when we publish our weekly trading plan and share our thoughts at the start of the week, we are anticipating potential market movements on the hard right edge. This is where randomness and uncertainty are key points.
If we were to rank our process chronologically, this is how we note the importance of each component that makes up our plan.
1. Big Picture
2. Key Levels/Price Map
3. Scenarios
Our big picture is based on how we view the global macroeconomic and geopolitical landscape.
Key levels are mapped utilizing our methodology considering market auction theory and volume profiling. Note how our key level, 'Mid-range 2024', on higher time frame provided support.
At times you may see two scenarios, at other times three. Scenarios are just an anticipation which a trader should adjust should any new information come to light. Although you may note that our scenarios play out mostly from reviewing our blogs. Our aim is to help you create a process for yourself. Note how we anticipated near-mirroring price action for the week, though our reasoning was influenced by higher inflation data. However, the inflation reading came in lower than expected.
Fast forward to today, all eyes are now on the Federal Reserve’s rate decision, SEP, and the FOMC press conference scheduled for later today.

ES Futures Market Outlook & Key LevelsCME_MINI:ES1!
As we discussed in last week’s TradingView blog, the ES futures are currently undergoing a 10% correction. You can access the full context through the link here.
Rollover Notice:
Today marks the rollover of ES futures to the June 2025 contract. The rollover adjustment using Friday’s settlement prices for ESH2025 and ESM2025 is +52.25. To map out the new levels for ESM2025, simply add +52.25 to the levels on ESH2025.
Note: TradingView will roll over the continuous ES1! chart on Tuesday, March 18, 2025.
Key Events This Week: This week, all eyes will be on the FOMC rate decision , FOMC press conference , and the Summary of Economic Projections (SEP ), which includes the Fed’s dot plot, inflation expectations, and growth forecasts for the next two years. This release will set the tone for market movements, at least until the clarity of the looming reciprocal tariffs deadline on April 2, 2025.
Key Levels to Watch:
• Bullish LIS / Yearly Open 2025: 5,949.25
• Key Level to Reclaim: 5,795 - 5,805
• Resistance Zone: 5,704.50 - 5,719.75
• Bearish LIS / Mid Range 2024: 5,574.50
• 2024-YTD mCVAL: 5,449.25
• 2022 CVAH: 5,280.25
Market Scenarios:
Scenario 1: Fed Support ("Fed Put")
The Fed is widely expected to hold rates steady this week. However, markets are forward-looking, so the key focus will be on the updated SEP forecast and the Fed’s press conference. A dovish stance and flexibility to support the US economy, including rate cut expectations moving to the May/June meetings, will drive sentiment. This would imply markets pricing in more rate cuts throughout 2025. The CME Fedwatch tool is a useful resource for tracking Fed fund probabilities and comparing these with the dot plot projections.
Scenario 2: Trade War 2.0
If the Fed remains in a "wait and see" mode, maintaining a restrictive stance while uncertainties surrounding Trade War 2.0 persist, markets may face heightened volatility. The combination of a restrictive Fed policy and geopolitical tensions could act as a double whammy for markets.

Recap ES Futures Weekly PlanCME_MINI:ES1!
In this TradingView blog, we’ll recap the price action and share our insights from the weekly trade plan posted on March 3rd, 2025.
Our Scenario 3 highlighted mounting risks, with weaker economic data reigniting the stagflation theme. While the price action largely aligned with our expectations, it extended further downward than anticipated. Economic data was mixed: PMIs exceeded expectations, while the NFP report came in lower than forecasted. The unemployment rate ticked up to 4.1%, and average hourly earnings data showed mixed results. The Month-over-Month figures were in line with expectations, but Year-over-Year average hourly earnings came in slightly lower at 4% versus the consensus of 4.1%.
In addition, headline news and tariff uncertainties dampened sentiment across the board.
Our approach primarily involves volume profiling and market auction theory to map out price levels and set expectations based on the prevailing market context at the start of each week. However, as fundamentals, macroeconomic factors, geopolitics, and headline news gain increasing significance and impact the market, we draw on our accumulated experience to incorporate these elements into our analysis.
When market regimes shift, technical analysis alone often proves insufficient. A strong understanding of fundamentals, macroeconomic conditions, and geopolitics is crucial to staying aligned with what’s actually happening in the markets, rather than relying on your personal thoughts and assumptions.
Given the myriad factors influencing the economy and markets, traders should recognize that each approach has its merits. We recommend sticking with the strategy that works best for you.

Putting the current pullback from ATHs into context ES FuturesCME_MINI:ES1!
Big Picture:
ATH on December 6th, 2024: 6,184.50
There has been no significant correction or pullback since the ATH.
Currently, the market has pulled back ~8.20% from the ATH.
The previous correction (over a 10% pullback, but less than a 20% downturn) occurred after ES futures hit an all-time high of 5,856 on July 15th, 2024. The market bottomed out on August 5th, 2024.
Currently, ES futures are trading below the 50% retracement level from the ATH on December 6th, 2024, and the swing low on August 5th, 2024, at 5,719.25.
Given the current "risk-off" sentiment, let's review the updated price map for ES Futures.
Key Levels:
Important level to reclaim if no correction: 5,795.25 - 5,800
Key LVN (Low Volume Node): 5,738 - 5,696
Mid 2024 range: 5,574.50
Key Support: 5,567.25 - 5,528.75
2024 YTD mCVAL (Market Composite Value Area Low): 5,449.25
2022 CVAH (Composite Value Area High): 5,280
Key Support: 5,567.25 - 5,528.75
This zone is important in the event of a 10% pullback, which could lead to a bounce thereafter.
On our regular 4-hour time frame, which we use for weekly analysis and preparation, higher lows have been breached, and ES futures are now trading below the lows from November 4th, 2024, January 13th, 2025, and February 28th, 2025.
The probable next downside target is the 50% retracement of the 2024 range, which stands at 5,574.50.
Unless we see a sustained bounce that reclaims the 5,795.25 - 5,800 zone, the key support level at 5,567.25 - 5,528.75 is likely to be tested, aligning with our expected 10% pullback.
Note that a bear market (i.e., a pullback greater than 20%) wouldn't begin until prices drop to around 4,900, which is still about 750 points away from the current price level of 5,650.
Considering all the above, what can we expect this week?
CPI and PPI data are due this week, and the market is currently in "risk-off" mode. This sentiment is exacerbated by Federal Reserve Chairman Powell's comments on needing more data before altering rate path, combined with tariffs complicating the US economy.
What price level might prompt policymakers to adjust their stance?
The Fed’s dual mandate considers both 2% inflation and low unemployment. With the unemployment rate edging above 4% and inflation remaining high, this upcoming inflation reading is critical. We believe this report may trigger volatility not seen in recent months with CPI releases. We have the SEP and FOMC rate decision coming up on March 19th, 2024.
Scenario 1: Soft CPI than expectations
Expecting volatile price action, however, a V-shaped recovery given softer CPI reading. Markets go in wait and see
Scenario 2: Range bound week
In this scenario, we expect a range bound week, with inflation print in line and markets in wait and see mode for FED FOMC announcement.
Scenario 3: High CPI print
With a higher CPI print, FED will be in a difficult position to cut rates. Will this bad news be bad for the market or good? Mounting risks point to further downside if we do not get any pivot on macro level to support the economy.

Weekly plan: ESH2025NYSE:ES FUTURES 3/3/2025
6012>> 6056>>> 6083-93
Weekly pivot: 5970 , Now Trading @ 5957
5919>> 5878>>> 5828
CONTEXT: NYSE:ES closed Friday's session with massive spike to the upside. Now NYSE:ES is back inside the previous balance zone that extends to 214 points range with 6056 for half back, however we need to be cautious since daily chart still is One Time Framing Down (OTFD) which would end if NYSE:ES is able to recapture or trade above 5971, at that point we will need to redraw daily balance zone.
@everyone

Leap Ahead with a Dual Breakout Setup on ES and MESThe Leap Trading Competition: A Chance to Trade S&P 500 Futures
TradingView’s "The Leap" Trading Competition gives traders the opportunity to test their futures trading strategies in a competitive environment. Participants have access to select CME Group futures contracts, including E-mini S&P 500 Futures (ES) and Micro E-mini S&P 500 Futures (MES).
This article presents a dual breakout trade setup, analyzing both bullish and bearish scenarios based on key Fibonacci levels and low volatility price ranges. The goal is to trade the breakout of a well-defined range and target either a Fibonacci extension to the upside or a retracement level to the downside.
Understanding Breakouts and Fibonacci Levels
A breakout occurs when price moves beyond a defined support or resistance level, often leading to a strong trend continuation. In this case, the trading range between 6146.75 and 6121.25 is the key level to watch. A breakout above this range suggests bullish momentum, while a breakout below signals bearish pressure.
Fibonacci retracement levels are used to identify potential support or resistance zones based on past price movements. The 50% retracement level at 5985.75 aligns with a UFO support, making it a key downside target if price breaks lower.
Fibonacci extension levels project potential price targets beyond the most recent high or low. The 100% Fibonacci extension at 6288.75 serves as the projected upside target if price breaks higher.
The Dual Breakout Trade Setup
In a bullish scenario, a breakout above 6146.75 confirms entry to the upside. The target for this trade is the 100% Fibonacci extension at 6288.75. A stop loss is placed below the breakout level at a distance that ensures a minimum 3:1 reward-to-risk ratio.
In a bearish scenario, a breakdown below 6121.25 confirms entry to the downside. The target is the 50% Fibonacci retracement at 5985.75, which aligns with a UFO support zone. A stop loss is placed above the breakdown level, ensuring a minimum 3:1 reward-to-risk ratio.
Risk management considerations include adjusting stop losses based on a trader’s preferred risk-reward ratio. Scaling out at intermediate levels can help manage volatility and secure partial profits.
Contract Specifications and Margin Requirements
E-mini S&P 500 Futures (ES) details:
Full contract specs: ES Contract Specifications – CME Group
Contract size: $50 x S&P 500 Index
Tick size: 0.25 index points ($12.50 per tick)
Margin requirements depend on broker conditions and market volatility – Currently ≈$15,000 per contract.
Micro E-mini S&P 500 Futures (MES) details:
Full contract specs: MES Contract Specifications – CME Group
Contract size: $5 x S&P 500 Index (1/10th of ES)
Tick size: 0.25 index points ($1.25 per tick)
Lower margin requirements make it more accessible for smaller accounts – Currently ≈$1,500 per contract.
Leverage in ES and MES magnifies both potential gains and losses. Traders should consider margin requirements and market conditions when determining position sizes.
Execution and Market Conditions
Before executing a trade, a typical breakout trader would watch price confirm a breakout by sustaining above or below the key levels. Additional confirmation from volume trends and momentum indicators can improve trade accuracy.
If price does not break out, the setup remains invalid. If a false breakout occurs, traders may need to reassess conditions before re-entering.
Conclusion
A dual breakout setup provides both bullish and bearish opportunities depending on price movement. Fibonacci extensions provide upside targets, while retracement levels align with strong support zones for downside moves.
For participants in The Leap Trading Competition, this setup highlights the importance of disciplined execution, confirmation, and structured risk management.
When charting futures, the data provided could be delayed. Traders working with the ticker symbols discussed in this idea may prefer to use CME Group real-time data plan on TradingView: www.tradingview.com - This consideration is particularly important for shorter-term traders, whereas it may be less critical for those focused on longer-term trading strategies.
General Disclaimer:
The trade ideas presented herein are solely for illustrative purposes forming a part of a case study intended to demonstrate key principles in risk management within the context of the specific market scenarios discussed. These ideas are not to be interpreted as investment recommendations or financial advice. They do not endorse or promote any specific trading strategies, financial products, or services. The information provided is based on data believed to be reliable; however, its accuracy or completeness cannot be guaranteed. Trading in financial markets involves risks, including the potential loss of principal. Each individual should conduct their own research and consult with professional financial advisors before making any investment decisions. The author or publisher of this content bears no responsibility for any actions taken based on the information provided or for any resultant financial or other losses.

S&P ES Long setup target 6129 / Calls SPY target 605Fibonacci technical analysis : S&P 500 E-mini Futures CME_MINI:ES1! has already found support at the Fib level 78.6% (6020.50) of my Down Fib. Last Daily candle (Jan 17) has closed above retracement Fib level 78.6%. My Down Fib guides me to look for ES1! to eventually go up to hit first target at Fib level 127.2% (6129.00).
CME_MINI:ES1! – Target 1 at 127.2% (6129.00), Target 2 at 161.8% (6206.00) and Target 3 at 178.6 (6243.50)
Stop loss slightly below the 61.8% retracement Fib level (5983.00).
Option Traders : My SPY AMEX:SPY chart Down Fib shows price to go up to Target 1 at 127.2% (605), Target 2 at 161.8% (613) and Target 3 at 178.6 (616)
Stop loss slightly below the 61.8% retracement Fib level (592).

Behind the Curtain: Key Influencers of S&P 500 Futures Returns1. Introduction
The S&P 500 Futures (ES) represents one of the most actively traded futures contracts globally, serving as a benchmark for U.S. equity markets. Its liquidity and versatility make it a prime choice for traders seeking exposure to market movements. However, the factors driving these movements are far from random. Economic indicators often play a pivotal role in influencing the direction and volatility of S&P 500 Futures.
In this article, we dive into how various economic indicators shape the performance of S&P 500 Futures on daily, weekly, and monthly timeframes. Leveraging machine learning, specifically a Random Forest Regressor, we’ve identified the top drivers of these futures’ returns. The findings offer traders actionable insights to fine-tune their strategies and understand the broader market dynamics.
2. Understanding S&P 500 Futures
Product Specifications:
Tick Size: Each tick represents 0.25 index points, equivalent to $12.50 per tick.
Trading Hours: Nearly 24-hour trading cycle, ensuring liquidity across time zones.
Micro Contracts:
Micro E-mini S&P 500 Futures (MES): Designed for smaller-scale traders with a contract size 1/10th of the standard E-mini contract.
Advantages: Lower initial margin requirements and smaller tick values allow traders to manage positions more flexibly.
Margin Requirements:
Initial and maintenance margins vary based on volatility and market conditions. Currently around $15,500 per contract.
Micro contracts offer significantly lower margin requirements, making them ideal for retail traders or those testing strategies. Currently around $1,550 per contract.
3. Key Economic Indicators Influencing S&P 500 Futures
Daily Impacts:
1. Labor Force Participation Rate:
Reflects the percentage of the working-age population that is employed or actively seeking employment.
A rise in this rate often signals economic optimism, driving equities higher.
2. Building Permits:
Tracks the number of new residential construction permits issued.
A strong rise in permits indicates confidence in the housing market, which can positively
influence broader economic sentiment and equities.
3. Initial Jobless Claims:
A leading indicator of labor market health, providing real-time insights into layoffs.
Weekly fluctuations can significantly impact intraday futures trading.
Weekly Impacts:
1. Corporate Bond Spread (BAA - 10Y):
A measure of credit risk in the economy, reflecting the difference between corporate bond yields and Treasury yields.
Widening spreads often signal economic uncertainty, weighing on equity markets.
2. Velocity of Money (M2):
Represents the rate at which money circulates in the economy.
High velocity can indicate economic expansion, while slowing velocity may suggest stagnation, affecting equity futures trends.
3. Net Exports:
Tracks the balance of a country’s exports and imports.
Positive trends often boost market optimism, whereas persistent deficits can trigger concerns about economic health.
Monthly Impacts:
1. Oil Import Price Index:
Reflects the cost of imported crude oil, which has ripple effects on production costs across industries.
Rising oil import prices may pressure corporate earnings, impacting the broader S&P 500 index.
2. PPI: Processed Foods and Feeds:
Tracks price changes in processed agricultural products, offering insights into supply chain pressures.
Sharp increases can hint at inflationary risks, influencing long-term equity market sentiment.
3. Consumer Sentiment Index:
o Measures consumer confidence, a leading indicator of economic health.
o High sentiment often signals robust consumer spending, which supports equities.
4. Applications for Different Trading Styles
Day Traders:
Focus on daily indicators like Initial Jobless Claims and Labor Force Participation Rate.
Example: A sudden drop in jobless claims could signal short-term economic strength, providing day traders with bullish opportunities.
Swing Traders (Weekly):
Leverage weekly trends like Corporate Bond Spread or Velocity of Money (M2).
Example: A narrowing bond spread might indicate improving business confidence, aligning with medium-term bullish positions.
Position Traders (Monthly):
Use monthly indicators such as Oil Import Price Index and Consumer Sentiment Index to identify macroeconomic trends.
Example: Rising consumer sentiment could indicate a stronger economy, supporting long-term bullish strategies in S&P 500 Futures.
5. Risk Management Through Indicator Analysis
Refining Entry and Exit Points: Use indicator data to align trades with anticipated market shifts. For instance, an uptick in the Oil Import Price Index might signal upcoming headwinds for equities.
Managing Leverage: Understanding the volatility drivers like Treasury Yields can help traders adjust position sizes to manage risk effectively.
Diversification Across Timeframes: Incorporate insights from multiple timeframes to hedge risks. For example, while short-term indicators may suggest volatility, long-term metrics can provide stability signals.
Hedging Strategies: Use correlated assets or options to mitigate downside risks. Combining economic indicator analysis with market seasonality can enhance portfolio resilience.
6. Conclusion
Economic indicators provide invaluable insights into the drivers of S&P 500 Futures, helping traders align their strategies with market trends. Whether focusing on daily volatility from indicators like Initial Jobless Claims or broader monthly trends such as the Consumer Sentiment Index, understanding these relationships can enhance trading decisions.
By leveraging machine learning and data-driven analysis, this article highlights how indicators shape market movements across various timeframes. The insights empower traders to adopt tailored approaches—whether intraday, swing, or long-term—while improving risk management practices.
This framework not only applies to S&P 500 Futures but can also be extended to other markets. Stay tuned for the next article in the "Behind the Curtain" series, where we explore another futures market and its relationship with key economic indicators.
When charting futures, the data provided could be delayed. Traders working with the ticker symbols discussed in this idea may prefer to use CME Group real-time data plan on TradingView: www.tradingview.com - This consideration is particularly important for shorter-term traders, whereas it may be less critical for those focused on longer-term trading strategies.
General Disclaimer:
The trade ideas presented herein are solely for illustrative purposes forming a part of a case study intended to demonstrate key principles in risk management within the context of the specific market scenarios discussed. These ideas are not to be interpreted as investment recommendations or financial advice. They do not endorse or promote any specific trading strategies, financial products, or services. The information provided is based on data believed to be reliable; however, its accuracy or completeness cannot be guaranteed. Trading in financial markets involves risks, including the potential loss of principal. Each individual should conduct their own research and consult with professional financial advisors before making any investment decisions. The author or publisher of this content bears no responsibility for any actions taken based on the information provided or for any resultant financial or other losses.

S&P ES Short setup target 5811 / Put SPY target 574Fibonacci technical analysis : S&P 500 E-mini Futures ( CME_MINI:ES1! ) has already found resistance at the Fib level 78.6% (6057.75) of my Down Fib. Last Daily candle (Jan 7) has closed below retracement Fib level 38.2% (5963.75). My Down Fib guides me to look for CME_MINI:ES1! to eventually go down to hit first target at Fib level -27.2% (5811.50).
S&P CME_MINI:ES1! – Target 1 at 5811.50, Target 2 at -61.8% (5731) and Target 3 at -78.6 (5691.75)
Stop loss slightly above the 50.0% retracement Fib level (5991.25).
Option Traders : My SPY AMEX:SPY chart (Down Fib from 602.48 to 580.50) shows price to go down to Target 1 at -27.2% (574.52), Target 2 at -61.8% (566.92) and Target 3 at -78.6 (563.22)
Stop loss slightly above the 50.0% retracement Fib level (591.50).
