Esfutures

ES AHs updateES broke the uptrend small channel off am lows, good sign there. Its also jumped out its upper bull trend channel, must watch for possible fake out. If it means business for the bulls, I will trade the re-test of the trendline in am.
If you look at the chart, you can see that we hit 1.618 to the penny and the price is hovering right at the extension zone. I say it's a very important place to continue or reject, it seems we hit the wall here imo.
Im swing short here and have no stops at the moment, will be watching for the breakout to hold or fail

ES is sitting at the support zoneES is sitting at the support zone, breaking below will get us down to 3630-60 zone quick.
C&H pattern failed, no good news to the bulls till lower lows next week imo
In case of a H&S pattern, we should see 200 points plus below the neck zone - green support line.
That would get us to my ideal target zone 3500 and 3555-50SPX


When Trends Emerge... Embrace Them!The price of any asset is always the correct price because it is the level where buyers and sellers meet in a transparent environment, the marketplace. A price trend is the most accurate reflection of the market’s sentiment. When buyers are more aggressive, prices rise, and when sellers overwhelm buyers, prices decline.
The stock market trend reversed
The S&P 500 is the leading stock market index
The trend bent
Ride the wave until the technical position changes
Never try to pick a top or bottom; the market’s sentiment will tell you all you need to know
In his 2004 book, The Wisdom of Crowds, author James Surowiecki used case studies to prove that “the many are smarter than the few, and how collective wisdom shapes business, economies, societies, and nations.” A price trend embodies Surowiecki’s work, and that is why the trend is always a trader or investor’s best friend.
When I first began my trading career in the early 1980s, my mentors taught me never to “fight the tape.” They were old-school traders who learned their craft in the days when stock prices were printed on a ticker tape. Fighting the tape is going against the trend.
When the path of least resistance of a market changes from bullish to bearish or vice versa, it is a signal to take profits, losses, and reverse a risk position. The most successful trend-following traders and investors ride trends until they bend, aiming to take the most significant percentage of profits from a bullish or bearish price pattern.
There can be plenty of false signals that lead to choppy results but catching a significant trend and riding it like a surfer rides a wave can be gratifying and highly profitable. The recent price action in the US stock market points to a significant trend change from bullish to bearish.
The stock market trend reversed
After reaching a record high of 4,808.25 on January 4, the March E-Mini S&P 500 futures contract ran out of upside steam, reversed, and has made lower highs and lower lows.
The chart highlights the decline to the most recent low of 4,212.75 on January 24, a 12.4% decline in only twenty days. The futures contract was around the 4,420 level at the end of last week, closer to the recent low than the early January high.
The Fed’s more hawkish approach to monetary policy has weighed on the stock market as stocks compete with bonds for capital. Moreover, the geopolitical landscape has likely caused selling as tensions between the US and Russia have risen to a post-Cold War high.
The S&P 500 is the leading stock market index
The S&P 500 is the most diversified stock market indicator and the bellwether for monitoring the overall equities asset class.
While the recent selloff may appear as another speed bump, a close below the 4,495.12 level on January 31 would put in a bearish key reversal trading pattern on the monthly S&P 500 chart.
A bearish reversal in Bitcoin and Ethereum on November 10 led to a price implosion in the cryptocurrency arena that took prices over 50% lower at the most recent lows last week. The S&P 500 closed more than 60 points below the critical level on January 28.
The trend bent
Trends reflect market sentiment. As we move into 2022’s second month, the stock market looks more than shaky. Higher interest rates, geopolitical problems, COVID-19 variants, rising inflation, supply chain bottlenecks, the potential for rising US corporate and individual tax rates, and other issues have caused selling to emerge in the equities market.
There have been plenty of false signals in the stock market over the years. However, when corrections occur, they can be brutal. The last substantial correction took the S&P 500 from 3,393.52 in February 2020 to a low of 2,191.86 in March 2020 as the worldwide pandemic gripped markets. The 35.4% drop from one month to the next was a reminder that when the trend bends, it is best to follow the sentiment. The cost of trend-following is choppy results when markets display false breakdowns or recoveries. When trends emerge, the profits can more than compensate for short-term losses. The bullish trend in the US stock market bent in early 2022 and is now bearish at the end of January.
Ride the wave until the technical position changes
Trend-following is like surfing. It can take a long time to paddle around through small waves until a substantial one appears on the scene. Surfers look to ride the wave when it arrives.
The S&P 500 has already dropped by over 12% in January, and a bearish reversal at the end of January could cause even more follow-through selling. Daily price volatility has increased, and rallies during a bearish trend can be particularly nasty for those holding short risk positions; thus, the term “rip your face off rally.” The critical factor in trend following is to begin riding the wave early so that you can stomach the ups and downs that naturally occur as the market gyrates between higher and lower prices on an intra-day and even intra-week basis.
Those gyrations can cause the emotional impulses that cause many traders and investors to lose money or minimize profits. For trend-followers with the fortitude to suppress emotions, riding the bullish or bearish wave until it changes direction is the formula that separates winners from losers over time.
Never try to pick a top or bottom; the market’s sentiment will tell you all you need to know
Our emotions want us to be correct, and the emotional impulses are more concerned with calling a direction than profiting from the market. It is virtually impossible to call bottoms or tops in markets consistently, and successful trend-followers tend to be long at the top and short at the bottom. While this may seem counter-intuitive, it is the critical factor for profitability.
Sentiment is a powerful force that often ignores news, expert fundamental analysis, and all other noise that surrounds markets each day. Sentiment creates price trends that indicate the path of least resistance of prices. Picking tops or bottoms denies physics that teaches a body in motion tends to stay in motion. In finance, the trend is your friend until it bends is the same construct.
As of the end of last week, the trend in the stock market was bearish, and we will ride the wave until the market sentiment tells us it is time to ride another in the opposite direction. We are constantly long or short the highly liquid markets we trade, and we may get chopped up when sentiment is confused and provides false signals. However, we are always positioned to participate when the big moves come.
--
Trading advice given in this communication, if any, is based on information taken from trades and statistical services and other sources that we believe are reliable. The author does not guarantee that such information is accurate or complete and it should not be relied upon as such. Trading advice reflects the author’s good faith judgment at a specific time and is subject to change without notice. There is no guarantee that the advice the author provides will result in profitable trades. There is risk of loss in all futures and options trading. Any investment involves substantial risks, including, but not limited to, pricing volatility, inadequate liquidity, and the potential complete loss of principal. This article does not in any way constitute an offer or solicitation of an offer to buy or sell any investment, security, or commodity discussed herein, or any security in any jurisdiction in which such an offer would be unlawful under the securities laws of such jurisdiction.


ES has a bit more clear pathway to the downside could target Target confluence is at 3587ES, very deep but can get there in no time, crazy market!
This will turn today/tomorrow, otherwise cycles are inverted, crazy times!
If anyone is riding the futs, just trail it and keep it rolling on the spikes again and again till it stops working
I will leave it this the way it is.

ES must break the resistance line next resistance is 3710!Should squeeze here an now or we get back to the lows again.
3710 becomes the first maj resistance (held the other day)
The bottoming timing window is today or tomorrow am, very close for a significant relive rally, ideally back to 3900 gap
closing above 3710 today and tomorrow will be a good sign of the temp low being in place!


SPX /ES Volatility 02 June 2022 SPX /ES Volatility 02 June 2022
The current percentile of SPX /ES is around 71.83%.
The current implied volatility is around 26.05 -> which translates into a daily movement of 1.64%
At the same time, this translates in an aproximate +-67$ movement
For this we can assume close to 85% probability of efficiency based on the last years data.
Based on this our channel for today is going to be, assuming the opening price is 4100
TOP 4100 + 65 ~= 4165
BOT 4100 - 65 ~= 4035
This strategy is perfectly suited for an iron condor
At the same for those that are looking for entry points in case they want to go long call/put or a reverse iron condor,
instead of normal iron condor we can make use of next data:
Based on the last years, we can expect that the asset is going to move more than 0.41% which translates into a +- 20$ movements.
And this comes with a 75-80% probability based on the last years.
TOP 4100 + 20 ~= 4120=> as an entry point for long where we can use the opening price as a stop loss
BOT 4100 - 20 ~= 4080 => as an entry point for short where we can use the opening price as a stop loss

ES - Bears are showing up again
Price tried to break the key resistance 4390 today and failed. 4340 was seemed to hold *barely*
below 4330, 4270 is likely to get tested again. this zone has held up thrice since Feb 27, so weak support.
below we go stright to 4200.
still time, but bull case is not so upbeat right now. Be careful adding longs.
countertrade - if 4270 holds, it should be on some news - which should start a squeeze that could push price all the way up to 4450. (ONLY IF)

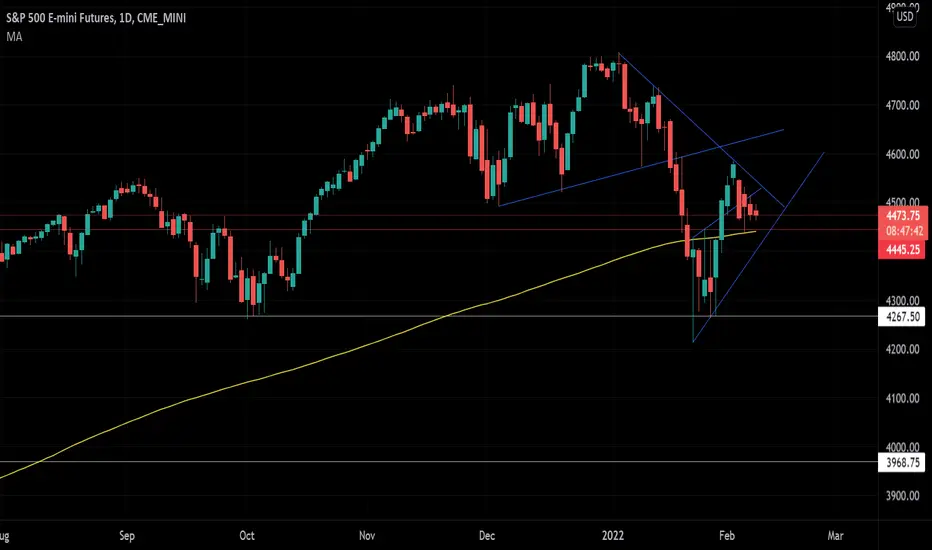
Breaking down where the stock market is goingLooking at the daily chart on the ES futures contract (S&P) Today was a big day with price pulling up and holding the lows form Feb 24.
The market has been on a crazy bull run since March 2009 so seeing this pullback is no surprise really, in fact I am surprised it didn't come earlier. Of course there was the pretty short-term collapse in 2020 but then the strong reversal we see in the chart here.
4800 was the highs and now resistance, along with 4700. You can see on Jan 18th price breaking down from the trendline and really confirming a trend change.
For the bulls it is very important what happened today but we will need to see price taking out the 4300 and 4400 walls for me to be confident that the market is turning bullish again.
Last week we saw a similar move only to see price pullback again. The key though is holding that Feb 24th low.
Let's see if price is above 4300 by the end of this week.

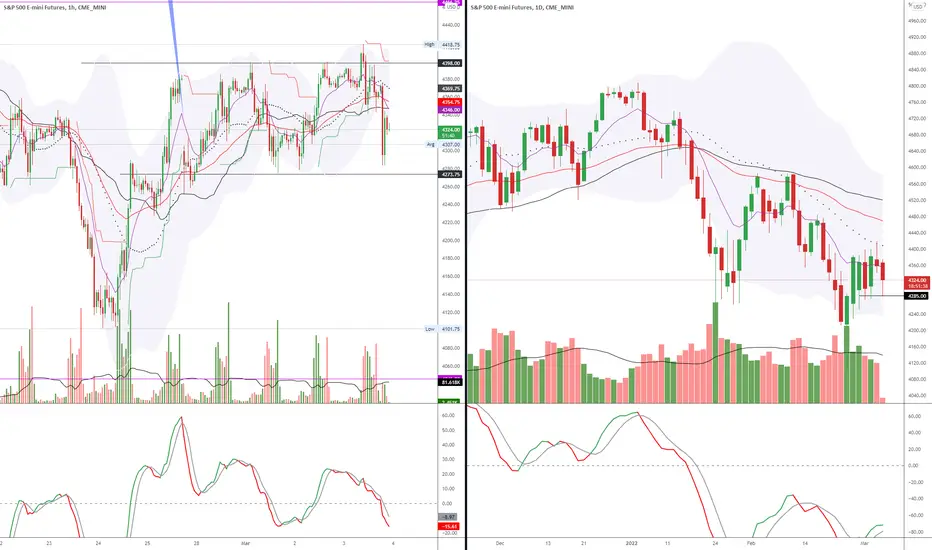
$SPY and $ES_F I try my best to stay away from "call-out" type posts because that's not really what I'm about. That being said, I'm doing one today in conjunction with an educational post because they fit together pretty well.
Note: on the main chart I'm submitting with this, the topmost moving average (where price is resting as I write this) is the 200HMA using daily candles. The bottommost moving average is the 200HMA using monthly candles.
SHORT VERSION
The short version is that I'm looking for a short entry on CME_MINI:ES1! and/or AMEX:SPY .
THE LONG VERSION
In roughly the past 10 years, ES futures and SPY have fallen below the 200HMA on the weekly candle a handful of times. My data plan on TradingView I guess doesn't give me far enough data to show it, but on my other charting platform you can see that as far back as 2011 almost every single time ES has fallen below the 200HMA on the weekly it has been caught by the 200HMA on the monthly. 100% of the time that price has fallen below the 200HMA on the weekly it has resulted in a sustained period of volatility.
Currently, ES has not breached this sufficiently but it looks to be close. What I'm looking for as confirmation before entering is:
the weekly candle for the week of 1/23/2022 opens below the 200HMA on the weekly candle
daily volume on ES has not fallen below 1.2mn (click the related idea for my overview of using volume to help time when the bottom may be in)
If this criteria is met, I'm going short on ES selling short contracts but also buying puts on SPY as well. While you don't want to buy calls as a way to "buy the dip" due to the impact of elevated TVC:VIX after a sell-off, you may want to buy puts if you are expecting a sell-off due to the impact that an exploding VIX will have on your options premiums.
To be clear, I am not calling for some catastrophic market crash. I'm calling for a technical correction to a regularly established baseline that's all.
PT 1 for me would be 4100. PT 2 for me would be 3400. For context 1 contract for CME_MINI:MES1! (the little brother to ES) nets you $5 per point. If I were to enter at 4400 then by PT 1 (if I'm right), that results in $1500/contract excluding fees.
CLARIFYING STATEMENTS
This is a play I'm entering with or without posting this. If you decide to follow along, you're making a conscious decision of your own. If you decide to enter and this fails, you will get no sympathy from me, I will award you no points, and my God have mercy on your soul.

ES: Trend ContinuationHello everyone, I'd like to share with you todays ES trading levels.
As drawn in the chart we can see, that the price broke the structure of an uptrend and set new LL and LH yesterday.
We want go with the flow and are looking for a trend continuation and some cheaper prices.
Please let me know your thoughs and if you like the idea.

SPX (Corrective Structure) Expanding TriangleBullish tilt
1) Correction phase
-Structure: Expanding triangle
2) Fib levels intersecting w bottom trendline
-high probability setup
Alternate analysis - bull flag forming
Key level of 4446 is still holding so we will maintain the bullish-bias till structure is broken.
Personal Opinion
a) Nimble trader and create "what-if" scenario
b) Once an analysis is done, risk management must be in place
c) Patience is key

SPY zone for next two weeks atleast SPY absolute resistance at 473.25 big one
SPY immediate resistance at 458.51
Looks like a Channel starting with 458.51 level as resistance and support at 431.66 and 418.34 for some good period of time
there should be some really good news to break the levels. pardon me if im wrong .
Disclaimer : this is just my analysis formy educational purposes.. not any buy or sell signal

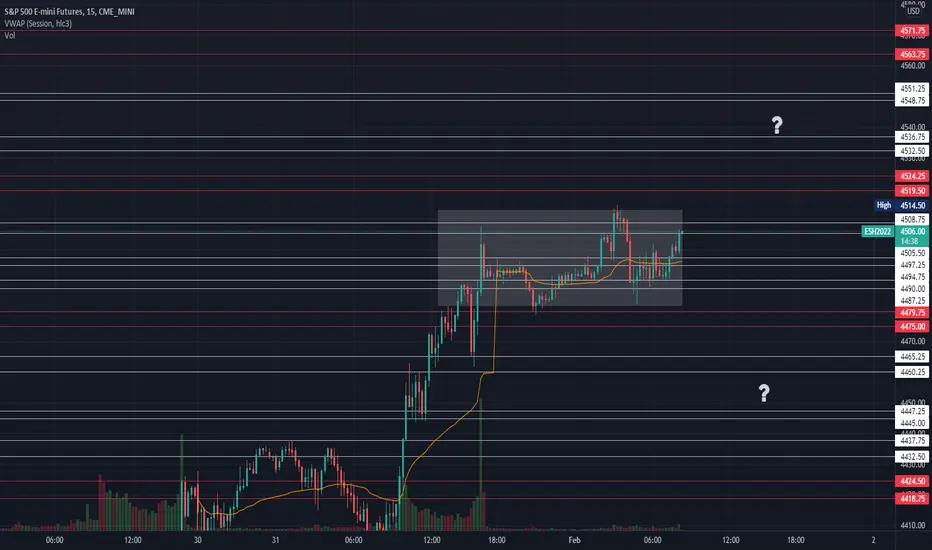
#ES_F 2.04.22 Overview and levels to watch.Globex inventory is short, we have NFP coming up at 830am and where can we go today? Well all the buying that we had from Jan 28th low was short coverings and bigger players selling their position. We failed to extend into previous daily range for now and now have a few options where we can head. On the downside we have 4465.25-4460.25 as our PM support which is broken will be our first sign of weakness, below we have 4447.25-4445, 4437.75-4432.50 and our KEY Intraday support at 4424.50-4418.75, we should see buyers on the first tests of those areas unless we are going down on big volume and if we are then we have 4405.25-4403, 4392.25-4389.75 and 4378.50-4374.75 as our lower levels. On the upside we have 4490-4487.25 as PM resistance we would need to break and hold above to see tests of 4508.75-4505.50 and our Key Intraday resistance at 4524.25-4519 which we need to break above and hold if we want to see the upside to 4536.75-4532.50, 4551.25-4548.75 and 4570 area. Its Friday on a low volume beginning of the month week with big ranges so anything can happen but manage expectations and don't expect huge moves just trade level to level until we see signs of change.

!ES_F 2.02.22 Overview and levels to watchSlow grinding globex action leaves us with inventory 100% long today. What can we see today in RTH? On a bigger time frame we flushed down our inventory over 4620 and now we are almost back to the location of the break down on Jan 18. Question is did we really clean up all that trapped supply in such a short time, have no more supply for sale and clear to go up or will we find a seller today at the levels we did before since not everyone sells at the same time. Our levels to watch for the day are 4570-4562.50 as PM support if we break and hold below that is our first signs of weakness under there we have 4551.25-4548.75, 4536.75-4532.50 and our Key intraday support at 4524.25-4519 which if broken then this whole move was just short covering and we can see more downside. On the upside we have 4589.50-4584.75, 4603.25-4598.75 and our Key resistance at 4623.25-4614.50 we do expect sellers there. We have made some big moves last few weeks and the action has slowed down to a grind so it will be tricky to trade and have to manage expectations. If we do break and hold over our key resistance that would be a bullish confirm and we can see higher levels of 4636.50-4632.25 and 4650.50-4646.25 where we do expect to see sellers.

#ES_F 2.01.22 Overview and levels to watchAfter exciting month end yesterday, what can we see today? Overnight inventory is currently long over the close and over out 4480 level. Today we want to see if we will continue our strength, retest and hold lower levels or find temporary balance? On the down side we have PM support at 4490-4487.25 if we get under and hold, that will be our first sign of weakness. Under we have 4479.75-4475 as our Key support and if broken we can see 4465.25-4460.25, 4447.25-4445, 4437.75-4432.50 and if selling is strong can test 4424.50 area. On the upside, holding above PM support shows strength and can test 4524.25-4519.50 and we can break and hold over that can see 4536.75-4532.50, 4551.25-4548.75 and maybe 4571.75-4563.75 those are the bigger areas to hit on the upside and should see sellers up there. We made some big moves and now waiting to see what this month will bring. Was the buying real or just short covering and we will head lower this month? Lets see what they have for us.