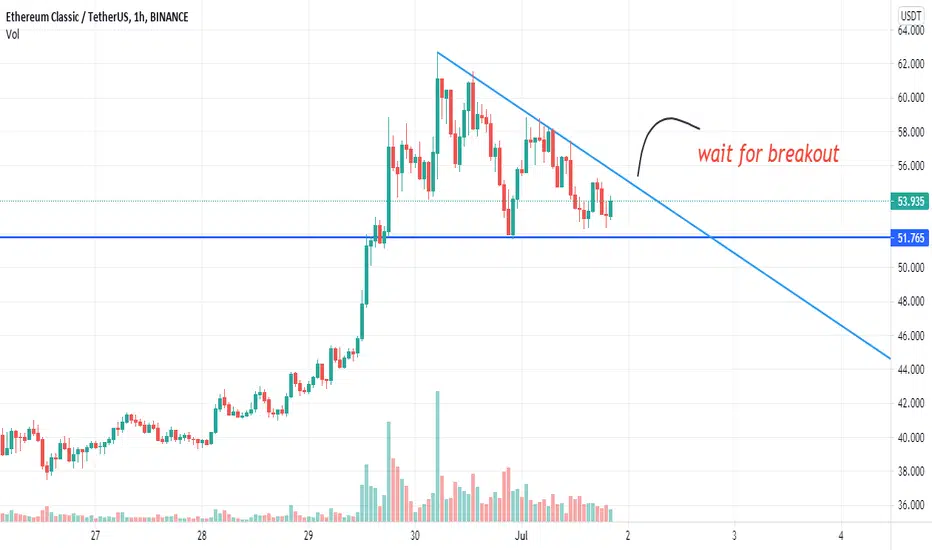
ETCAt one o'clock I see that the classical atrium is in a symmetrical triangle
If it is broken on any side, it will be a trading opportunity
Important
Get help from volume to confirm
Etc


DOGE W/ $1 & $2 FIB PROJECTIONSI created this chart using a fib retracement of DOGE lowest lows to most current highs to give comparison to DOGE with a fib retracement from lowest lows to both $1 and $2. I am self taught when it comes to charts so this could be a wrong way in doing things but given how the fib scale works, i dont see why we cant make charts with potential lines of support ie in this case, if we expect doge to inevitably (hopefully) get to $1, than we should be able to see the potential lines of support and resistance to get it there.

Bull Pennant Formation ETC/USDA bull Pennant is forming around Ethereum Classic to the United States Dollar. If price brakes above this wedge I believe we will have a good run. We had a long slight declined consolidation for a month that finally broke a few days ago, after the retest we are left with this Bull Pennant formation.
What are your thoughts?

ETC: Near-term forecastHi Everyone,
Just to share a near-term forecast for ETC.
I think we've recently completed 4 sub-waves and entering the 5th Elliot Wave currently.
Based on this, I expect the 5th wave to reach at least to 67USD. This corresponds to both the 24% internal Fibonnaci retracement on the higher time frame, and also close to the 61% extension of Wave i-iii.
However, this ignores fundamentals, and the action of the overall crypto market.
Good luck!


$ETC, Testing upper trendline of a potential falling wedge...$ETC
Worth keeping an eye on this asset as its testing upper trendline of a potential falling wedge...
Volume curving up as UCTS is turning bullish on the 1D & lower timeframes..
As potential target, ~75k/85k/97k sats
#ETC

Super BullishETC hourly chart is looking verry tasty. Tightening in wedge formation before another breakout.


BTC TIME UPDATE - THE FIRST COFEE TIME TARGET CONFIRMED! ITS...Hello trading friends,
This is a timely update for BTCUSDT For the targets to goal 36K
Those not did read the before update about the goal 36K target check this below
The first target hit since 33000 update, and it's on confirmation trend for the next coffee time target
The targets to the goal 36k +
-33637 First target ( Hit and re-confirmation on it for the next target)
- 33980 Second Target - on processing
- 34867 3TH Target
- 35285 4TH Target
- 36300 5Th Target
Bitcoin can go into lines and it can show a slow trend or a return trend between entry and R lines.
we know it's not the best time to trade - but when the whale breakout started there will be a large change in the trend than chart prices will move faster than the most did expect with these last 2 days.
Have a great trading time ASIA MARKET. and we are on our market show goal to 36K.
# let's see what this weekend the market will show it can become the increasing weekend for a long time.
If you like the idea follow, and like for more live content. Thank you


💡Don't miss the great buy opportunity in ETCUSD @eth_classicTrading suggestion:
". There is a possibility of temporary retracement to the suggested support line (39.761).
. if so, traders can set orders based on Price Action and expect to reach short-term targets."
Technical analysis:
. ETCUSD is in a range bound, and the beginning of an uptrend is expected.
. The price is above the 21-Day WEMA, which acts as a dynamic support.
. The RSI is at 48.
Take Profits:
TP1= @ 61.246
TP2= @ 71.248
TP3= @ 83.903
TP4= @ 95.690
TP5= @ 114.991
TP6= @ 135.735
TP7= @ 180.043
SL= Break below S2
❤️ If you find this helpful and want more FREE forecasts in TradingView
. . . . . Please show your support back,
. . . . . . . . Hit the 👍 LIKE button,
. . . . . . . . . . Drop some feedback below in the comment!
❤️ Your support is very much 🙏 appreciated!❤️
💎 Want us to help you become a better Forex / Crypto trader?
Now, It's your turn!
Be sure to leave a comment; let us know how you see this opportunity and forecast.
Trade well, ❤️
ForecastCity English Support Team ❤️

Ethereum Classic (ETC) | The Lone RunnerHi friends, hope you are well and welcome to the new update on Ethereum Classic (ETC).
More than 1300% huge rally:
On 21st March I shared an idea when the price action of Ethereum classic completed the formation of a bullish BAT against the Bitcoin and entered in the potential reversal zone of this harmonic bullish reversal pattern. Finally, the priceline started a move towards the upside surged more than 1300% that was a huge rally.
A huge rejection:
After this powerful rally the priceline of ETC reached $180. The price action found the resistance at $140 because here we have several touchpoints. After being rejected by this level the price action moved down and broke down the $50 support level. Recently the priceline has again broken out the $50 resistance that was previously breaking the support and moving between the $50 and $60 support and resistance levels.
The SMAs.
While the price action found that support at 50 dollars, at the same time the price action went very close to the 200 simple moving average on the daily time frame. From here it moved towards the upside and broke out the 100 simple moving average again. At the moment the priceline of Ethereum classic coin is moving between the 50 and 100 simple moving averages. The 50 simple moving average is also working as a strong resistance for the price action. At this time it is very important for the Ethereum classic to save the supports of 100 simple moving average and the $50 at the same time.
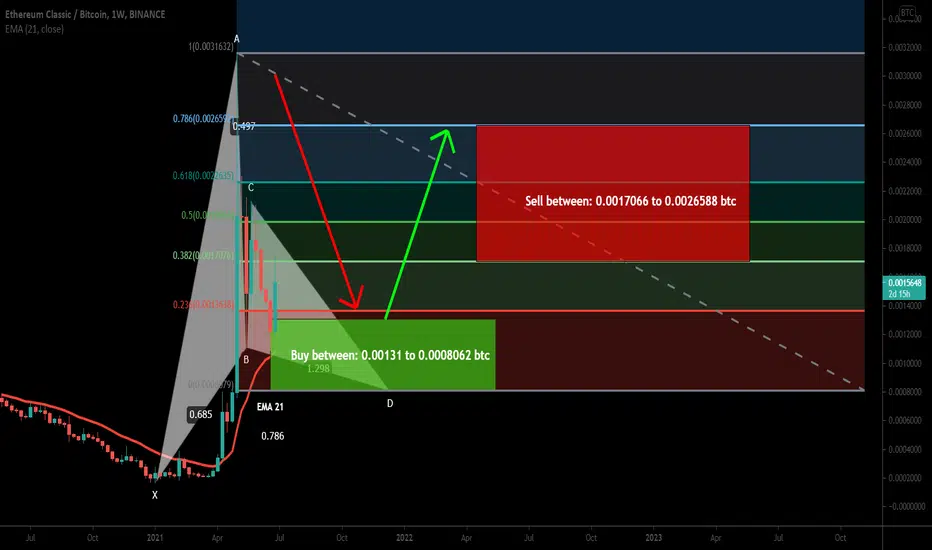
Another bullish harmonic reversal pattern formed:
This time on the weekly time frame chart, the price action has formed the final leg of the bullish Gartley pattern. There is also an exponential moving average 21 support in the buying zone. I share this pattern a few days back on 27th June. So far the price action has surged more than 90% after hitting the weekly 21 exponential moving average support. This time the price action of Ethereum classic can surge more. Because the previous pattern was formed on the daily time frame whereas this has been formed on the weekly time frame. Therefore, we can expect a bigger move in the long term.
Conclusion:
On the weekly time frame chart the Bitcoin has broken down the EMA 21 whereas the Ethereum classic is still having good support of 21 exponential moving average on the weekly time frame and it has also formed a bullish harmonic reversal pattern. Therefore, there is strong chance that in the long-term the ETC will surge more against the BTC in the Bitcoin market like it did previously.
ETC still strongDespite BTC movements, ETC has held good during this bloodbath. Expecting to see a bounce around ~$50.


The ascent is on the way "ETC" BINANCE:ETCUSDT
Looking at the diagram, we see the formation of this harmonic pattern.
If supported in the PRZ area, you can open a buy position
Tip 1: Be sure to check Price Action in the support area
Tip 2: Stick to the loss and profit margins
Third point: the responsibility of buying and selling is with you, this is only my personal opinion
BEDON FILTER

The ascent is on the way "ETC" BINANCE:ETCUSDT
Looking at the diagram, we see the formation of this harmonic pattern.
If supported in the PRZ area, you can open a buy position
Tip 1: Be sure to check Price Action in the support area
Tip 2: Stick to the loss and profit margins
Third point: the responsibility of buying and selling is with you, this is only my personal opinion
BY FILTER


etcusdt price predicition breakout timeetcusdt making breakout pattern lets see where go price upside yeah downside
NOTE:- etcusdt is very bullish
Ethereum Classic - ETC - Looks ready to push to $75!Ethereum Classic - ETC - Looks ready to push to $75! Is ETC ready to BUST or Break? We will see?

ETC/USDT 15min Futures As you see it has broken the triangle , in addition to the BTC in a bearish trend ! so you can take short it at 56-58 in 10-20 lev ;)
Entry : 56-58
Targets : 54 , 52.7 , 50
Stop : 61.1
Good luck and be profitable ❤️
follow me on another social media ;)
