Etc

Ethereum Classic has a lot of firepower left| Long term viewIf you find the analysis useful, please like and share our ideas with the community. Any feedback and suggestions would help in further improving the analysis!
Quick glance: As of now, ETCUSD is on a steady rise. It is currently leading the rise among most other Altcoins. ETH had a good rally the past two days and has now cooled off. However, its not so distant cousin ETCUSD, or Ethereum Classic, seems to be going steady at the moment.
Market in the last 24hrs
ETC can be seen to be entering a consolidation. Such a consolidation is quite expected after such a fantastic rally over the past four days.
Today’s Trend analysis
We are likely to witness some selloff going forward in the short term. As the buying frenzy subsides, ETCUSD will reach a lower price point than current levels.
However, on a longer term horizon, the potential to go much higher above current levels exist.
Price volatility remained high at approximately 13.64%, with the day's range between $62.84 — $55.296.
Price at the time of publishing: $58.64
ETC's market cap: $6.83 Billion
Out of 11 Oscillator indicators, 5 are neutral,1 is bullish, and 5 are bearish .
Out of 15 Moving average indicators, 13 are bullish, 1 is bearish and 1 is neutral .
Indicator summary is giving a 'BUY' signal on ETCUSD .
Volumes have remained high in the past 24 hours.
----------------------------------------------------------------------------------------
The analysis is based on signals from 26 technical indicators, out of which 15 are moving averages and the remaining 11 are oscillators. These indicator values are calculated using 4Hr candles.
Note: Above analysis would hold true if we do not encounter a sudden jump in trade volume .
----------------------------------------------------------------------------------------
Keep supporting:)
-Mudrex

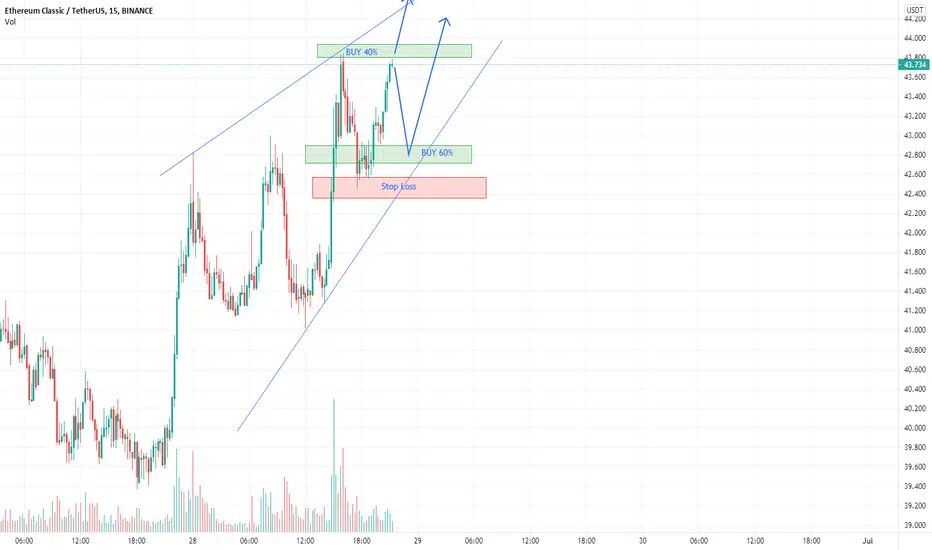
Etherereum Classic Price Prediction:ETC-Major bullish breakoutThe Ethereum Classic price has exploded higher by almost 50% in 24 hours. As a result, ETC's technicals have swung from bearish to positively delightful.
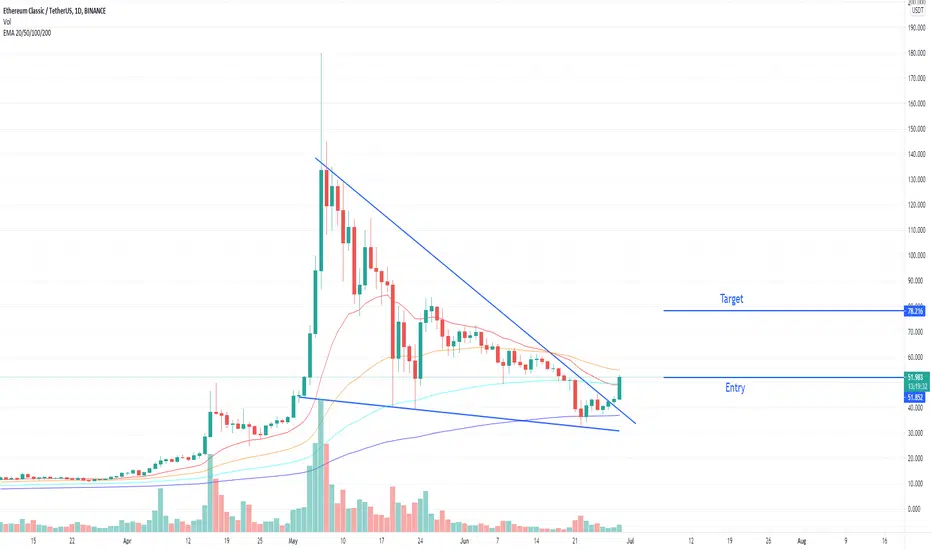
Not only has, a double-bottom formed, the 50, 100, and 200-day moving averages have been left for dust.
Furthermore, the impulse move higher has cleared the resistance of a strong downtrend. Additionally the Ethereum classic price has regained it long-term uptrend.
As long as ETC sustains the $53.40 level, it should easily achieve 45% from here.
TP target: $84.00
SL: tight, and below $53.40 on a daly close basis

ETC Correction SignalETC was successfully hit 63$ and has been new resistance, now etc will correction down to 58$ or more

ETC Breakout Hardfork News plus this long term breakout pushed ETC 30%
I took 50% at the red line and now its pumping as i type this what is even happening right now


ETC Long SignalIf hit resistan etc will up, and if not etc will back to 40$(strong buy) and make double bottom then go up to 60$
ETC/USDT LIMIT BUY SIGNALAt this point it looks like a beginning of a trend reversal, although it might also be a short term upside swing. Lets see

Ethereum Classic formed big Gartley for upto 229% bullilsh moveHi friends, hope you are well and welcome to the new update on Ethereum Classic (ETC) with BTC pair.
Previously we had a nice trade of ETC with BTC pair:
Now the weekly time frame chart, the price action has formed the final leg of the bullish Gartley pattern. There is also an exponential moving average 21 support in the buying zone.
Buy and sell targets:
Buy between: 0.00131 to 0.0008062 btc
Sell between: 0.0017066 to 0.0026588 btc
Stop loss:
The maximum extent of potential reversal zone 0.0026588 btc can be used as stop loss. Or to minimize the risk we can use the EMA 21 weekly as our stop loss.
Possible profit and loss ratio:
As per the above targets, this trade has a big profit possibility of 229%, and the high loss possibility is 39% and in case we use the weekly EMA 21 as stop-loss then the loss possibility is up to 16%.
Note: Above idea is for educational purpose only. It is advised to diversify and strictly follow the stop loss, and don't get stuck with trade.

Ethereum Classic - Should see a push into the $50 range?Ethereum Classic - ETC - Should see a push into the $50 range?

ETC/usdtetc is in a triangle just like most of the alt coins i think its gonna fall
share you're toughts on this one
-- dont take it as financial advice im still learning and i can't predict the future no one can!! --

TIME FOR BUY BTC, IT HAS THE BOTTOM NOWWAIT FOR BUYING BTC AT 2 LEVEL: 33K AND 31K NOW EVERYONE.
IT'S GOOD NOW.
TARGET: 40K-41K


Very Important Candle For ETC (Ethereum Classic)ETC find itself at a critical level of previous strong reistance turned key support and with the current candle dropping below will need BTC to bottom and spring to close this candle above and test the 100 day MA. A break above these two levels would mean a great trade entry.

ETCUSDT parallel channel#ETCUSDT
here is a strong support zone.
$ETC will drop to $39.8, and if bears success to break it down it will touch $34

A BTC Dump will bring ETC hereFibs, EMAs, MAs, Oversold target, Elliot wave all lead to a target of $13-$13.3.
Very Bloody.

Bears are Winning this MatchNobody with capital wants bitcoin anymore.
retail jumping in front of a high speed train, thinking theyre grabbing dips.
looks like the sub $20,000 calls you saw a few weeks ago had it correct.
Risk Tolerance is off the table, now that inflation and tapering are part of the MSM narrative

BUY EOS. TIME FOR BUYING IT NOW#EOS:
ENTRY: 5.10 - 5.19
TARGET: 5.4 - 5.8 6.3
Stoploss: 4.89
CHART OF EOS IS SO BEAUTIFUL NOW. TIME FOR BUYING IT EVERYONE.


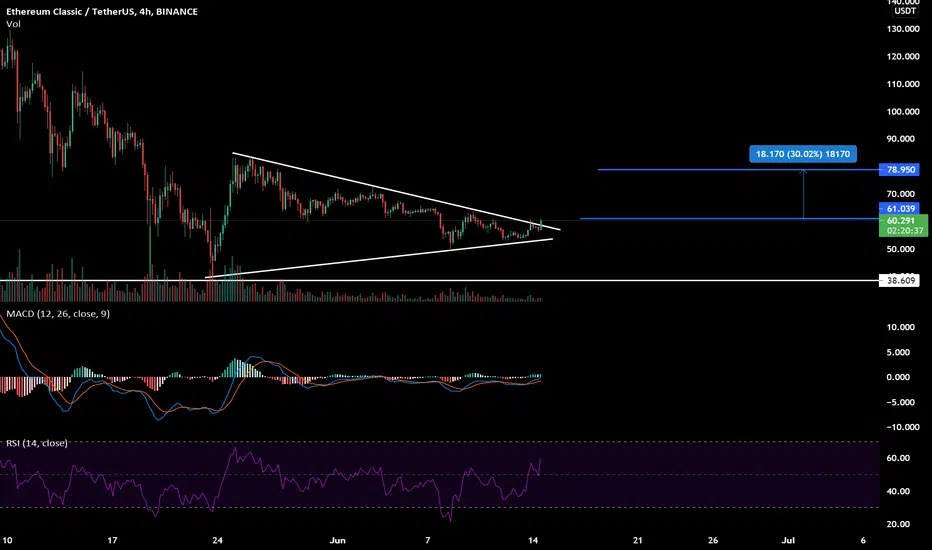
Will ETC hit 90$ in the next big breakout?!Here's a quick look at ETC 4 hr chart. As we can see, the price is still in the falling channel, and depending on what BTC does we will see a move soon. The best entry would be, when the price breaks above the breakout level with good amount of volume.
The idea is: Buy the breakout from the level shown in the chart and take profits at the levels shown in the chart.
Targets:
1. 75.6$
2. 80$
3. 90$
- Profits can also be taken in the resistance zone .
Follow me for daily profitable trading setups
BTC dictates the market. If BTC falls, then Alts will fall as well. Trade safe!

