Ethereum Classic (ETC) Bearish Divergence, drop likely.ETC has been on my watchlist for a while, and recently closed my position in anticipation for the sell-off after a 2.4% gain.
Trade can be found here
Due to the bearish divergence on the RSI, it is very possible ETC will drop, so this could be a good short position.
How to trade:
Buy in: On or above the white trendline
Sell Target
Around 2169 if this idea plays out like last time.
if we break above, this will be invalidated and a long position might be a good idea. I think it's going to drop, however.
Thanks for viewing! Please leave any comments in the section below. I will respond to all of them.
Etcbtc

ETC Potential retracementTimeframe: 240M
Main Scenario: While only 3 of the top 100 cryptocurrencies are positive today against the Dollar, the ETC is included also losing -2.40%. On the other side, its behavior against the BTC is very positive in the last few hours, gaining 3% just today in a buying pressure that comes from yesterday and that became solid after crossing the Central Pivot Point: at this moment the price moves over the Pivot R1 in 2162 satoshis and still strong despite showing its indicators in the overbought area; the sellers are ready to press but this may not happen until the Pivot S2 resistance is reached, which is very close to the EMA-100, this will very likely be a strong joint resistance to avoid further increases. We could try for a short position if the price manages to touch the Pivot R2 even below at 2180 Satoshis where the price can bounce looking for a correction.
Alternative Scenario: It is the least likely and it could be that the price will continue to rise to go through EMA-100 and continue in the range very close to this point.
Entry/Stop Loss/ Take Profit: We can go short if the price reaches the 2180-2198 Satoshis.
T1 = 0.002143 (2.1 %)
T1 = 0.002091 (5.0 %)
The Stop Loss can be placed at 0.002212 (-1.0%)
Duration: 1-3 Days
Consolidation/Ratification level: If the price crosses the first target, you can drag the stop loss to the entry point.
Warning Level: A range behaviour during the next 24.H around the Pivot R1 will invalidate this setup,
Risk Management: Risk/Reward Ratio: 4.45

ETC on its way upHello everyone. If you are looking for a coin that has some really good uptrend days ahead ETC is the one. It has formed parallel channel, hit the bottom at 236 fibonacci level and now heading up. Find yourself a good buy zone and jump in. There will be many swings on its way up so it is a good chance to ean money sticking to one chart. Good trades to you all!
Just as an idea, possible nearest Support/Resistance levels are at 2190, 2270 and 2340. These will be profit targets and support zones for SLs in future.
P.S. Push "agree" if you are or please let me know why you dissagree. It will be educational both for me and others considering this trade ;)

coinbase will pump this 5th than dump hard leaving allcoinbase users FUCKED like BCH.... Smart investors understand united states holds over 20 percent of the capitol.... coinbase is insured in the u.s.…. you should already have accumulated all added coins. have your price preditcions ready and know where you are at and where you are going

ETHEREUM CLASSIC MOVING IN ASCENDING CHANNEL!Ethereum Classic moving in Ascending channel. Looking sweet to take in some long positions. I was about to post this last night, but got occupied in some important work. Since, then the price has appreciated by 6%.
The Risk/Reward ratio for this trade is: 4.61, it it manages to test the resistance line again.!
For those who don't know how to trade parallel channel, read on!
HOW TO TRADE ASCENDING CHANNEL:
1/ Support and Resistance: A long position can be opened when a stock's price reaches the ascending channel’s lower trendline and exit the trade when price nears the upper channel.
2/ A stop-loss order should be placed slightly below the lower trendline to prevent losses if the security’s price abruptly reverses. Traders who use this strategy should ensure there is enough distance between the pattern’s parallel lines to set an adequate risk/reward ratio.
3/ Breakouts: Traders could buy a stock when it’s price breaks above the upper channel line of an ascending channel.
4/ Breakdowns: Before traders take a short position when price breaks below the lower channel line of an ascending channel, they should look for other signs that show weakness in the pattern. Price failing to reach the upper trendline frequently is one such warning sign.
5/ For those who don't have any knowledge about support and resistance, refer to this:
(I can post the chart with in depth analysis using indicators if people need it, but as for now, this should suffice.)
P.S: This is not an investment advice. This is for learning purposes only. This is my personal journal. Invest your capital at your own risk.
Keep an eye out. Trade safely. Always remember, money not lost is also a profit.
Good luck trading.!
Peace.

Ethereum Classic VS Bitcoin CorrectionEthereum Classic found the bottom at btc 0.002, that has been reached on the 24th of July. Price then went up and today broke above the descending channel, which could be the first signal of an upcoming corrective wave up.
ETC/BTC might increase towards the strong resistance near btc 0.00245 area, which is 61.8% Fibonacci retracement level. At the same time this is the level of the ascending channel breakout and where previous support has been established.
On a downside, the consolidation is possible and even spike below the recent low. But only daily break and close could invalidate the correction upwards, while the downtrend is likely to continue at that stage.

Ethereum Classic (ETC) 1 day chart: Bear divergence $ETC has outperformed other alts through the recent bear market, following its own path. Its time to catch up in my opinion and the bearish divergences on the RSI and CMF encourage this feeling.
The orange fibs are from Dec 17 low to early 18 highs - the blue is all time low to high (on Bittrex) - both seem to be getting respect and the shorter term 0.78 is very close to the longer 0.88.
This may normally signal strong support immediately below but its been fully breached twice in the last 3 months although recovered. I am watching the trendline drawn on 2-day.
OBV shows lots of holders which could give fuel to panic selling, but also limit supply. Target areas illustrated - its a basic plan. No shorts just buy areas.

ETC gon MOON, BUY NOWAccumulate ETC below 2050
Targets
2200 | 2386 | 2637+
also use fibs to sell/buy
Stoploss
1940 | 1855
Rumor going around it might be listed to coinbase tomorrow, "scheduled maintenance" platform will be down for an hour. Buy just in case!! and the coin looks good anyways for a buy

ETC is about to breakout and performPerfect combination of multiple indicators and event.
I will follow-up the ETC evolution here. Stay tuned.

Still Accumulating ETCConsolidating nicely. We have some intraday divergence and it's just looking oversold versus BTC. We have a little bull flag forming within larger bull flag, its probably about to go, have bags packed because looking at ADX this thing is going to tear out of here.

ETCBTC 24.7 Update New SLNew Stop Loss on 0.002107
What are your positions? Share with us in a comment!


ETCBTC 21.7 Update New SLNew Stop Loss on 0.002240
What are your positions? Share with us in a comment!


ETCBTC oversold, going long, no stop loss (don't do this).ETCBTC has been my most favored altcoin to swing trade. Not only is it offering some nice gains on these s/r levels, but if I were to consider hodling anything as a mid to long term investment, ETC is number 1 on top of my list. I dont even bother with stop losses with this coin (not financial advice). Gaining a position when it takes a dive like this is a bonus. Dont forget trading is risky and these things can go either way on you no matter how good your TA. I highly recommend implementing a good risk management strategy (this bit is financial advice).

ETCBTC 18.7 Update New SLNew Stop Loss on 0.002437
What are your positions? Share with us in a comment!

ETC/BTC 18.7 Update New SLNew Stop Loss 0.002614 on break even
What are your positions? Share with us in a comment!

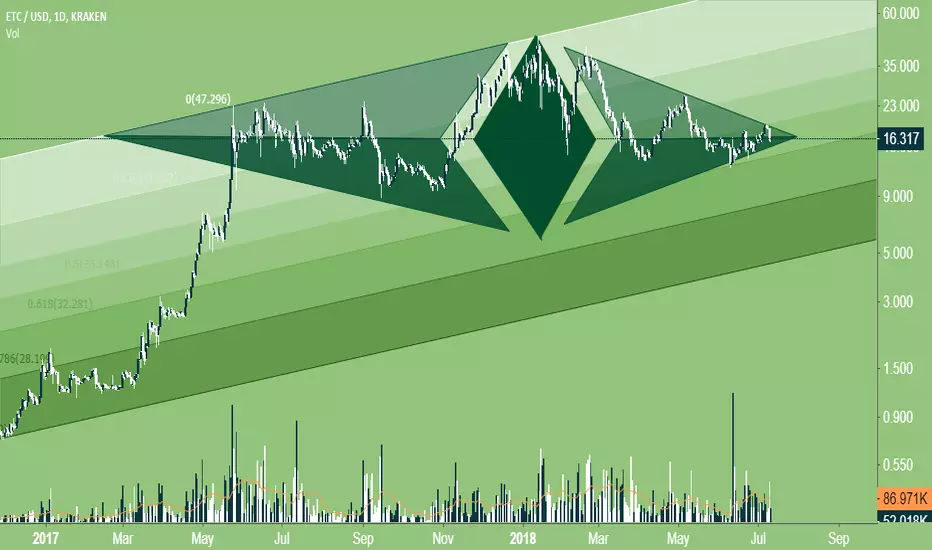
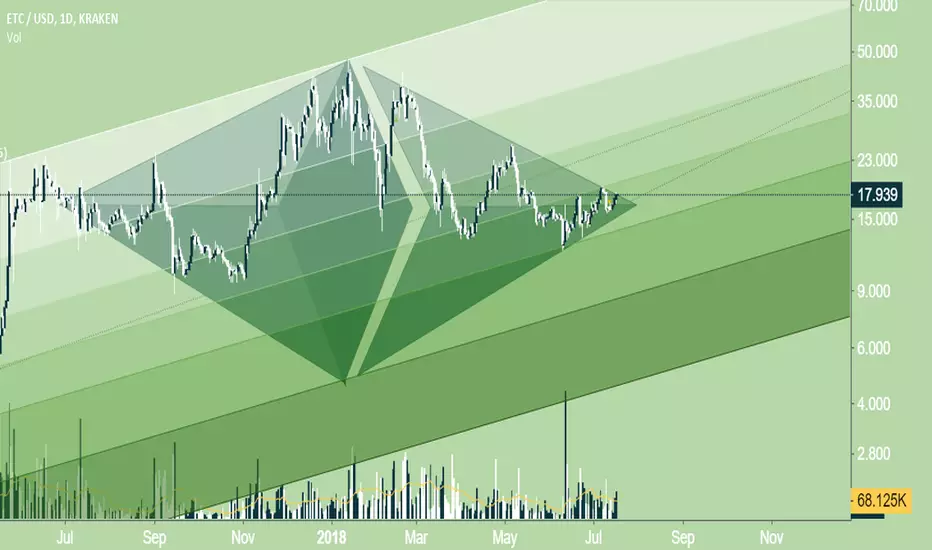
ETC Diamond Storm Is Coming For Ethereum classic
watch for break out above 18$
50 Likes to get updated
$ETC/#ETC Short-Term Bounce LongETC looking good here for a short term bounce back into the bollinger bands. We are on the outside of the 1 hour bands with a low stoch rsi and rsi. We haven't had a bull t3 cycle in a while and I am scaling into this trade around .00256 down to .00251. We also have some support from the former ascending triangle resistance.

ETC breaks necklineHellooo traders & friends,
just as anticipated on Friday's idea, we have broken the neckline at 16.8 with more than 3% profit potential.
But beware: It is not likely that we'll shoot to $19 immediately now & break it, since we have the resistance at $18 coming up first. Bulls can use the 4H Higher Lows established at 16.5 as their stop-loss, as a retest of the break-out zone is still possible.
=> Essentially, ETC's move will highly depend on big brother Bitcoin's showdown this week at the 6.800 Dollar range.
In the direct correleation ETC/BTC, we're at the important level of 0.0026 -nicely surfing the 4H EMA 12 & 26 to the upside- it will be essential for the ETC bulls to uphold this area.
If you don't want to miss trend reversals & neckline breaks the next time, please like & subscribe, and watch my daily videos! ;) I wish you a wonderful start into the week & good trading!
About myself: Global citizen & early Bitcoin adopter from Germany. I invested in the 2nd rally from 50 to 1.000 Dollars in BTC.

Ethereum Classic LOGOJust watch how perfectly is matched with the logo
Look at the left diamond part
at the middle
At the right
so what to expect ?
100 Likes to get updated if the idea is valid