ETC/USDT - Potential 67% setup! Hello, Traders!
After a long consolidation lasting for 9 months, the asset exits the main trading range of $4.78-7.66
ETC is above the MA100 on the daily timeframe and the RSI indicator moved into the bullish area
We may look for an entry in the range of $7.45-$7.75
Place the SL at $6.55
Target price levels will be:
$9.51
$11.30
$12.80
Good luck and watch out for the market.
P.S. This is not a piece of financial advice but a trade I would be following myself
Etclong

ETC vs USDT --- LONG --- 16.01.21buy when the local dynamic resistance will be broken
SL below the local low (Split into 2 parts)
Targets the red lines on the chart

ETCUSD (Waiting for the resistance zone break out in a day char)#ETCUSDT(Weekly chart) Technical Analysis Update
Waiting for the resistance zone break out in a day chart
ETC/USDT currently trading at $7.66
Long Entry: Above $8.00
STOP LOSS: I will update once I see the breakout
Resistance level 1 (Target 1):$9.84
Resistance level 1 (Target 2): $12.90
Max leverage: 3X
ALWAYS KEEP STOP LOSS...
Follow our Tradingview Account for more Technical Analysis Update, | Like, Share and Comment your thoughts.

ETC AFTER A LONG TERM FALLING WEDGE BREAK UPGETTING READY!
ETC broke up from a long term falling wegde pattern. Accumulated so hard since 1 year since.. MY expectations are so big..
ETC Looking BullishHi Guys
Another big cap project is ETC which was dumping from Feb 2020, so rightnow here is looking bullish and many things are here which are indicates that we can take long position from here.
The first is on 4hr chart we can see IHS pattern and also double bottom and the SL will be 0.0003050 if 4hr close below is this level.
Short term trader also can take long position from it level. TP will be 0.000405


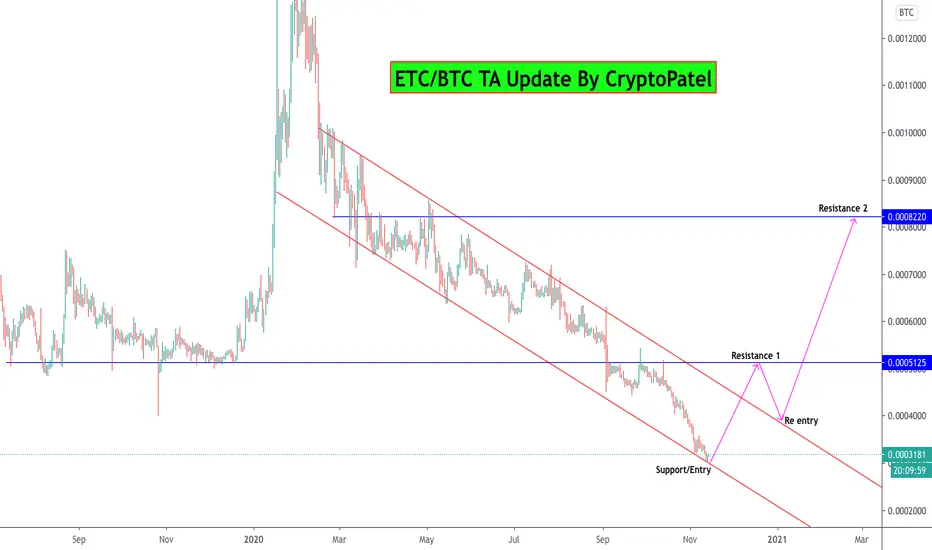
ETC/BTC Bullish Chart and Is it Good Time to enter..?#ETC/BTC TA Update :-
#ETC after breakdown it dumped almost -50%
Bow again good time to enter in this trade.
Now trading at support level.
Entry:- 3000-3200 Satoshi
Targets :- 5125/8220 Satoshi
Stop loss:- 2990 Satoshi
Support :- 3000 Satoshi
Resistance :- 5125/8220 Satoshi
Please Click LIKE button and Appreciate my hard work.
Must follow me for latest crypto real time updates.
Thank you.
ETCUSDTBig resistence @6$
If it breaks it and confirm it, then I will place TP from 6.9$-7.5$
Expect price to bounce bcs mitigation of cards and asics from december.
Buy the rumor, sell the news!


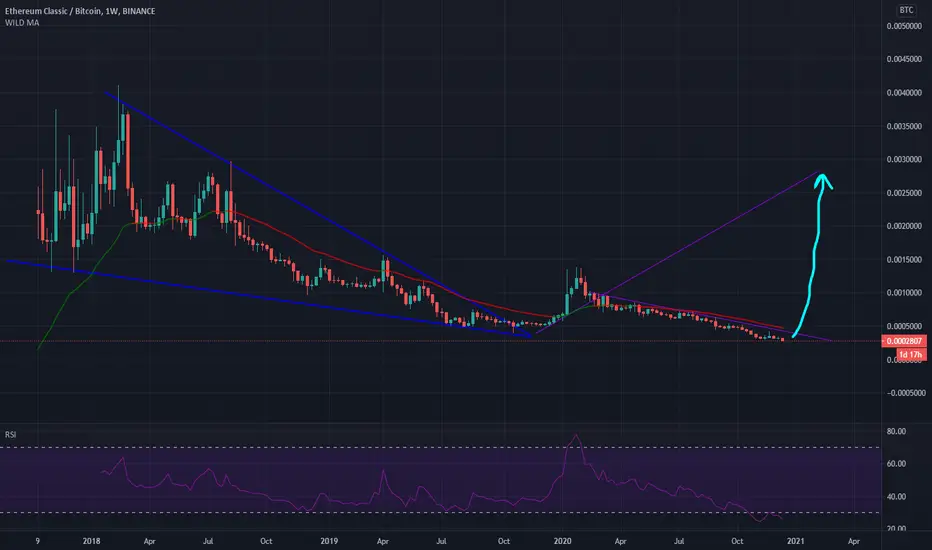
ETC/BTC: The Calm Before The StormAS ETC continues its multi-year down trend, I am seeing signs of investors longing the bottom (notice the ever-increasing ADL... which I assume are buyers since we are at such depressed prices). Also, notice the increase in volume. The circled fractals appear similar and preceded the prior 2019 ETC price pump. The HV indicates VOL is contracting since the beginning of 2020. The contraction period prior to the 2019 pump was approximately 250 days; we are currently on day 203.
This is my style of investing because of the extreme asymmetric risk. whichever way the price move is, guaranteed to be explosive for such a long contraction period.
THIS IS NOT FINANCIAL ADVISE. CRYPTO IS HIGHLY VOLATILE.


ETC Bullish Flag BrokenAll necessary Levels Are on the chart . Remember only Open Position After a Candle on Lower Time Frame close above 6.186$. Good Luck!

ETCUSD: Analysis using Ichimoku 22/07/2020H4
On D1, the cloud is directing upward, indicating an uptrend. You can visually see how the triangle price correction model is forming.
Conclusion:
We recommend selling from the upper line of the triangle pattern when the RSI reaches the overbought level again.
Also, we recommend to close sell and open buy when the price reaches the range of $5,8 - $5,5, and the RSI reaches the oversold level.
H1
At H4, the cloud is directing upward, indicating an uptrend. RSI is in an undefined state.
Conclusion:
You can try to sell with a short stop loss when the RSI H1 reaches the overbought level. However, it should be borne in mind that the upward movement may be higher for H1. A great option is to sell according to the H4 scenario from the upper line of the triangle.
In the medium term, we should expect the price to rise to the level of $8, possibly higher.


ETC is looking for head and shoulders patternETC is going to retrace back after being rejected from weekly level on 1st test at 7252.
The candles followed three levels. ( Middle Trend Line, Bottom Trend Line and Monthly Horizontal Level).
The middle trend line acted as resistance throughout the downward trend, where as bottom trend line as well as at times monthly level acted as a support.
We can call bottom trend line and monthly level as DUAL SUPPORT for ETC.
Once Monthly support level broken on 07 may 2020, it became resistance, as on breaking monthly level candle has to find a support, which in this case was weekly support at 6383.
Current Condition
From 27 June 2020 to 05 July 2020, ETC was in accumulation zone, mean bullish move ahead was on cards, and it happened. During that bullish move, it broke the weekly level at 6383, and it had to find a new resistance which was the next weekly level at 7252.
ETC has found a new zone of support and resistance between two weekly levels, 7252 (Weekly Resistance) and (6383 Weekly support).
Weekly resistance and weekly support has been tested both for the first time, and right now we may see some retracement back to 7252 level.
If you want to enter the trade on daily candles, during the next week 10 to 12 percent rise is expected. You can trade long but must excite before 7252, as it can retrace back. making HEAD AND SHOULDERS PATTERN.
Lookout for Head and Shoulders pattern for now in coming 10 days.
Trade according to the pattern.


ETCUSD: Analysis using Ichimoku 12/07/2020H4
On D1, the cloud is directing upward, indicating an uptrend. The price also broke the downtrend line at D1.
Conclusion:
Locally, we recommend buying when the RSI reaches an oversold level on the H4 near the Fibonacci level of 61.8%.
H1
At H4, the cloud is directing upward, indicating an uptrend. The RSI is not far from the overbought level, indicating a possible continuation of the correction. Also, the divergence has formed on H1 between price and RSI.
Conclusion:
Selling ETC looks risky, since the correction model may take the form of a “triangle”, but you can use this setup and sell ETCUSD when RSI reach overbought level at H1. Stop loss must be set at 6.8.
Also, we recommend buying when the RSI reaches an oversold level on the H1 near level of 6.2.

ETC Long - Expect some profitsBullish Divergence can be seen on 4 Hours timeframe. If you are taking this trade, use tight stop loss and manage your risks. Profits can be more than expected. It's better to have precaution and Bitcoin is showing some unexpected movements too.
If there is confirmation above the line it could show some massive moves, If you want to hold this trade for long. Book partial profits and then use trailing SL with this trade

ETC: Analysis using Ichimoku 06/06/2020H4
The visually visible upward channel, the borders of which in the near future will be tested by the price.
The ETC price is trading below the Ichimoku cloud, indicating a local correction.
RSI is near the oversold level, indicating the possibility of a change in trend.
Conclusion:
We recommend buying from the key Fibonacci support levels of 50% and 38.2%.
H1
Visually, the border of the downtrend is clearly visible.
The price slowly declines below the Ichimoku cloud.
The RSI is near the oversold level, indicating a possible end to the downward movement.
Conclusion:
We recommend buying when the RSI of the oversold level is reached, and also continuing to buy after the price is fixed above the downtrend line.
Good luck!

My EtcUsd short-term workActually, I don't like the symmetrical triangle. But there seems to be a tiny cute RSHS in the triangle. If it exceeds resistance, I think the first target is 7.15. it is not investment advice. It is my own personal work. Good luck.
