ETCUSD ❕ trade in rangeETC is down in the trading range.
Price has fixed under 50MA on 30m Timeframe and is testing 100MA.
I expect the continuation of the fall, if the price will fix under the support level.
ETCUSD

Ethereum Classic (ETC) - May 24hello?
Traders, welcome.
By "following", you can always get new information quickly.
Please also click "Like".
Have a nice day.
-------------------------------------
(ETCUSDT 1W Chart)
There is virtually nothing to say because it has gone down more than I imagined.
ETC's only hope is whether mining can be concentrated on ETC after ETH is converted to POS.
In order to continue the upward trend, it should rise to the 36.26-47.10 section.
(1D chart)
Below 36.26 is a mid- to long-term investment area.
Therefore, it is not advisable to trade within this interval.
However, the important key is whether or not it can rise above 36.26 in accordance with the movement of BTC or ETH prices.
Below 16.05 is most likely a long-term investment area, so you need to trade cautiously.
For now, we need to see if it can go higher than the MS-Signal indicator.
** UNI and ETC coins were published with the expectation that there will be a movement to turn to an upward trend by touching the MS-Signal indicator on the 1D chart.
------------------------------------------------------------ -----------------------------------------------------
** All indicators are lagging indicators.
Therefore, it is important to be aware that the indicator will move accordingly as price and volume move.
However, for the sake of convenience, we are talking in reverse for the interpretation of the indicator.
** The MRHAB-T indicator used in the chart is an indicator of our channel that has not been released yet.
** The OBV indicator was re-created by applying a formula to the DepthHouse Trading indicator, an indicator disclosed by oh92. (Thanks for this.)
** Support or resistance is based on the closing price of the 1D chart.
** All descriptions are for reference only and do not guarantee a profit or loss in investment.
(Short-term Stop Loss can be said to be a point where profit and loss can be preserved or additional entry can be made through split trading. It is a short-term investment perspective.)
---------------------------------

ETC/USDT Secondary Trend Pivot Area Triangle 327 (pennant)Huge pumping +3100% c accumulation (fractal repeat 2017 May). Rollback. Which formed a triangle with the base of 327% (potential upward pennant) in the case of a breakthrough resistance and upward price exit to the upper boundaries of the channel. Zones of levels to work showed on the chart.
The work is acceptable to traders (sham traders are not allowed as on DOGE). Tool for super profits smart people (partial reset with gift zone holding). Newcomers to trading or those people who even in the bull market manage to lose - find another tool to work with. Traders can make a lot of money.
Coin in coenmarket : Ethereum Classic
The main trend of this coin right now .
ETC/USDT Main trend.Triangle. Psychology. Pamp

BTC - Its Crunch TimeBTC - Its Crunch Time which way will we go - Pump or Dump. I say Pump, based on institutional money entry at $28,000.

[ALTCOIN]ETCUSDT TREND LINE ANALYSISHello, everyone
We're a team that specializes in chart analysis
We will always analyze and provide you with charts to help you sell
There are so many trading laws and there are so many good technologies that come with them, but I'm confident that the trend line is really strong.
If you read the point of view and get to know the line, every line will adjust
Thank you.
------------------------------------------------------------------------------------------------
Chart Analysis Content -
Candles continue to fail to cross the blue downward trend.
It is stable only when it rises above the white upward trend.
ETC is one of the few coins with very good angles to any line.
I think it will definitely go up even if I check the floor again.

[ALTCOIN] ETCUSDT TREND LINE ANALYSISHello, everyone
We're a team that specializes in chart analysis
We will always analyze and provide you with charts to help you sell
There are so many trading laws and there are so many good technologies that come with them, but I'm confident that the trend line is really strong.
If you read the point of view and get to know the line, every line will adjust
Thank you.
------------------------------------------------------------------------------------------------
Chart Analysis Content -
As you can see from the chart, once the rise begins, moving at a high angle comes out.
It is going up along the yellow sharp upward trend, but if it breaks, it can check the green support line one more time and go up.
If you want to go up from your position now, you have to break through the downward trend of thick blue and rise above the upward trend of thick white.
If the decline continues, it will fall to the angle of the red downward trend.

ETC 30 - 40 % potential long setup !hi !
I hope you are doing well my friends.
.....
( bullish signs )
1. price tested the trend line
2. get close to 23 level support
3. RSI got oversold
4. Bullish hidden divergence/divergences
5. also volume is very low and there is no seller anymore.
the target is around 38 $ which is more than 30 % profit.
.....
this is how I would like to enter trade
4h chart
after breaking the trend and retest on it
.....
not financial advice !
please , share your ideas with me
I would like to see what do you think about any cryptocurrency <3
have a great day.

BTC UPDATE BTC has bounced again off the daily support trend line and now hopefully we can see a retest and breakout of 4 hr falling wedge.


BTC UPDATE 4HR CHARTBTC is forming a falling wedge on the 4hr chart, looking for increase in volume to retest resistance, will need to break this before thinking of $40k and $42k resistance levels.

ETH is next Here's whats fascinating about crypto: It's a 24/7 market which means that it's roughly 6X faster than the US stock market. There are no holidays, there are no market open market close, there is always on.
I'm a firm believer that the majority of the gains from the stock market will enter crypto, but mostly focused on DeFi.
In 2016 money shifted from BTC (most well known) to ETH (happening now) then LTC then mid caps and then small caps and so on.

Ethereum Classic (ETC) - April 28hello?
Traders, welcome.
By "following", you can always get new information quickly.
Please also click "Like".
Have a nice day.
-------------------------------------
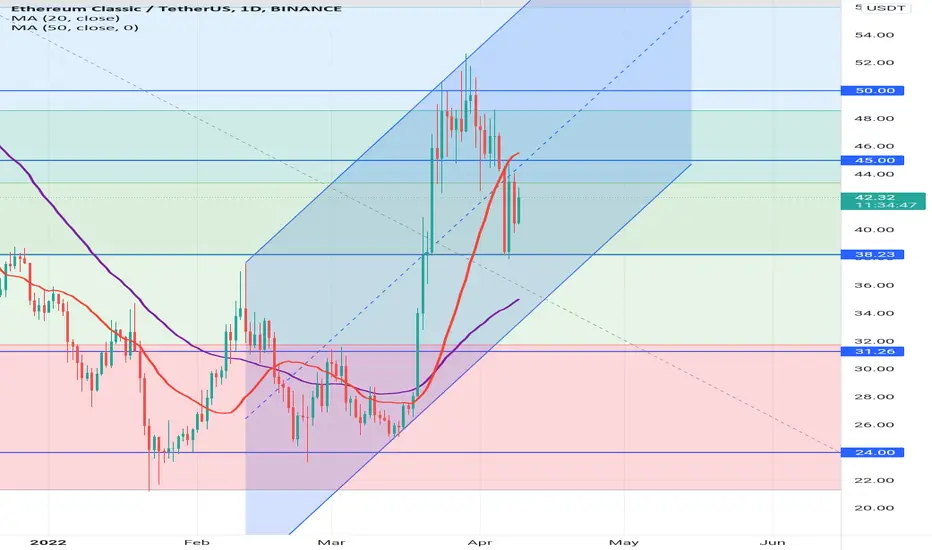
(ETCUSDT 1D Chart)
Resistance: 36.26-47.10
As it fell below 36.26, it is showing a movement to enter the mid- to long-term investment area.
We need to see if we can find support in the 26.52-29.66 zone and move higher than 36.26.
The resistance section of 36.26-47.10 is the section that determines the trend.
Therefore, it is important to have support in the 36.26-47.10 section.
However, if there is movement within the uptrend channel formed by the mid- to long-term uptrend line, it is likely to move up.
It is recommended to proceed after confirming support at 36.26 or higher at the point where buying is possible.
------------------------------------------------------------ -----------------------------------------------------
** All indicators are lagging indicators.
Therefore, it is important to be aware that the indicator will move accordingly as price and volume move.
However, for the sake of convenience, we are talking in reverse for the interpretation of the indicator.
** The MRHAB-T indicator used in the chart is an indicator of our channel that has not been released yet.
** The OBV indicator was re-created by applying a formula to the DepthHouse Trading indicator, an indicator disclosed by oh92. (Thanks for this.)
** Support or resistance is based on the closing price of the 1D chart.
** All descriptions are for reference only and do not guarantee a profit or loss in investment.
(Short-term Stop Loss can be said to be a point where profit and loss can be preserved or additional entry can be made through split trading. It is a short-term investment perspective.)
---------------------------------

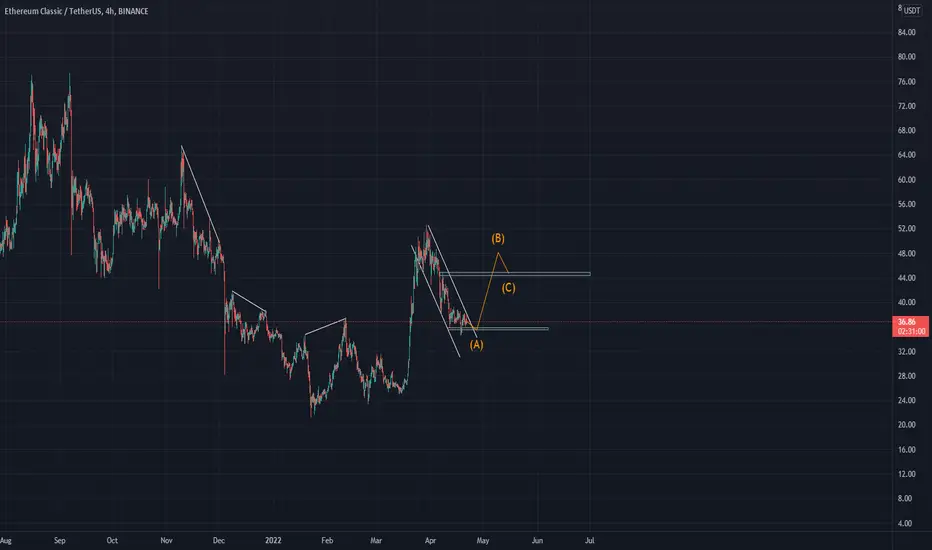
ETC/USDT : Moving into a falling wedge BINANCE:ETCUSDT
Hello everyone 😃
Before we start to discuss, I'll be so glad if you share your opinion on this post's comment section and hit the like button if you enjoyed it !
$ETC's moving into falling wedge and now it's getting supported by the local bullish order-block at $36.
The main movement's prediction is bullish; But as $BTC is getting the weekly close below $42000, It's better to have the possibilities for both side...
- Bullish Case; If we get the break-out above falling wedge, I'll locate my Long on a proper retest of higher order-block at $39, Then aim for $40.90 - $44.90 - $49.90
- Bearish Case; If we get the rejection below falling wedge, I'll locate my Short on a proper retest of mentioned order-block at $36, Then aim for $31's S/R zone/line.
Hope you enjoyed the content I created, You can support us with your likes and comments !
Attention: this isn't financial advice we are just trying to help people on their own vision.
Have a good day!
@Helical_Trades

ETCUSD is building for the breakoutEthereum classic is setting up for the breakout. The price action will accelerate after it crosses $38: the upper border of a narrowing chart formation. I expect to see a sharp move above $38 with a target of $45


Falling Wedge on ETCUSDTBased on technical factors ( Falling Wedge ) there is a long position in :
📊 ETCUSDT Ethereum Classic
🔵 Long Now 37.10
🧯 Stop loss 34.20
🏹 Target 1 45.30
🏹 Target 2 51.80
🏹 Target 3 62.30
💸Capital : 1%
We hope it is profitable for you ❤️
Please support our activity with your likes👍 and comments📝

ETCUSDT- Falling Wedge PatternETCUSDT- (4h Chart) Technical analysis
ETCUSDT- (4h Chart) Currently trading at $37.25
Buy level: Above $38
Stop loss: Below $34
Target 1: $39
Target 2: $43
Target 3: $48
Target 4: $52
Max Leverage 3x
Always keep Stop loss
Follow Our Tradingview Account for More Technical Analysis Updates, | Like, Share and Comment Your thoughts

Kishu USDT %2465 potancial Break the trend 📉📉📉📉📉
Have a good potancial for six month just buy and forget,
Everyone can be rich 🤑🤑🤑 💰💰💰 just wait.

BTC UPDATEHey famz, BTC continues to hold above daily support trend line, and now for a while $40,000 horizontal support, would like to see an increase in volume to get more of a pop, however it is Easter weekend, so a bit uneasy here to be confident either way.

ETC IS PRESENTLY AT FIB50. ETC at $43 and happen to be FIB50. This is an important level. If we breakout from this resistance, we should expect a rally to $50 zone.
What do we expect to happen next?
ETC/USDTBuy step by step in supports and sell step by step in resistances and buy again in pullback just that. Like and comment please. Good luck❤😊

