What might this be?
I am long, why ? why not !
Subdivision of wave X is in 3 waves (Corrective phase).
Subdivision of wave 1 is in 5 waves "impulse". What is this telling us?
You know what that means.
ETCUSD

ETC short setup Hello Traders, here is the full analysis for this pair, let me know in the comment section below if you have any questions, the entry will be taken only if all rules of the strategies will be satisfied. I suggest you keep this pair on your watchlist and see if the rules of your strategy are satisfied. Please also refer to the Important Risk Notice linked below.

ETCUSD ❕ downward channelETC is moving in a downward channel under liquidity.
Price has fixed under 200EMA on the 1H TF.
I believe that the price will continue to decline.

ETCUSDT undergoing the reversalLove the formation of the double bottom, and the current pullback on ETCUSDT. It provides a good RR opportunity for the long-term hold. However, the first resistance at 50% Fibs must be taken out for the uptrend to start.

ETC ANALYSIS (1D)Hi, dear traders. how are you ? Today we have a viewpoint to BUY/LONG the ICP symbol.
For risk management, please don't forget stop loss and capital management
When we reach the first target, save some profit and then change the stop to entry
Comment if you have any questions
Thank You

ETCUSD ❕ downward channelETC continues to move in a descending channel.
The RSI chart is in the sellers area (4H, 1H and 30m TFs)
I think the asset will continue to decline.

What happens after confirmation?
Extrinsic value= $ 22.34
Intrinsic value = $ 95
(To me, this means) If it dips the very next day then I'll buy.
This approach helps keep you one step ahead of market.

ETC retest of 23?hello friends, a few more ideas and I'm done, ETC I think we also need to test higher positions around 23. So we'll see, mainly carefully and SL

ETCUSD ❕ downward channelThe RSI indicates a transfer of the initiative to the sellers.
ETC is back in the descending channel.
I expect the asset to continue its decline.

ETCUSDT | UptrendIn the 4-hour time frame, ETCUSDT has currently broken out of its minor bottom neckline, which is a good indication that it will make a higher high according to Dow theory. Additionally, there is a double bottom pattern, and ETCUSDT has successfully broken out of its neckline. According to that pattern, its projection is at $21.30, which is our final target profit. We entered at the current market price (CMP), and our first take profit level is at $20.50 with a risk and reward ratio of 1:1.
ETCUSDT has a weak low at $19.10, which is a strong support area. Its resistance levels are at $20.20, $20.50, and $20.73, with a strong resistance at $21.30, which is our final take profit level. We can also see a minor retracement to $19.70, which is a higher low, and then we can expect a higher high to $20.58, which is highly likely to be tested because there is a Fibonacci golden number of 0.382.

ETC - Massive price movement coming! The enormous triangle currently displayed on the chart represents the price trend that ETC has been following since August of 2021. A successful breakout from this particular pattern is likely to result in a significant price movement for ETC! If the price breaks below 16$, a move down to 10$ may happen!
Current market conditions suggests that many altcoins are exhibiting a bearish outlook, with a considerable number of them having breached their BTC-pair support levels. This indicates that in the event of another drop in BTC prices, altcoins are likely to suffer significant losses. It is my projection that a decline of at least 50-70% in altcoins may occur prior to August. I maintain a highly bearish stance regarding the upcoming summer period, which seems to resemble the summer period of 2021.
Regarding Bitcoin, it is possible that it may soon reach 25k so trade safe
-------------------------------------------
About BTC:
It appears that the current market period is unfolding similarly to the one observed in 2021. If this trend continues, it is likely that the market will experience a downward movement, potentially leading to a decline in value to 13.5k.
While it's true that history doesn't necessarily have to repeat itself, it is often observed that historical patterns tend to rhyme with the present.
Upon examination, it is also evident that the price got rejected from the bear market downtrend resistance! There is a possibility that the recent bear market rally has come to an end. The rejection from the downtrend resistance is indicating a potential move to the previous bottom of $15.5k. This notion is consistent with the concept of the price following a pattern reminiscent of the 2021 summer period!
-------------------------------------------
About our trades:
Our success rate is notably high, with 10 out of 11 posted trade setups achieving at least their first target upon a breakout price breach (The most on TW!) . Our TradingView page serves as a testament to this claim, and we invite you to verify it!
-------------------------------------------
If you like the content, then make sure to comment and like the post :D
Follow me for daily profitable trading setups.
BTC dictates the market. If BTC falls, then Alts will drop as well. Trade safe!

ETC - Massive breakout possible! The price is brushing the upper trendline of the triangle and a breakout is possible!
The idea is: Buy when the price breaks above 25$ and take profits at the levels shown in the chart.
Targets:
1. 28$
2. 32$
3. 37$
4. 47$
5. 53$
-------------------------------------------
Recent Altcoin trades:
ARB / USDT: 30% profit!
-------------------------------------------
About our trades:
Our success rate is notably high, with 10 out of 11 posted trade setups achieving at least their first target upon a breakout price breach (The most on TW!) . Our TradingView page serves as a testament to this claim, and we invite you to verify it!
-------------------------------------------
If you like the content, then make sure to comment and like the post :D
Follow me for daily profitable trading setups.
BTC dictates the market. If BTC falls, then Alts will drop as well. Trade safe!

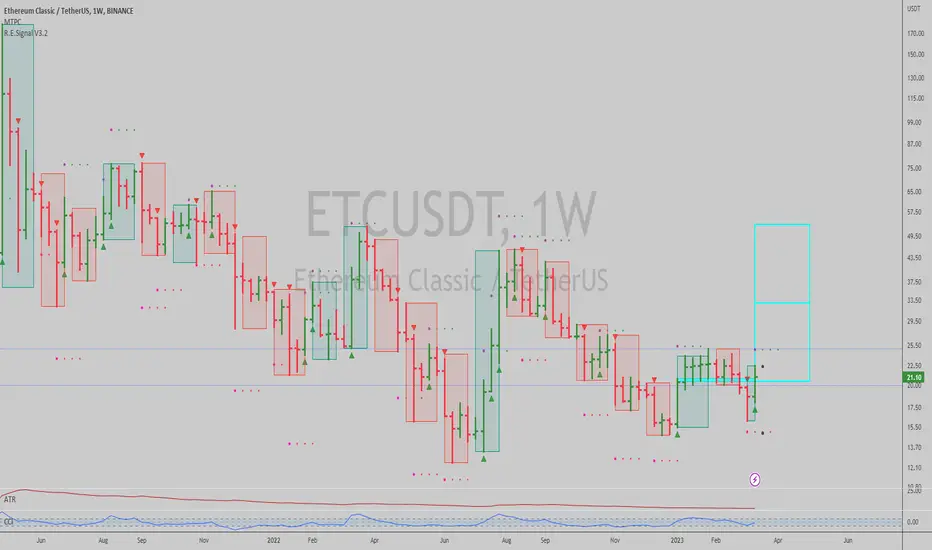
✴️Ethereum Classic Will Also Recover (222% Possible Higher high)Volume is one of the strongest indicator and can help you clear any doubts.
Ethereum Classic (ETCUSD) hit a higher low compared to June (5 months ago) but how to know if it will recover here or continue lower?
Here we use the volume indicator.
Notice how trading volume continues to diminish, it goes lower and lower.
That's your signal.
It means the current trend is losing strength.
Since the mid-term trend is bearish, as it loses strength things can turn and ETCUSD reverse.
Higher lows can lead to higher highs.
Over 222% possible on a higher high.
Easy 50% to 80%+ on a bounce.
You still need a plan to trade and your own research.
The support levels are marked with blue on the chart and can be used as a stop-loss.
These analyzes are not intended as financial advice.
Thank you for reading.
Remember to boost 🚀
Namaste.

W9.1-9 ETC BULLISH IDEA (HARMONICS PATTERN)Potential Bullish Entry
Dow Theory In Place - Higher High and Higher Low Expected in Place
Formation of Harmonic Bullish reversal Pattern coupled with bullish divergence at potential reversal zone (PZR)
Entry at the new HH
SL & TP Levels are defined.

eth weekly bull flag breakout to 2750 and 4800looking for breakout, and retest 2750 and then 4800.. Not trading or investment advice. for my own personal trading knowledge and gain.

etcIt has a short-term resistance range that can help to open long trades on the green lines and see higher targets in case of failure.

ETCUSD [3h] On the right track push forwardOn the way of 27 usd. Etherium Shanghai update reaction will decide if go further or pull back...
Always be your advisor!!!

$ETCUSDT: Bullish trendMaybe it plays some catch up to $ETHUSDT here on the back of the Shanghai upgrade potentially being seen as a source of sell pressure by market participants, chart is certainly bullish if it closes the week over $20.78.
One of the dumbest coins around, only miners and some degenerate WSB guys have any interest in it (and Barry of course), but it is what it is. Low risk trade setup for a small position here.
Best of luck!
Cheers,
Ivan Labrie.
✅TS ❕ ETCUSD: correction✅✅ Ethereum Classic broke through the downtrend.
The chart has formed an ascending structure.
The price will rise after breaking through resistance. ✅
🚀 BUY scenario: long to the resistance area. 🚀
----------------------------------------------------------------------------
Remember, there is no place for luck in trading - only strategy!
Thanks for the likes and comments.

$ETC where you go bro? sit down.I see no reason for this pump, so let's try a good short.
I think that this rise has been to clean shorts.

ETCUSDT | Wave Projection TFW Ending Diagonal Breakout SetupWave analysis with price action & chart pattern bullish outlook - a potential ending diagonal breakout setup
> The weekly price with triangle pattern and candlestick squeezed between EMA 200 week zone and potentially breakout near the apex zone.
> Now with multiple false breakdown, possible pinbar long entry setup pattern.
> Target Zone: 0.618 - 0.786 Fibonanci retracement - Volume profile point of control area + 80% upside
> Stoploss Zone: previous low with a pinbar looks like the right shoulder of a mega inverted Head & Shoulders -20%
> RRR: 4:1
RSI TFW bullish signal - uptrend above MA and squeezed below 50.

ETC IS BEARISHHi, dear traders. how are you ? Today we have a viewpoint to SELL/SHORT the ETC symbol.
For risk management, please don't forget stop loss and capital management
When we reach the first target, save some profit and then change the stop to entry
Comment if you have any questions
Thank You

ETCUSD ❕ descending channelETC trades under liquidity.
The chart is moving under a range.
The asset will continue to decline.
