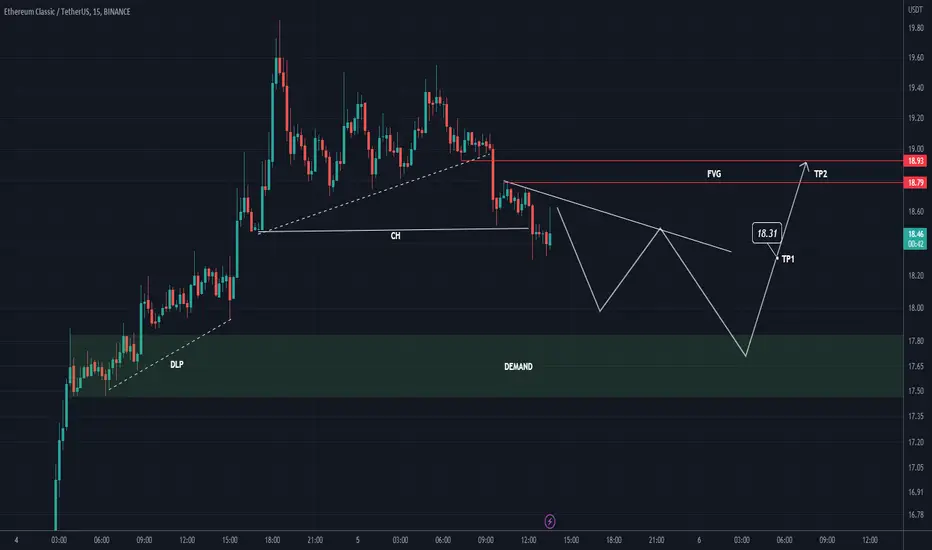
ETCUSDTETCUSDT (4H Chart) Smart Money analysis
Snipe Trade
Max Leverage 10x
Always keep Stop loss
Follow Our Tradingview Account for More Technical Analysis Updates, | Like, Share and Comment Your thoughts
ETCUSDT

ETC had a nice price rally last weekETC had a nice price rally last week. Buying pressure on Ethereum has also affected the trend of this currency. On the other hand, the desire of miners to mine it can increase the demand for Ethereum Classic. In the previous analysis, the resistance range of $16.7 to $17 was considered to confirm the double bottom pattern. Buyer strength was so high that the Ethereum price broke through the first resistance without a pullback and reacted negatively to the second resistance.
Higher ceilings and floors in the 4-hour timeframe are a sign of strength for buyers, and the trend could remain bullish until the bottom of the last wave is broken in the $18.45-$19.2 range. Note that the candles have crossed the resistances without a pullback, which increases the probability of reacting to the current resistance in the $21.23-$21.5 range. So the support of 18.9 to 19 dollars is the closest reliable range to create demand. If the buying pressure causes the current resistance, the next target is $25-27.

ETC SHORTIdea based on triangle, worth to keek eye on it.
Enter Between 22 , 22.5$
Stop Loose 23.1$
TP 17 and more.

Critical moment for ETCIt reached support level 19.4-19.5$. it is good it didt close 4h below the line.
Once it drops and closes 4 h candle below 19.4 $ then 2nd line will be the support line.
When we consider the huge drop on volume and RSI cross, it seems the price has more potential to drop than to rise. (Not Financial Advise )
What do you think ?

ETHEREUM CLASSIC, a long term vision. ETCUSDT . UpdateHello guys, This is an update of previous analysis (blow link), we made our buy positions at the two points which we wanted and the trend has moved as we expected. For now you can manage your capital and profit until reaching the chosen target.
Good luck
If you like the idea, do not forget to support with a like and follow me for next analysis :)
Write your comment and opinion below for me

$ETC #ETC | LTF SHORTThe lower bound of red box most probably will work as resistance so i looking at bearish breakers around $18.98 . If the price loses red box, the price may dump more than we expect.
Have a nice week!

ETCUSDT SHORT Hello guys , how are you I think you have a great weekend
Today I came with a shorting opportunity on ETCUSDT read and enjoy your weekend.
RSI divergence in a major level of structure
It is also in the over bought region
MACD divergence is also confirmed
we can enter after the double top of the second high i. e
on the higher high.
the market is moving strongly up
due to the news on yesterday "non-farm payroll."

✴️ Ethereum Classic Leads The Altcoins, July 2022 Repeat, 195% PThe last time Ethereum Classic moved above EMA50 was back in July 2022 and this lead to more than 155% growth.
We have the same situation now which we have been expecting and this time around we can have similar results.
We are trading within a higher low which tells us of a potential higher high.
The main target is set at 134% but if we get a higher high we are looking at a potential 195%+ from the current price.
If we get such huge growth... This might confirm bitcoin's low.
The bottom might be already in for bitcoin and this would mean that what we are seeing develop now is not only a relief rally but the start of the next bull market... Stay tuned for more.
Namaste.

ETCUSDT.P LONG Hi, guys.
The Ethereum Classic is on a very good upward trajectory, so you can control the weight of the money and aim for a long RBI.

ETCUSDT Trend reversal!!ETCUSDT (1D Chart) Technical analysis
ETCUSDT (1D Chart) Currently trading at $18.5
Buy level: Above $18
Stop loss: Below $13
TP1: $21
TP2: $26
TP3: $31
TP4: $45
Max Leverage 2x
Always keep Stop loss
Follow Our Tradingview Account for More Technical Analysis Updates, | Like, Share and Comment Your thoughts

ETC PURSED MOVEMENT, WHY?If price must get to the upper band, price must breakout out at the %30($18.528) or %50($18.758) retracement from the resent ATH, else it may need to retest $17,886 .

ETC Buy Setuphi, I hope you are well. Today is another day to make profit from the market
I think it can move up when it hits the green area. Capital management, volume, leverage and stop setting should not be forgotten
Comment if you have any questions
thank you
ETC Retraced by %30, could price be rejected at this level?Showing on the chat an Order Block formed on 15M TF at the %30 retracement, could this be a rejection sigh? Maybe price will come back to retest the OB, and if broken then we may get to the %50 retracement ($17.314) but if rejected then you may see price moving towards the upper band. What is your opinion on this? Kindly leave a comment
Thanks

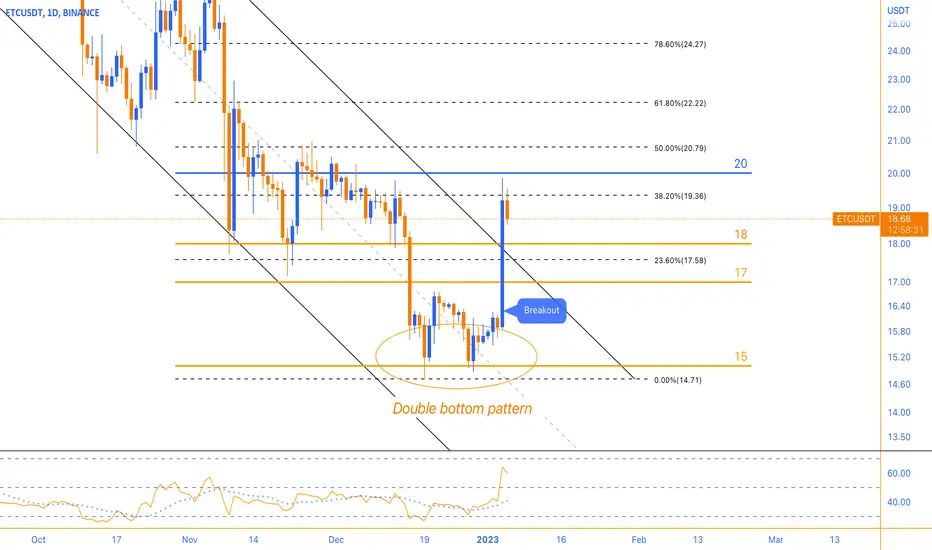
Double bottom patternETC has gained more than 20% in price in the past day. Ethereum Classic, which had formed a double-bottom pattern above the $15 support area, confirmed the pattern with support from buyers after breaking through the $17 area resistance and continued to rally near $20. With this buying pressure, the price has left the medium-term downward channel, and if the price enters the corrective wave, we can expect a pullback to the ceiling of the broken channel in the range of $17. However, note that a strong upward trend in the 4-hour timeframe can have a shallow correction. Therefore, the first support level is considered to be in the $18 range, and if we see signs of support, we will expect the price to grow.
✴️ Ethereum Classic Moves Past EMA50Ethereum Classic (ETCUSDT) managed to move above EMA50 to the upside.
This is the first time this happens since July 2022.
Now, can it stay above EMA50?
We have the long-term higher low and basically the exact same conditions as we did last year.
The prognostications look good.
We can't say if it will or will not stay above this level.
The technicals are bullish and we can expect additional growth but here is how really things work...
If ETCUSDT moves back below EMA50, the mid-term bullish bias is lost.
Staying above this level and the bulls remain in control.
We got the breakout... It is for the market to decide how things will turn.
We should see growth for 1-2 months... Hopefully!
Namaste.

ETC/USDT Secondary trend. Channel. Accumulation and distributionSecondary trend. Timeframe 3 days. Which formed a downward reset channel with a significant 108% move after a huge +2000% to 3000% pump. This is what happens when a coin is "forgotten about by all," not advertised in the news, and accumulated for such a long 2.2 years.
The real ether. The “green” parent of the expensive “black” ethereum.
Coinmarket Coin: Ethereum Classic
At the moment the price is approaching the uptrend of the main trend (long-term). Dynamic support (green) of the large channel.
The medium-term reversal zones of the secondary trend are shown on the chart and circled in yellow, on which (breakthrough / not breakthrough) depends on the further development of the trend.
The graph shows the accumulation and distribution zones. Zones of smart and stupid.
Position resets.
"Waves of interest" with price retention is expensive
1—distribution zone. Formation of a 6.5-month triangle). -61% from the reversal level of the triangle breakout.
2—zone after the triangle breakout. Formation of the descending channel.
The whole drop is 10.8 months (327 days).
The price is now at the “Hamster Pump” peak zone (buying back liquidity “expensive” from those who didn't want to sell cheap) $17.22 - $20 before a huge pumping +2244% of the average set price.
Accumulation in the horizontal channel, 2.2 years.
The channel is 100% $3.78 to $7.35. Average liquidity set price of $6.
Maxima—$13.18 (redemption of coin volume “expensive” for subsequent failure under market dump).
Minimums—$3.1 (market dump 13 03 2020).
Expensive and cheap ether. Mining.
Ethereum is moving to version 2.0. There will be a transition from proof-of-work to proof-of-ownership, and mining on video cards will cease to be profitable. This will happen in the second half of 2022, perhaps even this summer.
This very unpopular and painful decision (inevitable) has been dragging on for 3 years now. It is very likely that this year will be the end of this problem. It's not hard to guess which cryptocurrency the miners who mine ETH now will most likely switch to. Consequently, it can very positively influence ETC price.
For those who don't know, let me remind you. ETC is the true ether. ETH is a fork. Forced fork, to get back stolen ETCs during attack on DAO (just to roll back transactions of “hackers” wallets).
That's how 2 Ethers came into existence. ETC (limited quantity of coins) and ETH (unlimited quantity of coins). Of course, they began to promote and develop centralized fork, that is ETH.
The whole story about birth of ETH with ETC and the story (real imitation) with hackers attack on DAO and stealing of ETC coins was made just for “birth” of more centralized crypto-mint for testing technology, especially smart contracts on it.
Under the idea fixed my previous trading ideas for this coin, including closed (pre-pump recruitment zone).

etc looking good hereaccumulating etc down at these prices
if we break the down trend could see a nice move up

ETC - The classic twin bottom pattern is formedOver the past two weeks, ETC has recorded a range trend at the support level of $14.71. While swinging on this support, the classic double bottom pattern is formed, and if the neckline resistance of the pattern is broken, i.e., the break of the $16.75 to $0.17 range, we can consider the pattern confirmed. The price target after confirming the pattern is considered in the range of 18.90 to 19 dollars. Because this resistance is outside the short-term descending channel, we can have a mentality of possible breaking of the channel ceiling.
Of course, this breaking could be fake because in the current downward trend, the power of the bearish candles is greater, and still, because the pattern's neckline is broken, the trend in the 4-hour timeframe can also be bullish. Therefore, pullbacks will face demand for support. The downtrend line on the RSI is being broken, which could be a good sign for this week. Of course, if the last daily candle closes well, we expect this upward movement.

✴️ Ethereum Classic Part 2 | Can It Go Higher Than $45?Part 1 is the July/August 2022 bullish wave...
It is hard to believe but its been more than 4.5 months since the last high.
Cryptocurrencies tend to correct for 2-3 months, normally... This time it has been already 4.7 months and we are still within a higher low.
What this means is that the next bullish wave is overdue.
Even on another shakeout, it gets closer and closer with each passing day.
Higher lows lead to higher highs... So there is potential for Ethereum Classic to go above $45 .
See the chart for additional information.
Namaste.

Ethereum classic ETC has almost reached the bottom!Hello, traders!
Last couple of days we told about we told about crypto assets which have to dump significantly before reaching the actual bottom. Today we have Ethereum Classic which in my opinion has only 20% potential dump before the new bull run .
ETCUSDT showed the wonderful corrective wave C which caused the FOMO and hit $45 , but after that the ending wave 5 became the huge disappointment for hurried traders. This wave has the clear internal structure. Minimal Awesome Oscillator value helps us to find the bottom of the wave 3. The entire cycle can be drawn using the wave 3 point. I suppose now ETC is in wave 5 inside wave 5. It has the natural target $12 where I am going to buy this cryptocurrency.
Even if Ethereum Classic is a scam the buyer reaction is anticipated from this level because it’s the huge liquidity are. The guaranteed target is the 0.61 Fibonacci at $30 , therefore we can make an easy 2x . I am going to execute this trade.
Best regards, Ivan
________________________________________________________________________________________________
If you like my trade ideas, please smash the boost button to stimulate me make more quality analytics!

Trading opportunity for ETCUSDTBased on technical factors there is a Buy position in :
📊 ETCUSDT
🔵 Buy Now 16.34
🧯 Stop loss 14.50
🏹 Target 1 18.25
🏹 Target 2 20.00
🏹 Target 3 22.75
💸RISK : 1%
We hope it is profitable for you ❤️
Please support our activity with your likes👍 and comments📝

✴️ Ethereum Classic Weekly | Falling Wedge Clear Picture (120%) It doesn't need any analysis does it?
Ethereum Classic (ETCUSDT) on the weekly timeframe gives a clear picture.
We have the classic falling wedge pattern and a perfect -9 on the TDs showing up.
We have a long-term higher low when looking back at June and the value area also points up.
No need for more analysis... Over 120% possible in 2023 Q1.
Namaste.

✳️ Ethereum Classic vs Bitcoin Has 100%+ Potential Or MoreLook at this signal, the RSI for Ethereum Classic (ETCBTC) hit its lowest level since November 2020.
Last time this same level was hit on the daily RSI ETCBTC went on a massive bull-run, the biggest in its history.
The entire wave produced a total increase in price of 1,816%.
A strong/long-term support level has been activated.
There is potential for a bounce at this level.
There can be one final drop or a period of consolidation before the bigger wave.
The time horizon is between January and March 2023 for this bullish wave to take place.
Get ready... Be prepared!
You've been warned, in a positive way.
Time will tell of course.
Namaste.
Legend: ✳️ = Altcoins vs Bitcoin | ✴️ = Altcoins vs Tether | 🅱️ = Bitcoin | 📈 = Index | 💾/💿 = Stocks/Conventional Markets
