etcusdt 1 hour#etcusdt 1 hour
It has a good shorts position
Targets and stops were identified in the photo
ETCUSDT

Ethereum Classic UpdateWe've come a long way since our first ETCUSDT chart on July 16, but we believe this Altcoin pair has more to give.
Here is the previous chart:
Ethereum Classic vs Tether (95% Target Mapped) | 16-July-2022
You can check the "RELATED IDEAS" below for more.
Thanks a lot for the continued support.
Namaste.

ETCUSDT#ETC Buy signaling 1D,2D and 3D.
The signal on this chart is typically very strong
#etcusdt #etcbt


possible continuation on #ETC toward $30+staying away from the weekend's bearish speeches
awaiting a possible continuation on #ETC toward $30+
R:R is good enough w/ a tight stop below current support
$ETC
Ethereum Classic vs Tether (95% Target Mapped)Ethereum Classic is bullish on all fronts, vs Bitcoin/vs Tether.
This is the ETCUSDT pair.
First, we notice the broken downtrend.
This is followed by a consolidatin phase that leads to a bullish breakout.
This breakout is what we are waiting for.
Additional details on the chart.
Namaste.


Ethereum Classic (ETC) - July 28Hello?
Welcome, traders.
If you "follow", you can always get new information quickly.
Please also click "Like".
Have a good day.
-------------------------------------
(ETCUSDT 1W Chart)
The key is whether it can be supported by rising to the 36.26-47.10 section.
If it is not supported in the 36.26-47.10 section and falls below 30.50, Stop Loss is required to preserve profit and loss.
(1D chart)
Resistance: 36.26-47.10
1st support: 30.50
2nd support: 22.51
The resistance section of 36.26-47.10 is the section that determines the trend.
Therefore, it is an important key whether it can be supported by rising to this section.
------------------------------------------------------------ -----------------------------------------------------
** All indicators are lagging indicators.
Therefore, it is important to be aware that the indicator moves accordingly with the movement of price and volume.
However, for the sake of convenience, we are talking in reverse for the interpretation of the indicator.
** The MRHAB-T indicator used in the chart is an indicator of our channel that has not been released yet.
** The OBV index was re-created by applying a formula to the DepthHouse Trading index, an index disclosed by oh92. (Thanks for this.)
** Support or resistance is based on the closing price of the 1D chart.
** All descriptions are for reference only and do not guarantee a profit or loss in investment.
(Short-term Stop Loss can be said to be a point where profit and loss can be preserved or additional entry through split trading. It is a short-term investment perspective.)
---------------------------------

ETC Formed Inverse H&S Target $30Hey guys again today i'm going to analysis ETC/USDT pair on 4hour time frame...
1)First we can see Downtrend line is now Broken and thats good signal and this mean ETC Downtrend converted into UpwardTrend, the first HIGH - Higher Low we have now.
2)We have also Inverse H&S pattern on chart and Neckline now is broken, we can also wait for Retest Neckline and then buy, or we can wait for see good Volume Spike and then buy, so buy at $22 and take profit $30.
3)We can see Volume slowly Decreasing last days and when we can see Volume Spike and its must be above Trend Line then we can buy at $22 Level.
4)When CCI Oscillator rise above +100 we can receive buy signal too, we can sell when CCI touch +200.
Hope you enjoying this chart, so this is short target for ETC, but in long term ETC this year can easily hit $300 when ETH switched into POS )))

ETCUSDT Flag Pattern Formation!ETCUSDT Technical analysis update
ETC currently trading at 28.60
Buy zone: above $28.50
Stop loss : $26.25
TP 1 : $31.00
TP 2 : $33.00
TP 3 : $36.75
Always keep stop loss
Thanks
Hexa

ethereum classic made a big profitEthereum classic is heavily overbought, I think it is necessary to liquidate longists, indicators are overbought,
this is a signal for a correction!
In order not to miss a buy signal, subscribe and stay tuned for new ideas. Every day I post 10 profitable ideas a day.

ETC (one more leg up ?)ETC / USDT
another special coin during current bear market
ETC still strong and likely to do one more leg up to hit resistance line since may 2021 before correction (≈32$-35$)
Moon shot case : if ETC able to close weekly above resistance line expecting very strong bullish rally

ETCUSDTHello Crypto Lovers,
Mars Signals team wishes you high profits.
This is a one-day-time frame analysis for ETCUSDT
Here we have R3 as our resistance line and the unsuccessful triumphs of the price to rise is obvious. R2 and R1 used to be the support areas as well as, which all S1 is a support area which expresses the support of the price at some points. At the moment, the price is fluctuating in R1 area. Therefore, it will have two options. Either it will rise over R1 and by giving a fixation there and by receiving some confirmation candles, we predict more rise for it to R2 or more. Or it will fall below R1 and experiences more decline toward S1. Remember that by the time the price does not leave R1 area. there is no precise prediction for it.
Warning: This is just a suggestion and we do not guarantee profits. We advise you to analyze the chart before opening any positions.
Wish you luck

ETC/USDT ShortShort Etc/Usdt at 24.00 & exit at 23.32
Strong selling pressure in Etc, so we relaxly make a short at Etc

ETC: revenge short?I've shorted ETC from 19th until last night, I didn't close the short when I was in good profit because I was waiting for a deeper dump. Yesterday I closed at risible profit because I was unsure about the daily opening (better this than loss).
However current price action is showing more bearishness and price is piercing out of this rising wedge so this might easily be a green light for another short, a revenge short if you want. I'd check 25.37 USDT level, a 4h close below that price it's a confirmation of breakdown
Indicators are bearish, you can either short and exit at TP1 or even do it in two steps so TP1 and TP2. Off course I'm still deciding whether to wait for confirmation or enter right now, do as you wish.

2022-07-26 _ ETCUSDT Analysis with ABCD Pattern (Long)ETCUSDT is now distributing and as per ABCD pattern, it will go long from S1 or S2. So make entry as per DOW & candle stick behaviors from S1 or S2 and set SL accordingly.

Ethereum longEthereum bounced off the lower boundary of ascending channel. Bullish movement to resistance level at 1650 is possible.

Trading opportunity for ETCUSDTBased on technical factors there is a long position in :
📊 ETCUSDT
🔵 Long Now 25.82
🧯 Stop loss 24.02
🏹 Target 1 28.20
🏹 Target 2 31.50
💸Capital : 1%
We hope it is profitable for you ❤️
Please support our activity with your likes👍 and comments📝

Ethereum Classic Targets $77 (195% Profits Potential)This is why we focus our trades on the smaller altcoins rather than the big ones.
Smaller capitalized altcoins have higher potential for growth.
After a stop-loss hunting period, ETCUSDT had a strong volume breakout and is ready to move up.
$37 Is the easy target, still big growth.
We can see it going up to $77 and that's a huge 195% potential from the current level we are on.
This is my first DEX trade and it is paying really well...
I am very happy -extremely GRATEFUL- with the results.
I can be impatient in mind, playing in my mind saying to myself that I am impatient, but the trades... I do not touch.
I wait and wait and wait, patiently...
And only sell when the next resistance hit.
That's a sure and easy way to win.
Thank you for reading.
No need to comment.
No need to "boost"...
All that is needed is that you use this information for your own success.
That you profit from this information or that you learn something or in the least feel entertained.
Everybody has to do their own research.
There is always the potential for loss.
Trading involves risk.
If you can't take a loss, this business is not for you.
But if you can, that's part of the game and as you learn you will win long-term.
Thank you for reading.
This is Alan Santana!
I am wishing you the best, now & always.
Namaste.

ETC broke down rising wedge#ETC/USDT
#update
$ETC broke down and done its pullback to confirm the support zone as resistance.
also RSI below HMA is a bearish sign.
🐻 so it seems bears are in control

ETC rising wedge#ETC/USDT
$ETC shaped a rising wedge pattern. but it is above support zone
🐻 break down the lower zone can drop price to 0.5 and 0.618 fib levels.
🐮 break out the upper line can reach price to around $35

ETC 15m short scalpi have two scenario in mind , let me know what you think in the comments!
scenario 1: ETC will come to the zone and then after a nice bearish candle we will get in
(confirmation candle gives us the stoploss location)
scenario 2: ETC will break down the channel and then after a pullback to the lower zone we get in
(place your stop loss above the confirmation candle)

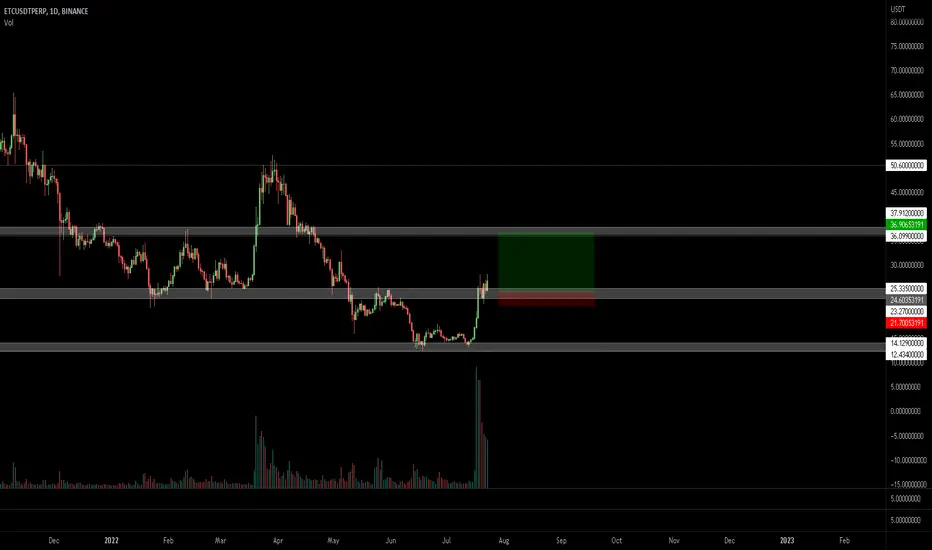
ETCUSDT(Ethereum Classic) Daily tf Range Updated till 22-07-22ETCUSDT(Ethereum Classic) Daily timeframe range. for any alt quality volume and retail interest are big factors. we can see both into this chart. and for that the price action been reasonable here too. provided swing setups , position setups and scalp setups. of course as its alt there will be always risk. but there are levels of risk. compare to many other alts out there with bat shit crazy price action there are very few with reasonable price action.
