ETC Formed Inverse H&S Target $45Hey guys today i'm going analysis ETC/USDT pair
1)ETC is formed now Inverse H&S pattern, and we all know this pattern is bullish pattern
3)We have two left shoulders and two right shoulders and one head, we know we can have multiple shoulders that's normal
4)If we breakout from $30.5 level with volume, and close daily candle behind the resistance line, next target must be $45
5)If we take a look MACD indicator thats also bullish,we have bullish cross already and Histogram is green now, that's bullish signal
If you like my analysis pls like and subscribe me)))
ETCUSDT

Ethereum Classic (ETC) Sell ZoneEthereum Classic (ETC) Buy Zone
--------------------
BIAS
Mid-Term : Neutral
Long-Term : Bullish
Risk : High
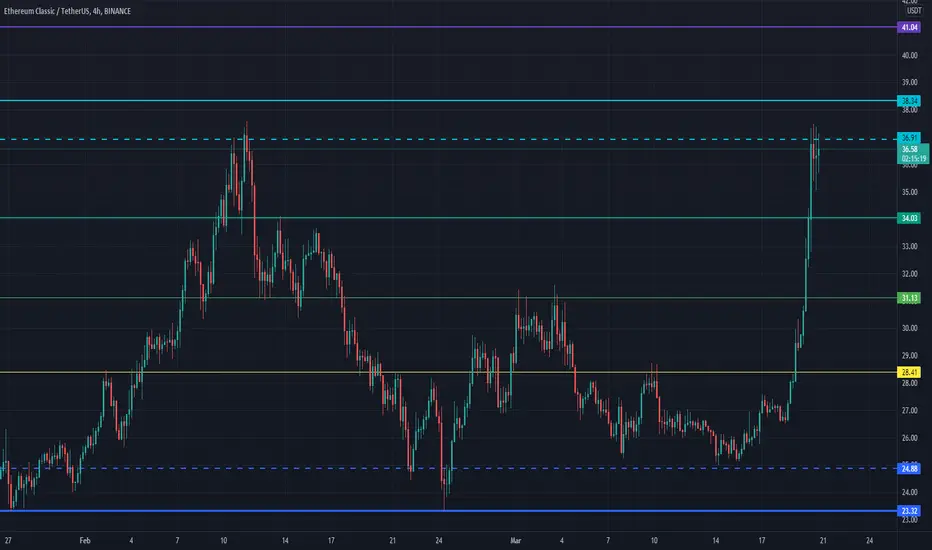
On 4 hours timeframe, we’re still expecting form out bearish pattern, currently its facing out the mid-term resistance zone.
--------------------
$ETC/USDT SHORT SETUP
Leverage : x3 - x5
Entry Price : 39 - 41
TP 1 : 37.35
TP 2 : 35.9
TP 3 : 34.4
TP 4 : 32.9
TP 5 : 31.45
TP 6 : 29.45
TP 7 : 28.15
TP 8 : 26.75
Stop Loss : 42.25
*Maximum 3% of Portfolio.
*Unload 12.5% at each TP. Whenever TP 2 hits, Move stop loss to entry.
--------------------

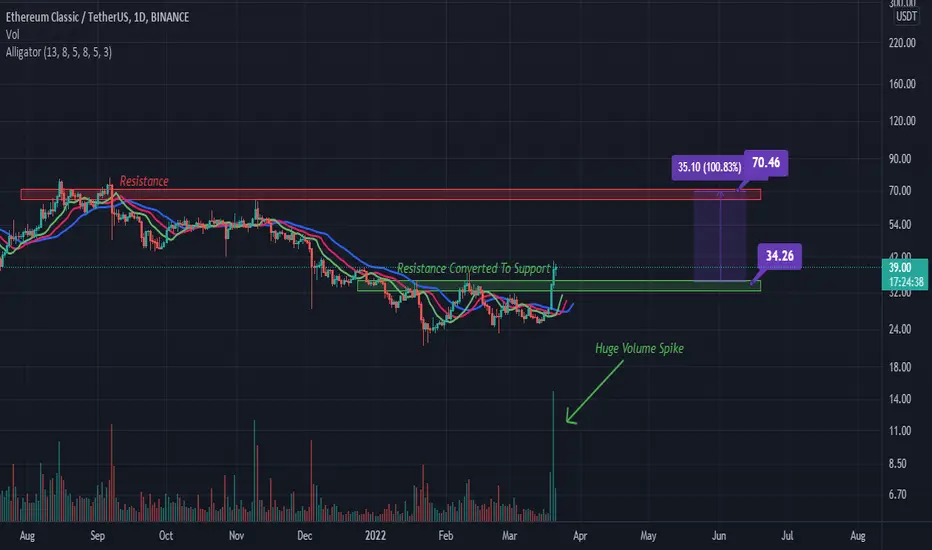
ETC Breakout!!! Tartget $70Hello everyone today i'm going analysis ETC/USDT pair
1)In my previous analysis ETC formed Inverse H&S and ETC must hit $45 price level, and soon
ETC will hit $45 level you can take some TP if you wanna at $45 level range,but in this analysis we look ETC other way, so let's see what we have.
2)ETC have nice Consolidation range at $24-$34,and we can call it Trading Range Bottoms also.
3)ETC had Resistance level at $34 approximately, now ETC breakout from $34 level with high Spike Volume, this Volume confirmed ETC breakout, now previous Resistance level converted to Support level, ETC have now acting support level at $34 price range level.
4)Now ETC can easily hit $70 level approximately because we don't have any Resistance level until hit $70 Resistance level.
5)We also use Alligator indicator in ETC chart,now price is above Alligator lines its Bullish signal
6)We can see Alligator Green line crossing in to Red and Blue lines,and Red line moving upward and crossing in to Blue line,and Blue line is now below Green and Red line, and now Blue line following direction of Green and Red lines, that's mean Alligator is opened his Jaw started hunting upwards trend.
If you like my analysis like and subscribe me)))
ETC/USDT (Futures) Update Short!#harmonicsignal #Crypto
ETC/USDT (Futures) Update
⬇️Short Signal
Entry at 39.5
⭕️SL @42
🔵TP1 @34.3
🔵TP2 @30
Move your SL to entry level after tp1 hitted.
Take out 75% at tp1 remaining for tp2
Only Risk 1% of your Equity.

ETCUSDT Midhigher to Daily tf Range Updated till 20-3-22ETCUSDT mid-higher to daily timeframe range, i can see only right swing setups that been worked which was safe too compare to other alt's . not as fancy as other alt's in the market. of course its not as easy as to pump it either. its an old alt with lots of holders and the more heavy it is the more money it needs to pump.so not as shinny as its top competitor less new retail interest it get caught but in crypto market we can always expect unexpected.
etc looking good etc is looking great to accumulate down here,
could potentially be close to breaking the down trend
hopefully you got in a week ago when i called

ETCUSDT, We are going to complete Wave CHello everybody
We hope that everyone are in profit in these days of market and a f.. war :(
According to the chart and last analysis that we published, the price was moving in downward trend and we can say that is moving in downward channel.
According to the Elliott theory now are in wave C and we need to complete it, We shown on chart one of the most powerful PRZ level that can the price impact it and ready to move upwards from this level.
But important thing is : PRZ Level is the zone that have power to change the trend not surely do it just have the power.
In these days until Feds event not happend do not trade because its risky for everyone, wait the market show us what gonna do :D
Observe to your capital management
Good Luck
Abtin
Very Previous analysis :D :D :

Ethereum Classic (ETC) - March 11Hello?
Traders, welcome.
If you "follow", you can always get new information quickly.
Please also click "Like".
Have a good day.
-------------------------------------
(ETCUSD 1W Chart)
(Full: )
Above 19.220 point: expected to continue uptrend (long-term perspective)
Above 36.280 point: Expected to create a new wave.
(1D chart)
38.376-49.785 section: section that determines the trend
Therefore, it is important to maintain the price above the 38376 point.
If the price declines below the 26.542 point, there is a possibility that it will fall near the 19.220 point, so you need to trade cautiously.
To turn into an uptrend, it must move above the 32.740 point.
However, it is expected that the upward trend will continue only when it rises above the 57.505 point.
The next volatility period is around March 22.
-------------------------------------
(ETCBTC 1W chart)
(All: )
0.0009 Above 70 points: Expected to create a new wave.
------------------------------------------
We recommend that you trade with your average unit price.
This is because, if the price is below your average unit price, whether the price trend is in an upward trend or a downward trend, there is a high possibility that you will not be able to get a big profit due to the psychological burden.
The center of all trading starts with the average unit price at which you start trading.
If you ignore this, you may be trading in the wrong direction.
Therefore, it is important to find a way to lower the average unit price and adjust the proportion of the investment, ultimately allowing the funds corresponding to the profits to be able to regenerate themselves.
------------------------------------------------------------ -------------------------------------------
** All indicators are lagging indicators.
Therefore, it is important to be aware that the indicator moves accordingly with the movement of price and volume.
However, for convenience, we are talking in reverse for the interpretation of the indicator.
** The MRHAB-O and MRHAB-B indicators used in the chart are indicators of our channel that have not been released yet.
(Since it was not disclosed, you can use this chart without any restrictions by sharing this chart and copying and pasting the indicators.)
** The wRSI_SR indicator is an indicator created by adding settings and options to the existing Stochastic RSI indicator.
Therefore, the interpretation is the same as the traditional Stochastic RSI indicator. (K, D line -> R, S line)
** The OBV indicator was re-created by applying a formula to the DepthHouse Trading indicator, an indicator disclosed by oh92. (Thanks for this.)
** Support or resistance is based on the closing price of the 1D chart.
** All descriptions are for reference only and do not guarantee a profit or loss in investment.
(Short-term Stop Loss can be said to be a point where profit and loss can be preserved or additional entry can be made through split trading. It is a short-term investment perspective.)
---------------------------------

ETC Ethereum ClassicETC looks clean we have one more step to hit the targets we need first to complete C wave which breaks 21.18 level before that i think its going to make a running flat or it will be ( C ) on WXYXZ before the dump 30%
peace :)

ETC/USDTETC Ascending Channel , Here is Box Trading for you , you can buy and sell inside the Red as a Resistance and Green as a Support Line
While trading keep your eyes on Bitcoin Behavior .
Drop Like and Comment.


ETCUSDT Analysis (perspective a couple of months)Hello friends.
Please support my work by clicking the LIKE button👍(If you liked). Also i will appreciate for ur activity. Thank you!
Everything on the chart.
Upward movement from the current price or through 20$.
Entry: market and lower
Target: 30 - 40 - 60
after first target reached move ur stop to breakeven
Stop: (depending of ur risk). ALWAYS follow ur RM .
risk is justified
Good luck everyone!
Follow me on TRADINGView, if you don't want to miss my next analysis or signals.
It's not financial advice.
Dont Forget, always make your own research before to trade my ideas!
Open to any questions and suggestions.

ETC LONGBINANCE:ETCUSDT
If you are looking for a good trend, one of the good offers is definitely this currency

ETC/USDT - Potential 293% SetpHello Traders!
ETC continues to move in a downtrend, completing the previous business cycle.
The price range of $11.30 - $14.50, from which the acceleration of upward movement began in the spring of 2021, will be a comfortable zone for formation of a medium-term position.
It will be necessary to close the position by stop-loss only in case of decrease of the price under the support level of $7.28.
It will be a good opportunity to fix profit on such deal within the price range of $29.00 - $44.50
Good luck and watch out for the market
P.S. This is an educational analysis that shall not be considered financial advice

ETC Daily TRADEscalping trade of ETC .
road to 33 ....
use Supports and resistances Which I drew on the chart .

🔻 ETC FALLING DOWN TO THE HELL🔻Hello investors and traders.
briefly open a short position if the daily candle closes below the EMA.
Disclaimer: this is not a piece of financial advice always do your own research.


Ethereum Classic (ETC) - February 14Hello?
Traders, welcome.
If you "follow", you can always get new information quickly.
Please also click "Like".
Have a nice day.
-------------------------------------
(ETCUSD 1W Chart)
(All: )
Above 19.220 point: expected to continue uptrend
Above the 36.280 point: Expected to revert to an uptrend.
You need to break out of the downtrend line to accelerate the uptrend.
(1D chart)
If the price is maintained by rising to the 38.376-49.785 section, it is expected to rise above the 57.505 point and continue the upward trend.
If it falls in the range of 14.363-19.220, it is highly likely to enter the mid- to long-term investment area, so careful trading is required.
------------------------------------------
(ETCBTC 1W chart)
0.0009 Above the 70 point: Expected to turn into an uptrend.
0.0018 16 - 0.0023 34 or higher: Expected to create a new wave.
------------------------------------------
We recommend that you trade with your average unit price.
This is because, if the price is below your average unit price, whether the price trend is in an upward trend or a downward trend, there is a high possibility that you will not be able to get a big profit due to the psychological burden.
The center of all trading starts with the average unit price at which you start trading.
If you ignore this, you may be trading in the wrong direction.
Therefore, it is important to find a way to lower the average unit price and adjust the proportion of the investment, ultimately allowing the funds corresponding to the profits to be able to regenerate themselves.
------------------------------------------------------------ -----------------------------------------------------
** All indicators are lagging indicators.
Therefore, it is important to be aware that the indicator will move accordingly as price and volume move.
However, for convenience, we are talking in reverse for the interpretation of the indicator.
** The MRHAB-O and MRHAB-B indicators used in the chart are indicators of our channel that have not been released yet.
(Since it was not disclosed, you can use this chart without any restrictions by sharing this chart and copying and pasting the indicators.)
** The wRSI_SR indicator is an indicator created by adding settings and options to the existing Stochastic RSI indicator.
Therefore, the interpretation is the same as the traditional Stochastic RSI indicator. (K, D line -> R, S line)
** The OBV indicator was re-created by applying a formula to the DepthHouse Trading indicator, an indicator disclosed by oh92. (Thanks for this.)
** Support or resistance is based on the closing price of the 1D chart.
** All descriptions are for reference only and do not guarantee a profit or loss in investment.
(Short-term Stop Loss can be said to be a point where profit and loss can be preserved or additional entry can be made through split trading. It is a short-term investment perspective.)
---------------------------------


ETC- Trend update (LONG)Hello trading friends,
This is a daily update for ETC with the trend expected for a long.
ETC looks to have a stable trend since the breakdown.
Grayscale owns this coin also depending on the dollar cost average - and it shows that it has the possibility of growing in the coming time.
It's always good to wait for confirmations and to buy into the red.
Interesting levels for uptrend are 46 USD, and 53 USD trend further also the important 64 USD level for long term.
Let's see how this coin will affect the coming time, and or it will get a breakout.
Most of the coins waiting for BTC - so it's important also to follow BTC trends - and price changes take also time.
At all times manage your risk well and have a great day.
If you like this idea - leave a like and follow - Thank you
This is not a trading call.


LRCUSDTIf the dynamic resistance breaks, it can grow 1.965613 in that range, we should wait for the price reaction, and if the dynamic resistance does not break, we should wait for the price correction to the range of 0.731310 and then to the range of 0.531501 and the reaction to the dynamic line.
