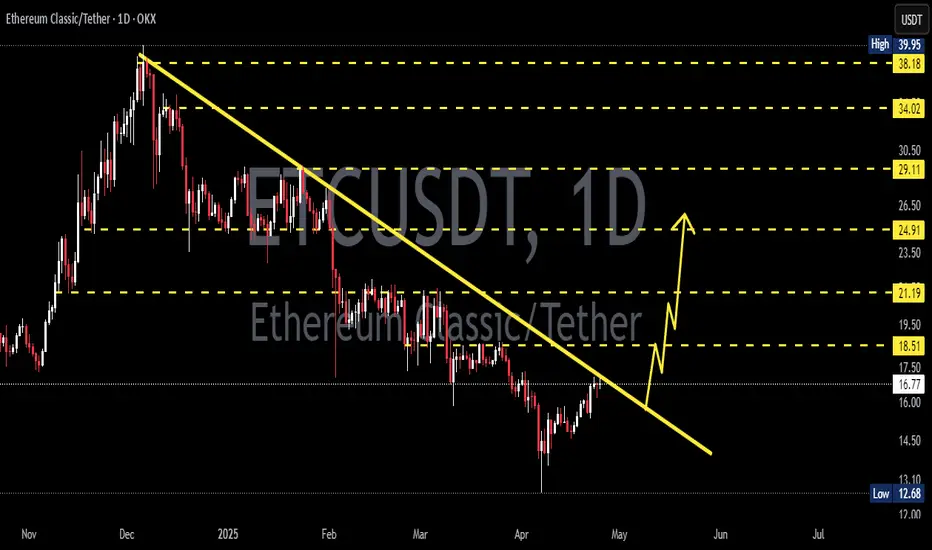
ETCUSDT 1D AnalysisETC ~ 1D Analysis
#ETC Buy after successfully penetrating this resistant line with a large volume, a minimum target of 10%+.
Etcusdtbuy
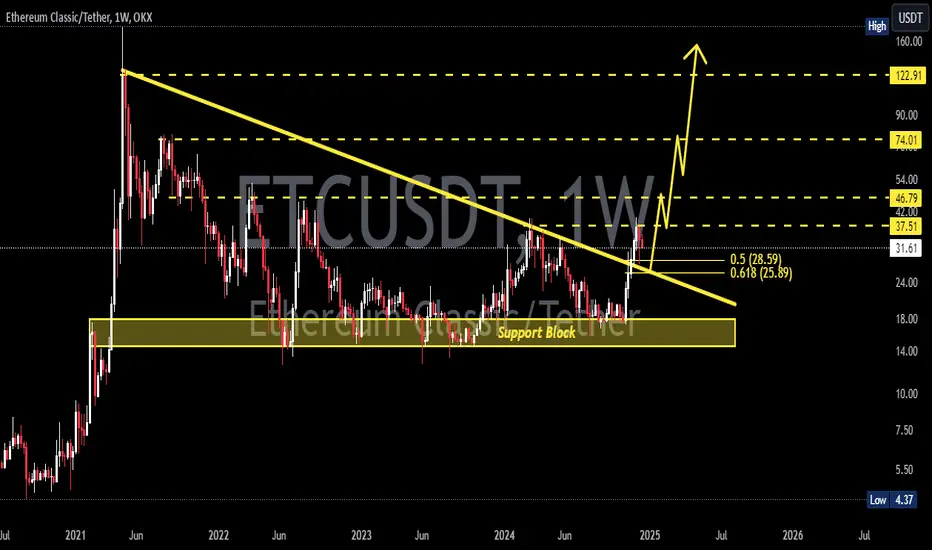
ETCUSDT 1WETC ~ 1W Analysis
#ETC Buy gradually from here if you still have a Conviction on this Coin with a minimum target of 20%+

ETCUSDT 1WETC Update ~ 1W
#ETC Entering the Bullish phase., If you still have Conviction on this coin,. Buy gradually on this Golden Fibonacci. With a minimum target of 20%++
#ETC/USDT#ETC
The price is moving in an ascending channel on the 12-hour frame and is sticking to it to a large extent
We have a bounce from a major support area in green at 17.70
We have a downtrend on the RSI indicator that was broken upwards, which supports the upward trend
We have a trend to stabilize above the 100 moving average, which supports the upward trend
Entry price 18.40
First target 20.38
Second target 22.33
Third target 24.37

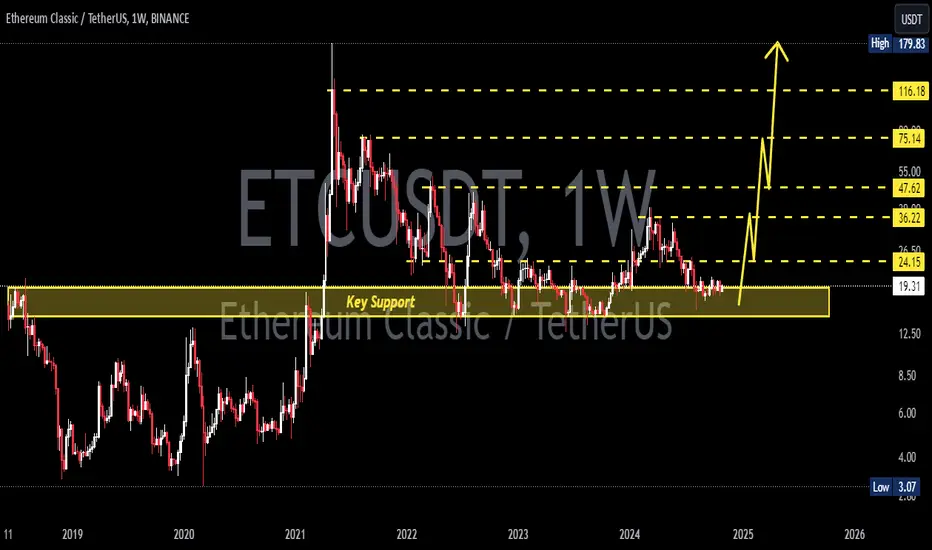
ETCUSDTETC ~ 1W
#ETC So far it continues to maintain this support block. Buy in stages here. with a target of at least 20%++ from here.
ETCUSDT Bullish Opportunity with XABCD Harmonic PatternOverview:
ETC/USDT has exhibited the formation of an XABCD harmonic pattern, coinciding with price action nearing a crucial support zone. This confluence suggests a potential bullish reversal from point D, indicating favorable trading opportunities for market participants.
Key Technical Observations:
1. XABCD Harmonic Pattern: The chart analysis reveals the emergence of an XABCD harmonic pattern, characterized by distinct price swings that conform to Fibonacci ratios. This pattern indicates a potential reversal zone, with point D signaling a probable shift in market direction.
2. Key Support Area: Price action has approached a significant support area, enhancing the likelihood of a bullish rebound. The convergence of the harmonic pattern and the support zone strengthens the validity of the anticipated bullish move.
Trade Recommendations:
- Entry: Consider initiating a long position near 32.8150, aligning with the anticipated bullish reversal at point D of the harmonic pattern.
- Stop Loss: Implement a stop-loss order at approximately 31.1750 to mitigate potential losses in case of adverse price movements.
- Take Profit Targets:
1. TP-1: Set the first take-profit level at 34.5800 to secure profits as the price advances in the bullish direction.
2. TP-2: Aim for the second take-profit level at 36.1933 to capitalize on further upward momentum.
3. TP-3: Consider a third take-profit target at 37.8760 to maximize returns as the bullish trend potentially extends.
Risk Management:
Maintain prudent risk management practices by adhering to the specified stop-loss level and adjusting position sizes according to individual risk tolerance. Periodically reassess the market conditions to adapt trading strategies accordingly.
Conclusion:
In summary, the technical analysis of ETC/USDT suggests a favorable outlook for bullish opportunities, supported by the formation of an XABCD harmonic pattern and price action nearing a critical support area. Traders are advised to consider the provided trade setup, incorporating appropriate risk management measures to optimize potential returns while safeguarding against downside risks.

ETC target 2612h time frame
-
ETC is breaking and retesting the bottom triangle and getting support at 0.5 Fibonacci Retracement. Considering the symmetrical structure and previous highs, there are lots resistance zones which will provide pressure for price. However, we can still set a trading plan woth good risk to reward ratio here.
TP: 26 / 38
SL: 17.295

ETC target 3812h time frame
-
ETC is still under the downtrend so far.
The best entry is wait for breakout and retest the structure.
TP: 38
SL: 16.8

Trading opportunity for ETCUSDTBased on technical factors there is a long position in :
📊 ETCUSDT
🔵 Long Now 25.82
🧯 Stop loss 24.02
🏹 Target 1 28.20
🏹 Target 2 31.50
💸Capital : 1%
We hope it is profitable for you ❤️
Please support our activity with your likes👍 and comments📝

ETC/USDT HAS POTENTIAL TO PUMP 70%!!Hi guys, This is CryptoMojo, One of the most active trading view authors and fastest-growing communities.
Do consider following me for the latest updates and Long /Short calls on almost every exchange.
I post short mid and long-term trade setups too.
Let’s get to the chart!
I have tried my best to bring the best possible outcome in this chart, Do not consider it as financial advice.
Welcome to this ETC/USDT update. ETC looks very promising here.
Long ETC/USDT
Entry range:- CMP and more up to $23.90
Target:- 70%
SL:- $22
This chart is likely to help you in making better trade decisions if it did consider upvoting this chart.
Would also love to know your charts and views in the comment section.
Thank you

ETCUSDT- Falling Wedge PatternETCUSDT- (4h Chart) Technical analysis
ETCUSDT- (4h Chart) Currently trading at $37.25
Buy level: Above $38
Stop loss: Below $34
Target 1: $39
Target 2: $43
Target 3: $48
Target 4: $52
Max Leverage 3x
Always keep Stop loss
Follow Our Tradingview Account for More Technical Analysis Updates, | Like, Share and Comment Your thoughts

ETC/USDT HAS POTENTIAL TO PUMP 100%!Hi guys, This is CryptoMojo, One of the most active trading view authors and fastest-growing communities.
Do consider following me for the latest updates and Long /Short calls on almost every exchange.
I post short mid and long-term trade setups too.
Let’s get to the chart!
I have tried my best to bring the best possible outcome in this chart, Do not consider it as financial advice.
Welcome to this ETC/USDT update. ETC looks very promising here.
Long ETC/USDT
Entry range:- CMP and more up to $37.50
Target:- 100%
SL:- $35
This chart is likely to help you in making better trade decisions if it did consider upvoting this chart.
Would also love to know your charts and views in the comment section.
Thank you

Ethereum ClassicHello traders. The price will fall to the bottom of the downtrend channel and return to 19$. Are you agree?

💡Don't miss the great buy opportunity in ETCUSD @eth_classicTrading suggestion:
". There is a possibility of temporary retracement to the suggested support line (51.53).
. if so, traders can set orders based on Price Action and expect to reach short-term targets."
Technical analysis:
. ETCUSD is in an uptrend, and the continuation of the uptrend is expected.
. The price is below the 21-Day WEMA, which acts as a dynamic resistance.
. The RSI is at 66.
Take Profits:
TP1= @ 53.87
TP2= @ 56.07
TP3= @ 58.28
TP4= @ 61.07
TP5= @ 65.30
SL= Break below S2
❤️ If you find this helpful and want more FREE forecasts in TradingView
. . . . . Please show your support back,
. . . . . . . . Hit the 👍 LIKE button,
. . . . . . . . . . Drop some feedback below in the comment!
❤️ Your support is very much 🙏 appreciated!❤️
💎 Want us to help you become a better Forex / Crypto trader?
Now, It's your turn!
Be sure to leave a comment; let us know how you see this opportunity and forecast.
Trade well, ❤️
ForecastCity English Support Team ❤️

EtcusdtEthereum Classic (ETC) is a decentralised, blockchain-based, open-source computing platform, as well as a cryptocurrency. It allows developers to build and deploy smart contracts—autonomous, self-executing code blocks that trigger certain actions based on predefined conditions.

Ethereum Classic Will pump to 77 #ETC needs to close 4H above the resistance level in 60 bucks then next targets are available
Targets : 77 - 82 - 95

ETCUSDT (Ethereum Classic) : Just Bought That ... ✅Let's buy Some #ETCUSDT (Ethereum Classic) ✅ , Shall We ?? Amazing Chart , Isnt it ?? ✅
In order to buy, the SL (stop loss) and capital management must be observed.
All resistances and TPs (take profits) are marked on the chart.
(DYOR)

