S&P 500 ETF & Index Hit Resistance – A Technical Warning Shot 📉⚠️ S&P 500 ETF & Index Hit Resistance – A Technical Warning Shot 🔍🧠
Following up on the video I just posted , I had to share this updated chart of the VOO ETF (Vanguard S&P 500) and US500 Index , now that both are testing key resistance levels.
On the left: AMEX:VOO has reached the very top of a multi-year ascending channel—a zone that has historically triggered sharp corrections. The level at 590.85 marks a major resistance zone.
On the right: The US500 Index is showing a similar technical overextension, trading just under 6,450, with 5,928.25 as the nearest support below.
🎯 Technicals at play:
VOO could retrace toward 526.17 and potentially 465.72, both of which are solid technical supports within this channel.
This setup doesn't mean panic—but it does argue for caution, especially after such an extended run.
🧠 And yes, the Buffett Indicator (Stocks-to-GDP) continues to point toward an overheated market . While it's not a timing tool, it adds macro weight to the technical signals.
In the video, I also touched on:
Taking profits on NASDAQ:NVDA after a near-perfect technical rejection at target.
Reviewing Rolls Royce nearing upper channel resistance.
Gold and Silver at inflection points—likely to be impacted if equities begin to unwind.
Rotational potential into Bitcoin and Ethereum, which may benefit from macro shifts.
This is how I trade: respect structure, stay proactive, and prepare before the move—not after. Let me know how you’re positioning or if you’re sitting on hands waiting for a dip.
One Love,
The FX PROFESSOR 💙
Disclosure: I am happy to be part of the Trade Nation's Influencer program and receive a monthly fee for using their TradingView charts in my analysis. Awesome broker, where the trader really comes first! 🌟🤝📈
ETF

S&P 500 ETF & Index– Technicals Hint at a Possible Correction📉📊 S&P 500 ETF & Index at Resistance – Technicals Hint at a Possible Correction 🔍⚠️
Everything here is pure technicals— but sometimes, the market whispers loud and clear if you know how to listen. 🧠📐
The VOO ETF, which tracks the S&P 500 , has now reached the upper boundary of a long-term ascending channel, once again brushing against resistance near 590.85. This zone has consistently led to major pullbacks in the past.
On the right panel, the US500 Index mirrors this move—pushing toward all-time highs, right as broader sentiment turns euphoric. Technically, both charts are overextended and pressing into key zones.
👀 Potential Path:
🔻 Rejection from current zone ➝ Down toward 526.17, then 465.72 (green support channel)
🔁 Possible bounce after correction — trend still intact long term
And while we’re keeping it technical, it’s worth noting that the Buffett Indicator (Stocks-to-GDP) i s currently screaming “overvaluation.” This doesn't predict timing—but it adds macro context to an already overheated chart setup.
The lesson? Price respects structure. Whether or not the fundamentals are in agreement, the charts are warning that now may not be the time to chase.
History doesn’t repeat, but it often rhymes. Stay sharp, stay technical. 🎯
One Love,
The FX PROFESSOR 💙
ps. the beauty of these levels? Tight Stop loss- excellent R/R
Disclosure: I am happy to be part of the Trade Nation's Influencer program and receive a monthly fee for using their TradingView charts in my analysis. Awesome broker, where the trader really comes first! 🌟🤝📈

ETH - BTC ETF News: What It Means for the Market+ China Rumors 🚨 ETH - BTC ETF News: What It Means for the Market + China Rumors 💥🌐
July just ended with a crypto bombshell 💣 — and the market is barely reacting.
Let’s break it down:
🧠 One part hard news.
🌀 One part geopolitical smoke.
🎯 All parts worth watching if you care about macro market shifts.
🏛️ SEC Approves Real BTC & ETH for ETF Flows (July 29)
Say goodbye to the cash-only ETF model.
The SEC now allows direct in-kind creation/redemption of Bitcoin and Ethereum in ETFs.
That means providers like BlackRock, Fidelity, VanEck can now use actual BTC/ETH, not just synthetic tracking.
✅ Bullish Impact:
💰 Real Spot Demand: ETF inflows = real crypto buying
🔄 Efficient Arbitrage: No middle step via cash = faster flows
🧱 TradFi + Crypto Merge: ETFs now settle with crypto — not just track it
🎯 Better Price Accuracy: Spot ETFs reflect true market value more cleanly
📉 The market reaction? Mild.
But don’t get it twisted — this is a structural reset, not a meme pump.
⚠️ But There’s a Bearish Angle:
🏦 Centralized Custody: Crypto now lives in Coinbase, Fireblocks vaults
⚠️ Network Risks: ETF performance now tied to ETH/BTC uptime
🧑⚖️ Regulatory Overreach: More hooks into validator networks, MEV relays
🌊 Volatility Risk: Panic redemptions = real BTC/ETH sold into open markets
Still, this is good news for Ethereum in particular.
Why? Because ETH isn’t just money — it’s infrastructure.
And now Wall Street is finally using it, not just watching it.
🇨🇳 And Then There’s China… Rumor or Tumor?
Crypto Twitter is swirling with unconfirmed whispers from July 29 that China may be prepping a major Bitcoin statement ahead of the BRICS summit.
But let’s be clear:
🚨 It’s a rumor. Or a tumor. 🧠
And like many tumors in crypto — there’s a 40% chance it brings bad news. 🤕
Still, here’s what’s being floated:
🧠 Speculations Include:
🔓 BTC re-legalization in “special finance zones” (HK-style)
🏦 BTC in national reserves (!)
🤖 CBDC integration or smart contract interoperability
⚒️ Return of official state-backed Bitcoin mining
🧯 But no official sources. Just geopolitics + timing.
China’s FUD/FOMO pattern is Bitcoin tradition — don’t get trapped by hopium.
But if even half of it is true... buckle up.
📈 Ethereum Leads the Charge — But Watch These Alts:
If ETFs go fully crypto-native, some sectors light up 🔥
🔹 1. Ethereum Layer 2s (ARB, OP, BASE)
→ ETF gas pressure = L2 scaling demand
🔹 2. DeFi Protocols (UNI, AAVE, LDO)
→ TradFi liquidity meets on-chain utility
🔹 3. ETH Staking Derivatives (LDO, RPL)
→ Institutions want yield = LSD narrative grows
🔹 4. Oracles (LINK)
→ ETFs need trusted on-chain data = Chainlink shines
🔹 5. BTC on ETH Bridges (ThorChain, tBTC)
→ If BTC flows into ETH-based ETFs, bridges light up
🚫 What I will Avoid:
❌ Memecoins – zero relevance to ETF flows
❌ GameFi – not part of TradFi’s roadmap
❌ Ghost Layer 1s – no users, no narrative, no pump
🧠 My Take:
ETH is building momentum toward $4,092 — the third breakout attempt on your 1-2-3 model.
🔥 The fuse is lit. Target? $6,036
Timing? Unknown. But structure is in place.
Meanwhile, Bitcoin Dominance is rising.
ETH is shining.
Solana — while powerful — continues paying the price for memecoin madness 💀
We’re entering a new phase — where ETFs settle with real crypto , China watches the stage, and macro money is warming up behind the curtain.
So stack smart.
Study the flows.
Don’t let silence fool you — the biggest moves come after the news fades.
One Love,
The FX PROFESSOR 💙
Disclosure: I am happy to be part of the Trade Nation's Influencer program and receive a monthly fee for using their TradingView charts in my analysis. Awesome broker, where the trader really comes first! 🌟🤝📈

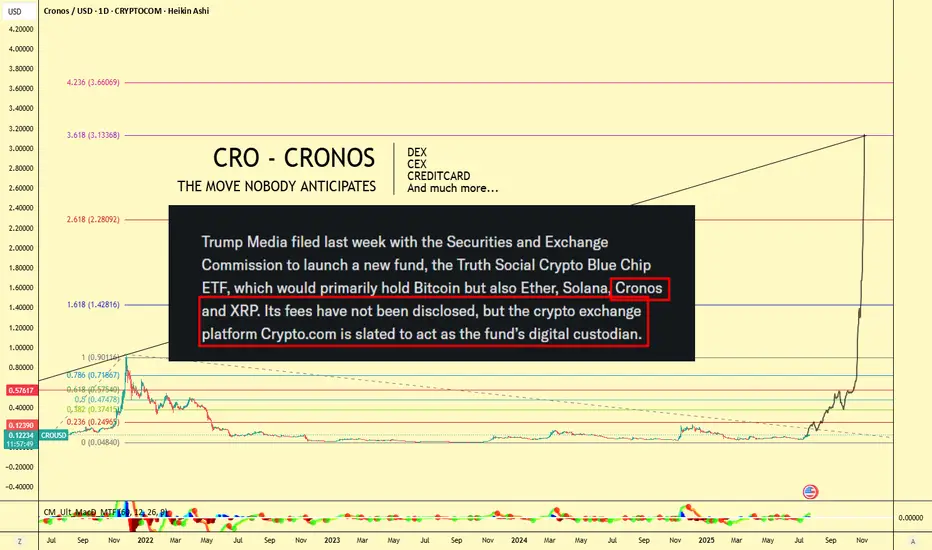
CRO (Crypto.com) $3 Target! Don't Miss This Move🪙 Ticker: OKX:CROUSDT
🕰 Chart: 1D (Heikin Ashi)
🔧 Tools Used: Fibonacci Extension, Fundamental News (ETF Filing)
🔍 Chart Analysis: Fibonacci Extension Targeting $3+
The Fibonacci Extension tool has been applied to the major CRO impulse wave from its peak near $0.90 (late 2021) to the 2022–2023 bottom at $0.0484, confirming a multi-year retracement and consolidation period.
Let’s break down the major Fib levels:
Extension Level Price Target
0.236 $0.2495
0.382 $0.3741
0.618 $0.5745
1.0 $0.9011
1.618 $1.4281
2.618 $2.2809
3.618 $3.1336
📌 Current Price: ~$0.12
🔥 Upside Potential to $3.13+ — a 25x move from current levels if full extension plays out!
📣 Fundamental Catalyst: CRO in Trump Media ETF
According to the chart note (sourced from SEC-related headlines):
"Trump Media filed with the SEC to launch a new ETF, the Truth Social Crypto Blue Chip ETF, which would primarily hold Bitcoin, but also Ether, Solana, Cronos (CRO), and XRP."
Even more important:
"Crypto.com is slated to act as the fund’s digital custodian."
This is massive fundamental validation for CRO — not just as a token, but as an ecosystem and financial infrastructure provider.
🌐 Why Crypto.com Matters: Utility, Ecosystem, Adoption
Crypto.com isn't just an exchange — it's a comprehensive Web3 ecosystem, which includes:
🔁 CEX (Centralized Exchange):
Buy, sell, stake, and trade hundreds of cryptocurrencies with high liquidity and low fees.
🔄 DEX (Decentralized Exchange):
Cronos Chain supports decentralized trading and DeFi apps — with low gas fees and EVM compatibility.
💳 Visa Credit Card Integration:
Crypto.com offers one of the most popular crypto Visa debit cards — earn cashback in CRO and enjoy perks like Spotify/Netflix rebates.
📱 Mobile Super App:
Buy/sell/stake/farm on-the-go with a seamless user interface.
📈 Earn & Lending Services:
Stake CRO or other assets for up to double-digit yields.
🤝 Strategic Partnerships
Crypto.com has been aggressively investing in brand and adoption:
🏟 Official partner of UFC, FIFA World Cup, and Formula 1
🏀 NBA’s Los Angeles Lakers Arena naming rights (Crypto.com Arena)
💼 Member of Singapore's regulated exchanges
🔐 ISO/IEC 27701:2019, PCI:DSS 3.2.1, and SOC 2 compliance — one of the most secure platforms in the industry
🧠 Conclusion: The Perfect Blend of TA + FA
With CRO being included in a potential U.S.-regulated ETF, the Crypto.com ecosystem booming, and technical patterns pointing to a Fib-based target above $3, CRO might be the sleeper play of the next bull run.
"The move nobody anticipates" might just be the most explosive one.
🎯 Short-Term Targets:
$0.25
$0.37
$0.57
🎯 Mid-Term Bull Targets:
$0.90 (prior ATH)
$1.42
$2.28
🎯 Full Cycle Extension:
$3.13
📢 Let me know in the comments:
Are you holding GETTEX:CRO ? What do you think about its inclusion in the ETF?
#CRO #CryptoCom #ETF #TrumpMedia #Altcoins #Bullrun #CryptoTrading #DeFi #FibTargets #CronosChain
ARKK: when a breakout isn’t just a breakout-it’s a runway to $91On the weekly chart, ARKK has broken out of a long-standing ascending channel, ending a year-long consolidation phase. The breakout above $71.40, with a confident close and rising volume, signals a transition from accumulation to expansion. The move came right after a golden cross (MA50 crossing MA200), further confirming institutional interest. Price has already cleared the 0.5 and 0.618 Fibonacci retracements — and the 1.618 extension points to $91.40 as the next technical target.
Momentum indicators like MACD and stochastic remain bullish with room to run. Volume profile shows low supply above $75, which could fuel an acceleration toward the target zone.
Fundamentally, ARKK remains a high-beta, high-risk vehicle — but one with focus. The ETF is positioned around next-gen tech: AI, robotics, biotech, and automation. Assets under management now exceed $9.3B with +$1.1B net inflow in 2025. YTD return stands at 37%, and its top holdings (TSLA, NVDA, COIN) are back in favor. This isn’t just a bet on innovation — it’s diversified exposure to a full-blown tech rally.
Tactical setup:
— Entry: market $69.50 or on retest
— Target: $80.21 (1.272), $91.40 (1.618 Fibo)
Sometimes a breakout is just technical. But when there’s volume, a golden cross, and billions backing it — it’s a signal to buckle up.

LITCOIN BUY OR SELL !!!Hello friends🙌
🔊According to the price drop, you can see that the price has been below the specified resistance for a while and when it was able to break the resistance, it shows us the power of the buyers. Now, when we return to the previous resistance, which has now become a support, you can see that the buyers are providing good support and the price is expected to move to the specified targets.
Note that the most important rule in trading is capital and risk management So make sure to follow it.
🔥Follow us for more signals🔥
*Trade safely with us*

XRP : ETF...Hello dears
Considering the good growth we had, you can see that the price is stuck in a long-term range and has not managed to break it yet...
We must be prepared for any scenario, so the best thing to do is to buy stepwise, of course with capital and risk management.
Note that this analysis is on a daily time frame and may take a while, so if you are not patient, do not enter.
*Trade safely with us*

Do we continue the wedge…Bonds have been hit hard and Crypto at Ath trend lines, do we need to finish the wedge
SOXL — Buying on a Strong Uptrend with 30%+ Profit PotentialDirexion Daily Semiconductor Bull 3x Shares (SOXL) continues to move in a clear uptrend after breaking long-term resistance. Price is consolidating above the breakout level, indicating sustained interest from major market participants.
Long positions remain valid.
Profit targets:
First target — 39.85
Second target — 60.42
The setup offers over 30 percent profit potential. The semiconductor sector continues to lead the broader market higher.
Focus on trading with the trend. Adding on pullbacks is reasonable with proper risk management in place.

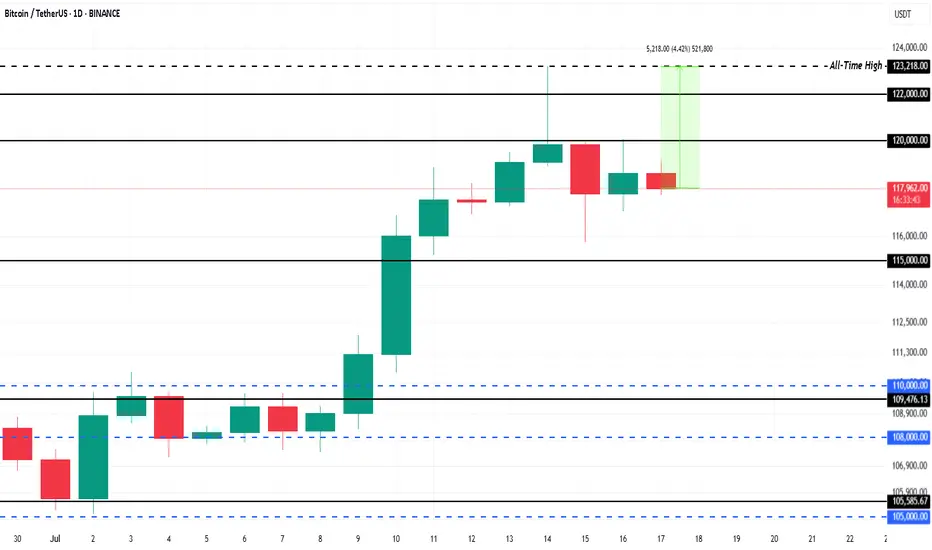
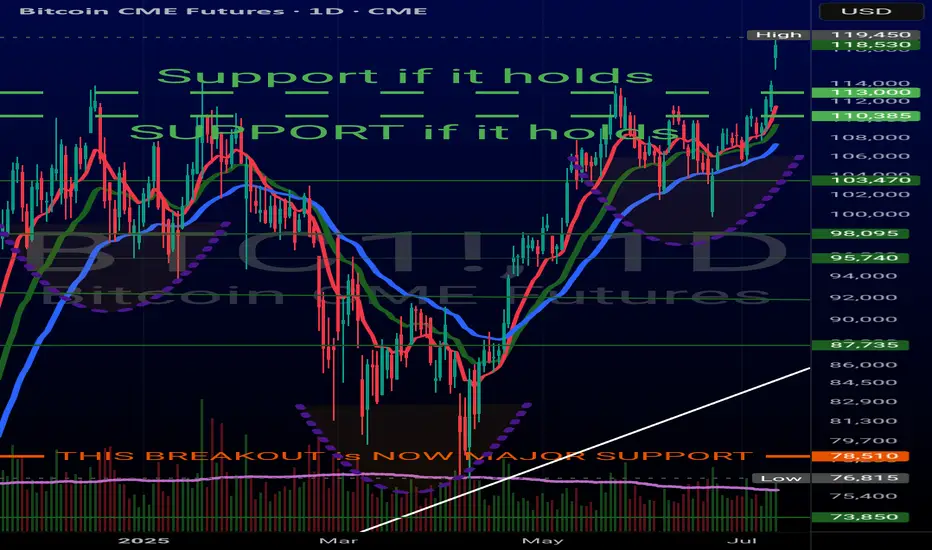
$1.5 Billion ETF Inflows Could Push Bitcoin Price 4% to New ATHBINANCE:BTCUSDT is currently trading at $118,325, facing resistance at the $120,000 level. This resistance is crucial for Bitcoin if it wants to break back to its ATH of $123,218 . The 4.4% gap to reach the ATH indicates potential for growth, but Bitcoin needs to secure support above $120,000 for this to happen.
This week, spot BINANCE:BTCUSDT exchange-traded funds (ETFs) saw over $1.5 billion in inflows , a significant portion of which occurred in the last 48 hours during Bitcoin’s dip.
The influx of institutional money highlights that investors are confident in Bitcoin’s potential despite the market cooling. If this trend persists, it could propel BINANCE:BTCUSDT price upward, as institutional support provides stability.
If BINANCE:BTCUSDT can hold above $120,000 and push past $122,000, it could continue its ascent toward new all-time highs. The current market conditions and ETF inflows support a bullish outlook, with a significant chance of breaking the resistance.
However, the risk of profit-taking remains , which could lead to a price drop. If BINANCE:BTCUSDT faces selling pressure, it could fall back to $115,000 , erasing a portion of recent gains. This would invalidate the bullish thesis, causing Bitcoin to retest lower support levels.
LITCOIN : So what is an ETF ?Hello friends
Be careful with the recent fluctuations of this coin because the movements of this coin have become unpredictable and we suggest that if you want to buy, buy in the specified support areas and in steps, of course with capital and risk management...
We have also specified targets for you.
*Trade safely with us*

Beautiful Bitcoin breakout, as called. PLEASE SEE PROFILE FOR MORE INFO!
What an absolutely gorgeous Inverse Head & Shoulder for #Bitcoin.
Had suspicion this time WAS different for #BTC.
Let's talk ROUGH ESTIMATES for social #gold.
CRYPTOCAP:BTC is no longer a hard to anticipate as it's become an institutional asset. Follow the $, volume. ETF's are performing similar. Leveraged funds, not so much
Anyway, enjoy the ride #Crypto!
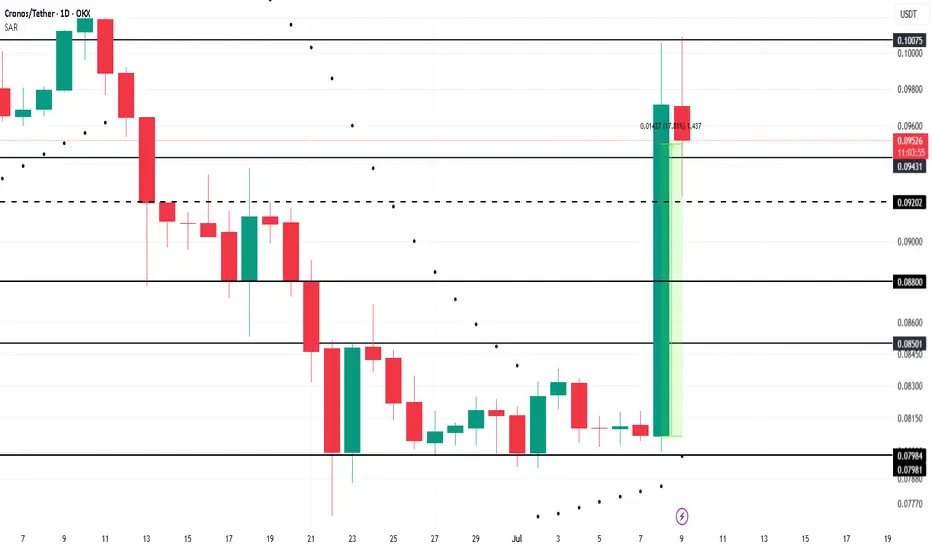
Cronos Rallies 18% After Truth Social Files for Blue-Chip ETFOKX:CROUSDT is a leading candidate for a Binance listing this month, following the proposed Crypto Blue-Chip ETF filed by Truth Social with the SEC. The fund includes 70% Bitcoin, 15% Ethereum, 8% Solana, 5% Cronos, and 2% XRP , positioning Cronos as a key asset in the fund.
Of the tokens in the proposed fund, only Cronos (CRO) is not currently listed on Binance. If the SEC approves the Crypto Blue-Chip ETF, Binance could fast-track the listing of Cronos . This move would likely draw more liquidity and investor interest toward CRO, fueling its price growth.
OKX:CROUSDT price surged by 17.8% over the last 24 hours, signaling strong momentum. If the ETF listing is approved and Binance acts swiftly, CRO could break through key resistance levels, potentially surpassing $0.1007. This upward movement would benefit investors, continuing the positive trend for the altcoin.
Bitcoin - Will Bitcoin record a new ATH?!Bitcoin is above the EMA50 and EMA200 on the four-hour timeframe and is in its medium-term ascending channel. Maintaining the specified support area will lead to the continuation of Bitcoin’s upward path and recording a new ATH. If it is corrected, we can look for Bitcoin buying positions from the specified demand zones.
It should be noted that there is a possibility of heavy fluctuations and shadows due to the movement of whales in the market and compliance with capital management in the cryptocurrency market will be more important. If the downward trend continues, we can buy within the demand area.
In recent days, Bitcoin has been stabilizing in a price range of around $107,000, with the market simultaneously witnessing a combination of short-term volatility and massive accumulation by institutional investors. A close examination of Bitcoin’s fundamental parameters shows that the market has entered a different phase than in the past; one that is no longer driven solely by momentary excitement, and that structured capital flows and on-chain data have formed its main axis. At the forefront of this trend are Bitcoin spot investment funds (Bitcoin ETFs), which reached their highest level of capital inflows in June. Total net inflows of these funds reached more than $4.5 billion last month, and on some days even approached more than $1 billion. Funds such as BlackRock’s IBIT and Fidelity’s FBTC now have billions of dollars in assets under management, a clear sign of increasing institutional participation in the Bitcoin market. These institutional investors are accumulating Bitcoin not with a short-term view, but with a long-term view and through legal means, which has reduced selling pressure and increased market stability.
On the other hand, the data from Anchin clearly shows that the market is in a steady accumulation trend. The amount of old Bitcoins held for more than 8 years experienced a significant growth of 5% in the second quarter of 2025. This statistic shows that long-term investors are not only reluctant to sell, but are still accumulating their assets. Also, the MVRV ratio, which indicates the relative profit or loss of the market, has decreased from 2.29 to 2.20, indicating mild and controlled profit taking by some investors, rather than widespread selling pressure or general panic. This rational behavior is a sign of market maturity and investors’ intelligence in managing short-term profits.
On-chain activity data also shows a similar trend. The average daily active addresses have reached around 1.02 million, indicating a decrease in market inflammation while maintaining overall dynamism. Other indicators such as Liveliness and Whale Accumulation also confirm that the amount of old transaction traffic has decreased and whales are mainly accumulating, not supplying. This trend is very valuable, especially in a market that has been far from explosive growth. From a macro perspective, the Bitcoin market is clearly in a consolidation and accumulation phase, but this consolidation is based on much stronger foundations than in previous periods. Institutional capital inflows via ETFs have reached over $50 billion, providing a strong foundation for continued growth. Also, some very old wallets that have been inactive for nearly 14 years have recently woken up and moved around $2 billion worth of Bitcoin. Although this could be a sign of potential supply, the market has not yet seen a significant negative reaction to it in the current market conditions and the market remains cautious.
Analysts believe that Bitcoin is in the third phase of its bullish cycle after the halving, which could bring gains of more than 120%. Some forecasts suggest a price range of $200,000-250,000 by the end of this year; however, the realization of such levels is subject to stable macroeconomic data, ETF performance and the absence of severe geopolitical shocks.
Finally, it can be said that the Bitcoin market has now reached a maturity where even periods of consolidation tend to strengthen its fundamentals rather than weaken the market. High-powered institutional investors are entering, whales continue to accumulate instead of selling, and long-term investors also see a bright outlook for the coming months. In this phase, price levels of $125,000 to $140,000 are likely by the end of the summer if the current trend continues, while in the event of severe economic or political pressures, key support for Bitcoin will be in the $95,000 to $100,000 range. Overall, Bitcoin is moving slowly but steadily towards higher targets, with stronger support than at any time in its history.

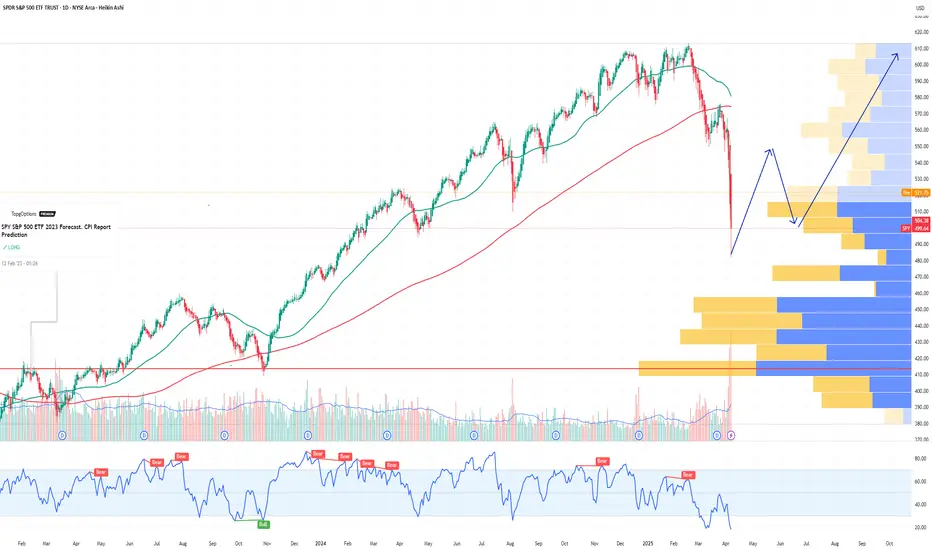
SPY (S&P500 ETF) - Daily Golden Cross and All-Time-High PriceSPY (S&P500 ETF) price has reached all-time-highs in July 2025, after a SMA Golden Cross printed on the daily chart.
SPY is still in a price uptrend since May 2025, however a higher-low pullback has not occurred for the past two weeks.
Resistance levels: $625, $630, $635, $640.
Support levels: $622, $617, $614, $611.
A significant reversal or bearish candle pattern has not occurred yet on either the daily or weekly charts.
The Stochastic RSI indicator has reached overbought levels, both on the Daily chart and Weekly chart.
Stock market earnings season begins in July 2025, trade deal negotiations and new tariffs are in progress this week. Volatility could increase this month due to these news catalysts.

LITECOIN (LTC) - On The Verge Of Exploding - ETF Catalyst?Litecoin: A Decentralized Network with a Differentiated Risk Profile
Litecoin (LTC), launched in 2011 by former Google engineer Charlie Lee, is one of the oldest and most active Layer-1 blockchain networks in the cryptocurrency space. Often referred to as the “digital silver” to Bitcoin’s “digital gold,” Litecoin was designed to offer faster transactions, lower fees, and broader accessibility while maintaining a similar monetary policy and codebase.
This post aims to provide an overview of Litecoin’s technical structure, usage, risk profile, and current developments—without speculative bias—so readers can form their own assessments.
1. Transparent Origins and Founder Dynamics
One key difference between Litecoin and Bitcoin lies in the identity of their respective creators. Bitcoin was developed by Satoshi Nakamoto, a pseudonymous and still-unknown individual or group, who is estimated to hold 750,000 to 1.1 million BTC—a significant portion of the total supply that has never moved. The dormant status of these holdings has occasionally raised concerns about future market impact if they were ever activated.
In contrast, Litecoin was founded by Charlie Lee, a known and public figure who was active in the community before, during, and after the launch. In 2017, Lee announced he had sold or donated nearly all his LTC holdings to avoid any potential conflict of interest. Today, no founder or insider is known to hold a disproportionate share of the Litecoin supply. This level of transparency and decentralization has been interpreted by some as a factor that lowers long-term governance and concentration risk.
2. Structural Simplicity and Leverage Exposure
Another distinction between Litecoin and Bitcoin lies in market structure and exposure to leverage.
Bitcoin is widely used as collateral in crypto lending markets and institutional derivatives, including perpetual futures and structured products. This has introduced significant systemic risk during periods of market stress, as high leverage has historically led to cascading liquidations across centralized and decentralized platforms.
Litecoin, in contrast, has relatively limited exposure to leveraged products and collateralized lending. It is not commonly used as collateral in CeFi or DeFi protocols, and institutional futures markets for LTC are smaller and less active. As a result:
Litecoin is less likely to trigger or be affected by mass liquidations
It has reduced systemic risk due to lower market entanglement
Its price tends to reflect more organic supply/demand dynamics
It is less involved in cross-collateralized or rehypothecated loan systems
This simpler structure may appeal to risk-aware investors looking for cleaner exposure without the reflexivity effects common in heavily leveraged markets.
3. Scarcity and Monetary Policy
Litecoin shares a similar deflationary model with Bitcoin, with a hard cap of 84 million LTC and scheduled halving events every four years. The most recent halving occurred in August 2023, reducing the block reward from 12.5 to 6.25 LTC per block.
With over 75 million LTC already mined, fewer than 9 million remain in future issuance. The protocol’s monetary policy is deterministic and cannot be altered unilaterally, which may appeal to those who prioritize predictable supply and inflation resistance.
While Litecoin’s cap is four times higher than Bitcoin’s, the relative issuance schedule and halving dynamics mirror Bitcoin’s design. Some investors view this as a hedge against fiat currency debasement, although the asset's volatility and adoption context should be taken into account.
4. Network Fundamentals and Real-World Use
Litecoin has maintained near 100% uptime since inception, and its transaction throughput and fee structure are generally favorable compared to many competing networks.
In 2024, Litecoin became the most used crypto for payments via BitPay, surpassing Bitcoin in transaction volume, driven by its fast 2.5-minute block times and low transaction fees. It is supported by major platforms including PayPal, and accepted by thousands of online and retail merchants.
From a security perspective, Litecoin’s hashrate reached all-time highs in 2025, partly due to merge-mining with Dogecoin, which has helped strengthen its proof-of-work infrastructure. Network upgrades like MWEB (MimbleWimble Extension Blocks) have added optional privacy layers to Litecoin’s UTXO model, while Lightning Network integration supports instant payments.
These developments suggest that Litecoin continues to evolve, with emphasis on efficiency, user privacy, and practical usability.
5. Institutional Presence and ETF Outlook
Litecoin has seen modest but growing institutional involvement. Products such as the Grayscale Litecoin Trust (LTCN) have existed for several years, and Coinbase introduced Litecoin futures trading in 2024. Fidelity also offers LTC trading and custody to institutional clients.
More notably, a Spot Litecoin ETF application is currently under review by the U.S. Securities and Exchange Commission (SEC), with analysts from Bloomberg estimating a 95% probability of approval before the end of 2025. If approved, this would make Litecoin one of the first proof-of-work assets outside of Bitcoin to gain direct exposure through a regulated ETF vehicle.
Should that happen, it may increase access, liquidity, and legitimacy among traditional investors. However, as always, regulatory decisions remain uncertain and subject to broader political and market conditions.
6. Technical Structure and Long-Term Price Action
From a macro-technical perspective, Litecoin has historically followed a pattern of higher lows and higher highs across each market cycle. This structure remains intact as of 2025, with a strong support at 81 USD on a 6 months timeframe.
Summary
Litecoin presents a combination of characteristics that differentiate it from other crypto assets, including:
✅ A public, transparent founder and no major insider dominance
✅ Limited exposure to leveraged lending, reducing systemic risk
✅ Deterministic monetary policy with a fixed supply and halving schedule
✅ Real-world usage in payments and retail adoption
✅ Strong network security and development activity
✅ Potential ETF approval that may broaden accessibility
These features do not necessarily imply outperformance, but they form the basis for an asset with a relatively clean structure, historical resilience, and a distinct position in the crypto ecosystem.
🔎 Disclaimer:
The information presented here is for educational and informational purposes only and should not be interpreted as financial advice.
Always conduct your own research, assess your individual risk profile, and make investment decisions based on your own analysis and objectives.

VTI 1D: breakout on the daily within a long-term weekly uptrend On the daily chart, VTI (Vanguard Total Stock Market ETF) has broken through the key $303.5 resistance level with strong volume. This breakout occurs within a larger weekly uptrend channel, highlighting a continuation of the long-term bullish structure.
Volume profile shows a clear path ahead: $321.7 (1.272 Fibo) and $345 (1.618 Fibo). The golden cross (MA50 crossing MA200 from below) further supports the bullish case.
Fundamentally, VTI represents the entire U.S. equity market - large to small caps - and benefits from economic resilience, declining inflation, and passive inflows. It’s a logical macro play for trend continuation.
Tactical plan:
— Entry by market or after retest $303.5
— TP1: $321.7
— TP2: $345
— Invalidation below $300
The whole market breaking out? That’s not noise — it’s the signal.

Give me 3 reasons not to be bullish on SolanaSolana’s Total Value Locked (TVL) expanded from $396M on Dec 26, 2022 to $8.69B by July 4, 2025, a 2,094% increase (~22x growth) across 80 weeks . This translates to a weekly geometric growth multiplier of ~1.089, or an 8.9% compound weekly rate .
This rapid TVL expansion reflects capital inflows, increased DeFi participation, and regained trust in Solana’s infrastructure following the FTX collapse.
————————————————
LST Ecosystem Expansion :
Liquid staking derivatives (JitoSOL, mSOL) accounted for a significant share of inflows, as yield-seeking capital returned with Ethereum-style primitives on Solana.
MEV Monetization & Compression Tech :
Validator-side MEV solutions and data compression (via Firedancer and ZK-state) improved scalability and trust in Solana’s low-latency environment.
Resurgence of DeFi-NFT Hybrids :
Protocols like Tensor and HadeSwap blurred lines between DeFi and NFTs, generating sticky liquidity and reinforcing Solana’s unique narrative.
Restored Institutional Confidence :
Post-FTX reforms and a more diversified validator ecosystem helped re-attract institutional capital, supported by enhanced wallet infra (e.g., Backpack, Phantom) and custodianship.
This pattern, paired with the geometric growth trend, suggests Solana’s DeFi ecosystem is entering a new structural bull phase, underpinned by both technical confirmation and fundamental evolution.
Anyways, let me know in the comments 3 reasons not to be bullish on Solana as we speak.
(PS: QC-resistant issues don’t apply only for Solana but for all major crypto assets!)

SPY S&P 500 ETF Potential W-Shaped Recovery Forming We may be witnessing the formation of a W-shaped recovery on the SPY (S&P 500 ETF) – a classic double-bottom structure that often signals a strong reversal after a period of correction or volatility. Let’s dive into the technicals and what this could mean in the sessions ahead.
🔍 The Technical Setup:
SPY recently tested key support around the $485-$500 zone, bouncing off that area twice in the past few weeks. This gives us the left leg of the W and the first bottom. After a modest relief rally to ~$520, we saw another pullback – but this second dip failed to break below the first bottom, a hallmark of the W-pattern.
As of today, SPY is starting to reclaim ground toward the $517-$520 resistance zone. If bulls can push through this neckline area, especially with volume confirmation, we could see a breakout that targets the $530-$535 area in the short term.
🔑 Key Levels to Watch:
Support: $490-$500 (double-bottom support zone)
Neckline/Resistance: $530
Breakout Target: $550 (previous highs)
Invalidation: A break below $490 with volume could invalidate the W-recovery idea and shift bias bearish.
📊 Momentum & Volume:
RSI is climbing back above the 50 level – bullish momentum building.
MACD shows a potential crossover forming, hinting at a shift in trend.
Watch for increasing buy volume as SPY approaches the neckline – that’s where the bulls will need to step up.
🧠 Macro & Earnings Angle:
Don’t forget – we’re entering a heavy earnings season and rate cut expectations are still a wildcard. A dovish tone from the Fed and strong corporate results could be the fuel that sends SPY higher to complete this W-shaped recovery.
🧭 Final Thoughts:
This is a high-probability setup if neckline resistance is broken cleanly. Wait for confirmation before going heavy – fakeouts are common in double-bottom scenarios. If we do get the breakout, we may be looking at a broader market rebound going into summer.
🔔 Set alerts near $525. A confirmed breakout could mean the bulls are back in charge.
SOXL 1D — With a base like this, the ride’s worth itOn the daily chart of SOXL, since early March, a textbook inverse head and shoulders pattern has formed and is now in its activation phase. The left shoulder sits at $16.67, the head at $7.21, and the right shoulder at $15.11. The symmetry is classic, with volume stabilization and a narrowing range — all the elements are in place.
The key moment was the breakout through the descending daily trendline around $19.00. Price didn’t just pierce the level — it held above it, signaling a phase shift. There was an attempt to break through the 0.5 Fibonacci level at $19.60, which led to a pullback — not on heavy selling, but on decreasing volume. This wasn’t a rejection, it was a pause.
This pullback serves as a retest of the breakout zone and the 20-day moving average. The overall structure remains bullish: price stays above all key EMAs and MAs, RSI climbs past 60, and the candlestick structure is stable. Volume rises during up moves and fades during pullbacks — classic signs of reaccumulation.
The measured target from the pattern is $32.00, calculated from the head-to-neckline height projected from the breakout point. As long as price holds above $18.40, the setup remains intact. A break above $19.60 with confirmation would open the door to acceleration.
This isn’t a momentum play — it’s a setup months in the making. The structure is there, the confirmation is there, and most importantly — the price behavior makes sense. With a base like this, the ride ahead looks worth taking.

Bitcoin - Will Bitcoin Lose $100K Support?!On the four-hour timeframe, Bitcoin is below the EMA50 and EMA200 and is in its short-term descending channel. One can look for buying opportunities for Bitcoin from the channel bottom. If the resistance level is broken, the path to the rise and its reach to the level of $107,000 will be prepared for Bitcoin.
It should be noted that there is a possibility of heavy fluctuations and shadows due to the movement of whales in the market, and capital management will be more important in the cryptocurrency market. If the downward trend continues, we can buy within the demand range.
Bitcoin has been in the spotlight again in recent days, especially as its price fluctuates within the psychologically important range of $101,000-$102,000 and its fundamental indicators are sending mixed signals.
The first and perhaps most important element in Bitcoin’s fundamental analysis is the accumulation trend by large financial institutions and corporations. According to data published by websites such as CoinShares and the Financial Times, more than $87 billion worth of Bitcoin is currently held by companies such as MicroStrategy, Tesla, Block, and ETFs, which is approximately 3.2% of the total BTC supply in circulation. This clearly shows that Bitcoin has established itself as a store of value in the portfolios of professional investors, although there is still no consensus on its function as a “digital gold”.
In this regard, analysts such as Román González of A&G have predicted that Bitcoin could reach the $200,000 range by the end of the year; on the other hand, some more conservative analysts such as Jacqui Clarke believe that Bitcoin still lacks measurable intrinsic value and should not be viewed solely as an alternative asset. This conflict of views shows the depth of complexity in analyzing Bitcoin.
From the perspective of onchain, or intra-network data, the picture looks a little more cautious. The volume of active addresses last week was in the 1.0-1.1 million range, which is lower than in previous bullish periods (such as late 2021). Also, the MVRV (Market Value to Realized Value) index, which measures the potential profit potential of investors, fell slightly from 2.29 to 2.20, indicating that the market is somewhat cooling off from the short-term heat. Also, on June 22, more than 5,200 Bitcoins were removed from exchanges, which is usually a sign of long-term accumulation and a decrease in short-term selling pressure. On the other hand, Bitcoin’s behavior in the face of geopolitical crises shows signs of a change in the dominant market narrative. During the recent tension between Iran and Israel, Bitcoin fell by nearly 4%, unlike gold, which experienced significant growth. This challenges the assumption that Bitcoin is a “hedging” or “safe haven” asset and shows that BTC is still registered more as a risk-on asset in the minds of market participants. This is considered very important as investors look for tools to hedge inflation or protect against economic shocks. In terms of correlation with traditional markets, Bitcoin is also on a path to further integration with classic assets. The 30-day correlation index between Bitcoin and the S&P500 is now around 0.78, and academic studies predict that the correlation will grow to 0.87 at some point in 2024. This means that Bitcoin’s movements are more aligned than ever with the Federal Reserve’s monetary policy, interest rates, stock market conditions, and global liquidity flows. Therefore, in the current situation, the impact of US macro data or central bank decisions plays a decisive role in Bitcoin’s volatility.
Finally, Bitcoin price prediction models in recent days also reflect this complexity. Websites such as Bitfinex, Changelly, and analysts from institutions such as Brave New Coin have estimated that Bitcoin could reach the $125,000-$135,000 range this summer if macroeconomic conditions remain stable, and even if institutional capital continues to flow and there are no macro crises, reaching $150,000 by the end of the year is not out of the question. However, such scenarios require maintaining the current level of liquidity in the market, the absence of drastic tightening measures by the Federal Reserve, and the control of geopolitical risks.
In short, Bitcoin is in a situation where, on the one hand, its supporting fundamentals are stronger than ever; With institutional inflows, accumulation of long-term addresses, and reduction of inventory on exchanges. On the other hand, the market remains highly vulnerable to macroeconomic and political risks and continues to show volatile reactions.
This situation has led to Bitcoin becoming not only a speculative tool or growth investment, but also gradually becoming a part of professional portfolios with a carefully composed risk management mix. Its medium-term outlook is positive, but with one important condition: stability in global inflation and continued institutional capital flows.

Luxury, War, and Clarity – This Is the Golden Reset.🟨 The Real Gold Era: Clarity While the World Burns 🟨
"While some bleed in the streets, others sip cocktails in the Bahamas. This is not a coincidence. This is the new world."
Right now, we live in a time like no other.
People are dying in wars they never chose.
Currencies collapse. Nations threaten each other.
And yet — capital flows, gold climbs, and the rich get richer.
🕰️ A war started long ago — and most never saw it:
2020–2022: They printed trillions. COVID shut down the world. Fiat was silently devalued.
2022–2023: Russia was cut off from SWIFT. BRICS started buying gold. The dollar was no longer untouchable.
2023–2024: Gold broke $2100… then $2400… now $3400+. Even high interest rates can't stop it.
2025: U.S. and Israel strike Iran. BRICS discuss a gold-backed currency. Trust in fiat? Gone.
The Gold Era is no longer just metaphor. It’s the new battlefield.
💣 "War is loud. Wealth is silent."
While bombs fall in the East,
✨ capital quietly moves to safe havens.
While families flee,
✨ smart money finds gold, data, and sovereign positioning.
While headlines scream chaos,
✨ traders make decisions in silence.
🌍 But here's the paradox:
We also live in a world of unmatched abundance:
You can build a brand from a phone.
You can trade gold from a beach.
You can learn SMC, AI, geopolitics — and use it to build freedom.
You can escape the system, if you understand the structure.
In this gold era, the true asset isn't just metal.
It's mental clarity. Information. Sovereignty.
The gold is you.
📉 This isn’t just about trading.
It’s about knowing where we are in the timeline of collapse and rebirth.
The markets don’t lie — they expose what’s really coming.
And those who read them… can rise while others fall.
🧠 Final note:
Not everyone survives a reset.
But those who think in structure, who lead with clarity — they don’t just survive.
They reposition.
They build.
They lead.
🟡 Welcome to the Real Gold Era.
Where charts speak louder than news.
Where truth is a position.
Where you don’t wait for safety — you create it.
—
✍️ GoldFxMinds – where structure meets truth.
📢 Disclosure: This analysis was created using TradingView charts through my Trade Nation broker integration. As part of Trade Nation’s partner program, I may receive compensation for educational content shared using their tools.

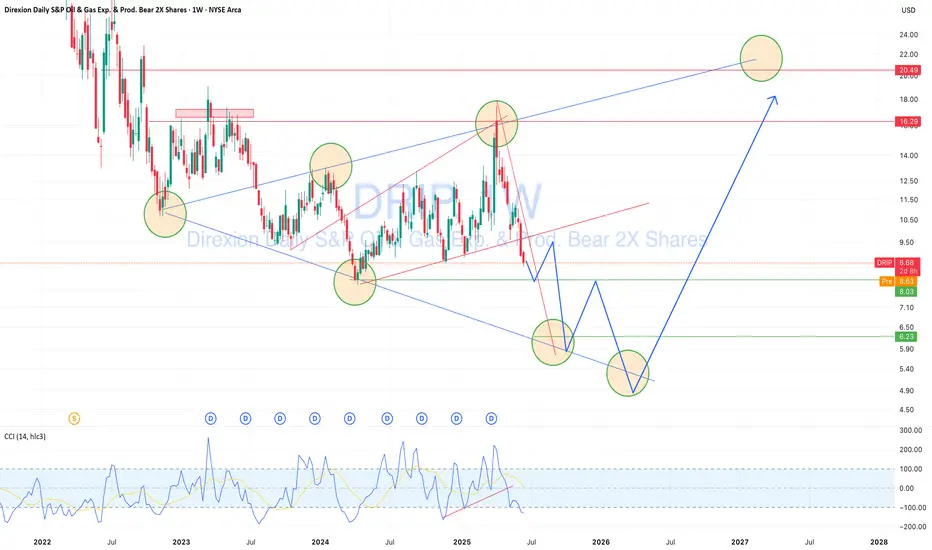
DRIP — Geopolitical Oil Risk Creates a Buying OpportunityDRIP (inverse 2x ETF on US oil & gas exploration/production) is approaching a key technical support zone.
While oil may continue rising short term due to geopolitical tensions — especially US-Iran risks and Middle East instability — this short-term pressure could push DRIP lower toward the $5.00–6.00 area. That zone aligns with strong historical reversal points and trend support. From there, a rebound toward $12.00–20.00 is technically and fundamentally possible, offering 30–50%+ profit potential. I’m planning staged entries in the marked range, managing risk with awareness of commodity market volatility and global uncertainty.