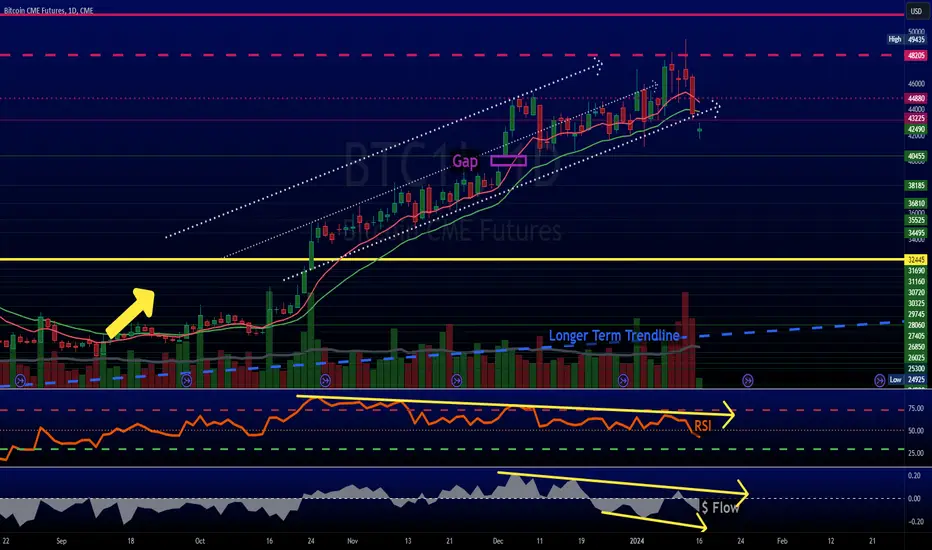
$ETH holding better than $BTC but for how long?One of our #ETH TARGETS has been hit. The Gap is FILLED!
CRYPTOCAP:ETH doesn't look as bad as CRYPTOCAP:BTC but it is weakening.
Keep an eye on #Ethereum volume. Very important short term.
As we've been saying for some time now, #ETF , or institutions, are NOT what #crypto is about & makes it easier to manipulate #crypto. It is what it is now.
On ETF news, this might be built in already.
ETF

Another on the $ $BTC callWe are not trying to toot our own horn with this post.
There have been a few accounts that were warning about a CRYPTOCAP:BTC top.
HOWEVER, they've been saying it for some time. Broken clock is also right daily.
We began to warn few days BEFORE the #BTC melt down.
48k target, like we stated, was likely a short term top.
We rang alarm bells on the 9th & WARNED on 11th.
Another $ call on #Bitcoin.
15/01/24 Weekly outlookLast weeks high: $48987.12
Last weeks low: $45231.94
Midpoint: $41476.76
Following such a historical week with the approval of the BTC ETF's on Wednesday 10th of January. BITCOIN reached a local high of 49K, since then price has fallen towards 41.5K (15% drop).
Price action this week is hard to predict as the ETF narrative has been driving BTC and crypto for quite a while now, with this even over and price falling after the news broke we are now at a crossroads where being bullish here could easily be punished, the halving is months away and the majority of smart money have made nearly 3x gains in one year predominantly due to the ETF narrative and the selling pressure is now high as investors have made substantial gains.
On the other hand we have BlackRock who just acquired $10m (11,500 BTC) and other funds looking to do the same, FOMO in these situations can play a huge part as retail investors simply won't want to take the risk and see prices fall lower before buying as they're scared prices will just leave them behind soon. ETF funds obviously want to buy cheap and they are the market makers which would indicate a want for lower prices.
A 30% drop is common place in a bull market, BTC would therefore go from 49k to 34K which is nearly in line with the 33K FVG which seems the logical target to me. I think if we see that level it would be towards the end of the week/ next week.

BTC Market Update 14th January Post the spot ETF approval, there was a notable surge in significant inflows marked by high volumes. However, a distinct trend emerged with the redemption of AMEX:GBTC , highlighting two crucial points: first, there has been selling pressure on GBTC, and second, the anticipated inflows were lower than initially expected.
Weekends often witness limited liquidity, and order books are less robust, implying a potential gradual decline until further clarity emerges. While a correction in BITSTAMP:BTCUSD seems probable, especially following an uninterrupted rally, such fluctuations are deemed normal in market behavior.
During the weekend, GBTC couldn't execute sales, and BTC experienced a drop from 49K to 43K within 24 hours, partly influenced by Larry Fink's positive remarks on an ETH ETF, leading to a more than 20% rise in ETHBTC. However, GBTC is expected to resume selling on Tuesday. A second downturn is anticipated when GBTC announces outflows for yesterday.
Contrary to the observed $94M outflow for GBTC, it pertained to Wednesday, preceding its going live. Thursday's outflows likely reached the hundreds of millions, already sold into the market via CME futures and BITO. Authorized Participants (APs) sell futures and manage BTC on a T+1 basis.
People observed a $94M outflow for GBTC, but that was actually for Wednesday, prior to it going live. The outflows for Thursday are probably in the hundreds of millions, already sold into the market via CME futures and BITO. The Authorized Participants (APs) sell futures and then handle BTC on a T+1 basis.
The advisable strategy for the time being is to adopt a patient approach, observing the market without immediate action. A prudent course of action is to wait and reassess the situation.

🔥 Bitcoin Bulls Holding By A Thread: What's NextIn my recent Bitcoin analyses I've talked about the fact that I expected the Spot ETF announcement to be a sell-the-news event, helped by two important resistances lying at the 48k-50k area. See below for my in-depth analyses:
As expected, Bitcoin has reversed from the 48k area and is currently trading at 43k-ish. The bullish trend is still not broken, so there's some hope left for the bulls.
In order to fully confirm my bearish bias, I'm waiting for BTC to fall through the yellow area of support. This support has been holding since early December, so it would definitely be a long-term shift if it would break.
If we will close a weekly candle below 40k, there's a decent probability that we will move towards the bottom support of the diagonal channel (see first analysis), potentially even lower.
As mentioned before, this bearish move is likely the last one before the "real" bull trend starts. BTC has historically always dumped in the first months before/after the halving, so this potential dump is nothing out of the ordinary and will likely function as a spring towards new all-time highs.

XRPUSDT to $1.22 this year?2 factors drive my analysis for why I'm forecasting XRP to hit $1.22 this year.
First:
XRP ETF Speculation from Blackrock. - BlackRock CEO Larry comment on the potential for an XRP ETF on Fox Business interview “I can’t talk about that!” when asked about an XRP ETF.
This left investors and analysts parsing his words for hints of BlackRock's possible foray into XRP
2nd: Technical Analysis
2 sides of the coin for this, as seen by my bullish green price action arrow forecast and bearish red price action arrow forecast.
However, i'm leaning more towards longs, due to fundamentals where despite volatility and FUD, the overall momentum is hopeful bullish.
At the time of posting - 14Jan 4.30 SGT, XRPUSDT is on the weekly support -resist level. Previous week's candle closed bearish, however, with a long wick showing buyers strength. This week looks to be ending on a green candle. Long sell wick indicates sellers strength.
Weekly is gonna close with a sideways momemtum, as market is hesistant and bith bear and bulls are looking to see each others next move.
I however, expect week support to be respected, and pump up to week's resist after some consolidation, to retest March 22 week resist zone.
If price retest Mar 22 resist zone and forms support on 0.748, I'm expecting XRP to push all the way to 1.22.
While bullish for $1.22 target, that'll probably be pre ETH ETF, to which, a massive liquidity grab will bring XRP back to 0.5-0.8 zone.

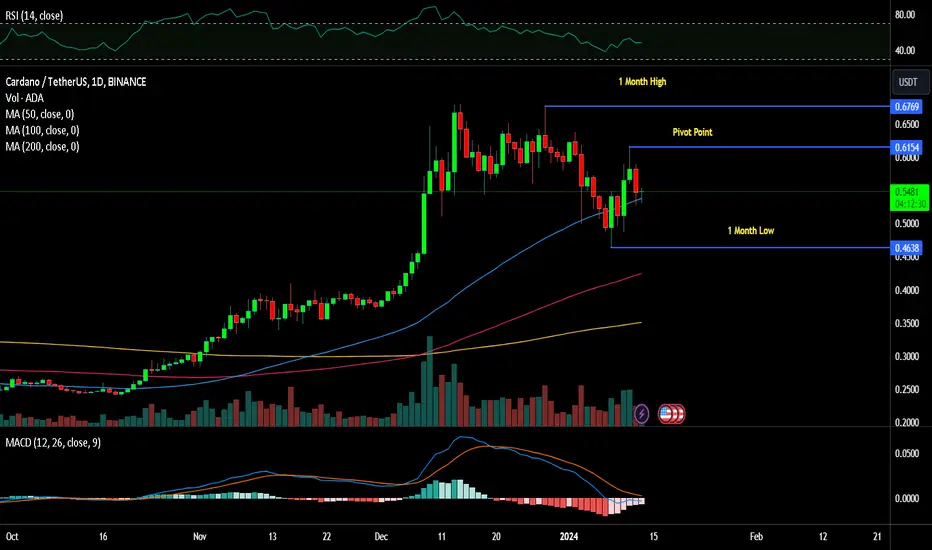
Cardano ($ADA) Gains Momentum as Next Big ETF Candidate
Cardano ( CRYPTOCAP:ADA ), the renowned blockchain platform, is gaining significant attention as a potential candidate for future exchange-traded funds (ETFs) in the U.S. With the cryptocurrency community actively discussing the approval of altcoin-based ETFs following the green light for Bitcoin ETFs, Cardano has emerged as a front-runner in this new wave of investment products.
Cardano’s Stability Attracts ETF and Investor Focus
With the introduction of ETFs, an institutional interest in cryptocurrencies is anticipated. Cardano, known for its unique technological approach and solid community support, is a promising option for these investors.
A recent thread by a prominent Cardano blogger, @cardano_whale, addressed to his 143,300 followers, highlights the reasons for this growing interest. Cardano’s peer-reviewed, stable, and lightweight protocol, combined with a unique blend of UTXO and PoS in its consensus mechanism, sets it apart in distinctly solving the blockchain trilemma.
The protocol’s resistance to centralization, evidenced by its inclusive and transparent ADA distribution, makes it an attractive option for investors wary of manipulation. Unlike many other cryptocurrencies, founding entities control only about 10% of the CRYPTOCAP:ADA supply. Moreover, Cardano’s staking design is touted as one of the most decentralized, with many validator nodes enhancing the network’s security against potential attacks.
Cryptocurrency ETFs Pave Way for Broader Adoption
Cardano’s appeal is not limited to its robust security and decentralized nature. The platform’s ongoing developments in scalability and functionality position it as a rapidly evolving and feature-rich blockchain. This evolution is crucial for supporting a diverse range of decentralized applications (dApps), a sector that has seen exponential growth.
The adaptability of Cardano is further enhanced by its support for multiple programming languages, which broadens its appeal to a wider developer community. The recent onboarding of hundreds of native tokens and DeFi applications underscores the ecosystem’s dynamic nature. Combining these factors and programmable ADA scarcity cements Cardano’s status as a leading dApp ecosystem with solid organic growth.
The conversation around Cardano ETFs is taking place against the backdrop of an evolving regulatory landscape for cryptocurrency investment products. The approval of Bitcoin ETFs in the U.S. has allowed other cryptocurrencies to follow suit. Industry experts, such as Valkyrie’s co-founder Steve McClurg, have expressed optimism about the potential approval of ETFs for other major cryptocurrencies like Ethereum ( CRYPTOCAP:ETH ) and XRP.
Cardano is already making strides in this direction, backing the Swiss-registered 21Shares Cardano ETF and participating in the OTC-traded Grayscale Digital Large Cap Fund (GDLC) portfolio. The establishment of such ETFs could significantly enhance the accessibility and attractiveness of Cardano to a broader range of investors, particularly those from traditional finance sectors looking to diversify their portfolios with digital assets.
Maintaining purchases against the background of taking 2500And so we took another height, I want to consider further scenarios. As expected, the bulls made a new attempt to open the year above 2500, but against the background of powerful statistics, the amers kept the price in the neutral zone, which will give numerous disruptions this year and reduce the impact of ETF approval. But against the background of the closing of the last annual candle with growth and the opening of the year above 2250, the probability of maintaining purchases until the middle of the quarter prevails.
To date, the opening level of a new weekly candle will play an important role. In the case of an opening above 2500 in the new week, we can expect a test attempt of 2750-2900. In the case of a lower opening, there is a chance of bears hitting the 2400 retest with an attempt to break through to 2250 and further buy-off, or a drop in volatility with an increase in purchases in the second half of the week. The probability of the first scenario significantly prevails in this regard and the statistics coming out on Wednesday and Thursday will play an important role.
Many alts have opened the year above key resistances, which provides support for many coins, despite the dynamics of the tops. This year, the dynamics of coins will vary significantly depending on the opening level of the year. Due to the high unprocessed goals, the coins that I relied on in the current difficult market proved very stable. According to pros, we came close to the test of the first take, but unfortunately we did not have time to take the main level at 0.75 against the background of the rollback of the cue ball. I have fixed the largest part of the position and will look for points for refilling, while the probability of a repeat test of 0.30-35 is high, from where we can expect a new swing of the trend with goals above 0.75. They are preparing to take new heights of df cvp uft, the nearest goals for which are up to 70-100% from current levels. Also, chz is sent to the long-awaited 0.1 test, against which the fantokens are once again preparing for breakouts, among which atm and asr have the highest unprocessed targets. I am also considering ooki vib oax drep for work, which also have immediate unprocessed goals of 100%+ and stably compensate for the rollbacks of the tops.

BTC/USD pullback expected, now heading towards 200K!Analyzing the BTC/USD scenario reveals an expansion of the bearish phase with a test of support at 40,980. The initial resistance is at 45,465, but expectations suggest the possibility of an extension of the negative trend towards new lows at 39,485. From a daily volatility perspective, the cryptocurrency shows a value of 2.79%, with a weekly performance registering at -3.16%.
The reasons behind Bitcoin's decline after the historic spot ETF approval are as follows:
There was strong speculation leading up to the ETF approval; now that it's approved, there is less for people to speculate on. Many expected a surge to $55,000 after approval, and since that didn't happen, people are either taking profits or selling in disappointment.
Bitcoin surged from $15,400 to $49,000 with FOMO elements related to the ETF, so a correction was naturally due. This could be a sell-the-news event for many who bought Bitcoin before it reached $20,000.
Money is shifting from Bitcoin to Ethereum. People are selling BTC and buying ETH because they anticipate an ETH spot ETF is coming, and since ETH hasn't surged much, they are moving to an undervalued asset.
Positive aspects that many people overlook:
The Bitcoin ETF generated a total volume of $4.3 billion, a historic result for any ETF in history.
Now that Bitcoin is available to all Wall Street traders, trillions will flow into the market over time.
The Bitcoin ETF instills trust in cryptocurrencies.
Personal opinion: The Bitcoin ETF will become increasingly popular on Wall Street, and we will see companies allocating billions to Bitcoin over time, easily propelling BTC to $100,000 - $200,000+.
Following the SEC approval of the first Bitcoin ETFs, we observed a temporary dip in BTC's value, dropping to around $48,000 before recovering a significant portion of the weekly movement and slipping below the previous week's highs. Currently, the overall cryptocurrency market reflects a negative trend, with Ethereum standing out positively compared to other cryptocurrencies.
Thanks to ETH's strength and BTC's weakness, the ETHBTC pair exhibits a +17% performance this week, approaching the technical price level of 0.06.
BTC (49 weeks on the rise)
TRX (7 weeks in decline)
ETH (49 weeks in decline)
DOGE (49 weeks in decline)

LDO NEW ALL TIME HIGHIn this chart, BINANCE:LDOUSDT surpasses its previous ATH of $0.389 and currently around that price. What would be the next potential resistance to watch. I'll provide a technical analysis in the comment threads below.

Bitcoin(BTC): We Had A Drop!!Bitcoin rejected fully FWB:48K and reclaimed $45K zone as well!! Our weeks-long game plan is working very perfectly, and the price is moving just as we have been predicting it to move.
With that being said, we have had so far 7% market price movement since the entry zone and 14% market price movement since the FWB:48K zone, which we have been monitoring for quite some time.
With that being said, we also see that during Asian session, BTC stayed in the lower zones without any impulse to upper zones, which is good sign of further downward movement to come from here (maybe with small correction to upper zones)
As always, "buy the rumours, sell the news." - Ethereum ETF is next??

Getting ready for a pullback for BTC entry into new ATHI'm expecting the ETF buzz to cool off with some sell off down to the $5K mark where I'd enter my position and hold through the up channel for a new ATH in the near future.

Short Squeeze Potential MARA ? heavily shorted stock $MARA. weekly time frame we have a head and shoulders and we just broke the neckline now coming back in to test it, the big IF is if it can now hold as support. lost momentum from the profit taking and sell the news plus going into 3 day weekend. we had a promising break (if you caught that move to 32, nice one) Esp off all the Bitcoin ETF news and now we have the sell the news profit taking etc right back to the break out. which was clear resistance multiple times if you look left. idk. its something I'll at least watch. any crypto news or catalyst can put this back in play. it really really needs to hold this area especially over 15 but i really don't want it to go past 17.50-18. but yeah, that's my thoughts something to watch, feels like its kinda late to the party and the move was made but the amount of shorts in this is interesting. id target 32. for hypothetical purpose past that it can get parabolic. 32 was about the measured move from the head and shoulders although this is log chart. also currently resting on the 9ema. im not 'thrilled' for this. just something to keep watch on. and i also want to post this so i can view it later.
Cheers! 3 day weekend. try to enjoy it. lol

BTC REVERSAL TO $35,000, TAKE PROFITS!!Bitcoin is setting up for a reversal, A WEEKLY DOJI CANDLE in the making.
Could end of ETF Approval be the local top?
Daily close below $43k, we lose momentum.

🔥 Ethereum ETF Hype At The PERFECT Moment: Time To Shine!Now that BTC's spot ETF is officially live, investment banks like Blackrock have already started talking about a potential ETH ETF. Interestingly enough, this happened at the perfect moment, TA-wise.
Right as the ETH/BTC valuation has hit a major support, bullish ETH news comes in, which naturally has lead to a big bounce in the ETH/BTC price (ETH is outperforming BTC). What a coincidence...
With ETH getting it's time in the sun, we might actually confirm the bullish channel on the ETH/BTC pair and continue the bullish trend all the way towards the top resistance. With ETH's ETF to be announced, this value will likely continue to go up.
Do you think ETH will outperform BTC over the next few months/years?

Time is everythingA lot of people see a Bitcoin pullback, a drop or a red candle as a negative thing. Clearly this is lack of experience, lack of understanding and only ever seeing re-assurance of the one bias they can comprehend.
Many people believe my posts to be negative or anti Bitcoin - you could not be more wrong, as a very early holder, I simply don't care - up down or sideways. It's been kind to me and I will say it was more luck than judgement. Right place, right time.
But as a professional trader, money manager and tech investor - I have seen my fair share of market trends, hype, realism and shocks in the market to know. Time is all it takes.
You can go back over SPX for example and If you buy and hold the trend has only been up. Obvious its one of indices designed to go up. This does not make it a "get rich quick scheme"
For me the problem lies in the cult esq mentality and the desire to get rich quick.
When you have, or manage a larger fund - time is always less of an issue, when a Limited partner of a fund told me the company hold period was 15-20 years on average, it took a while to let that sink in. 1% of a lot of money is a lot of money, 1% of a $10,000 pushes you to want more - hence jumping on the up only bandwagon.
You need to remember;
Last year I posted two options for Bitcoin; I said my preferred route put us in early stage accumulation.
The second option went back even further than that, it's the Evil move I said I would hope Composite Man would not be as cruel.
Unfortunately with the move from 32k to 48k region, it's clear now the second play has in-fact been the one playing out.
---------------------------------------------------------------------------
So here's some rational logic - the medicine most DO NOT WANT to swallow.
People seem to throw the same argument - ETF & Halving - They have very little else to contribute. So let's look at what an ETF is and does.
An Exchange-Traded Fund (ETF) itself doesn't inherently stabilize an asset. However, the structure and mechanics of an ETF can have certain features that may contribute to perceived stability or liquidity in the underlying assets it represents. Here's how:
Diversification: ETFs often hold a diversified portfolio of assets. By pooling together various assets like stocks, bonds, or commodities, they spread risk. This diversification can help mitigate the impact of poor performance in a single asset on the overall value of the ETF.
Arbitrage Mechanism: ETFs have a unique creation and redemption mechanism. Authorized Participants (usually large financial institutions) can create or redeem ETF shares in large blocks, usually known as creation units. This process involves exchanging a basket of assets for ETF shares or vice versa. This helps to keep the market price of the ETF close to the Net Asset Value (NAV) of its underlying assets, promoting stability.
Liquidity: ETFs are traded on stock exchanges, providing investors with liquidity. The ability to buy or sell shares throughout the trading day at market prices contributes to the perception of stability. The underlying assets might not be as easily tradable, but the ETF itself can be bought or sold like a stock.
Market Makers: In the secondary market, market makers play a crucial role in providing liquidity. They continuously quote buy and sell prices for the ETF shares, helping to ensure that there is a smooth and efficient market. This can reduce the impact of large buy or sell orders on the market price.
Now for some extra therapy, we also need to look at the realistic timeframes these large players operate at.
Blackrock's most popular ETF is their SPX (S&P500) fund. with it's inception around 2001 I believe.
$354BN.
Now if we look at Bitcoin's market cap - we dropped from $1.3 Trillion at the 69k High down to around 300Billion at the 15k low region.
So working out market cap is simple current price of Bitcoin x coins in circulation. (just over 19m).
This is just highlighting the obvious; Blackrock is not going to empty the SPX fund and stick $350Billion in a newly established fund. Again time, they have enough money to not need to force or risk anything on a large scale.
But what is interesting is the point above about market makers.
In Wall Street terms, a market maker is a financial institution or individual that facilitates the buying and selling of financial instruments in a market. Market makers play a crucial role in ensuring liquidity and maintaining orderly trading in financial markets, including stock exchanges.
Here are key aspects of what market makers do:
Liquidity Providers: Market makers stand ready to buy or sell a financial instrument (such as stocks, bonds, or options) at publicly quoted prices. This activity provides liquidity to the market, allowing investors to execute trades quickly and efficiently.
Bid and Ask Prices: Market makers quote bid and ask prices for a security. The bid price is the price at which they are willing to buy, and the ask price is the price at which they are willing to sell. The difference between these prices is known as the bid-ask spread.
Order Execution: When an investor places a market order to buy or sell a security, the market maker ensures that the trade is executed promptly by matching it with their own inventory or finding a counterparty in the market.
Risk Management: Market makers take on some level of risk by holding an inventory of securities. To manage this risk, they continuously adjust their bid and ask prices based on market conditions and changes in the supply and demand for the securities.
Arbitrage Opportunities: Market makers may engage in arbitrage, exploiting price differences between related financial instruments or markets. This helps ensure that the prices of the same or similar securities are consistent across different trading venues.
Maintaining Orderly Markets: Market makers contribute to the overall stability and efficiency of financial markets by preventing excessive volatility and ensuring a continuous flow of trading.
It's important to note that market makers profit from the bid-ask spread and trading volumes. While they facilitate trading and provide liquidity, they also manage their own risks. Market makers can be institutions like investment banks or specialized firms with expertise in particular markets. They play a crucial role in the smooth functioning of financial markets by facilitating the buying and selling of securities.
=============================================
Market makers have been referred to another type of Composite Man. The term "Composite Man" is associated with the Wyckoff Method, a technical analysis approach to understanding the stock market. The Wyckoff Method was developed by Richard D. Wyckoff, a stock market trader and educator from the early to mid-20th century. According to this method, the Composite Man represents a hypothetical market manipulator or a group of large market participants who have the power to influence the market.
In Wyckoff's view, the Composite Man is an entity that accumulates or distributes stocks in a way that leaves footprints on the price and volume charts. The actions of the Composite Man are believed to be observable through the analysis of price and volume patterns, helping traders and investors anticipate potential future price movements.
Here are the key ideas associated with the Composite Man in the Wyckoff Method:
Accumulation and Distribution: The Composite Man is thought to go through phases of accumulating or distributing a particular stock or market. During accumulation, the Composite Man is buying, and during distribution, they are selling.
Wyckoff Price Cycle: The Wyckoff Method outlines a price cycle that includes phases such as Accumulation, Markup, Distribution, and Markdown. Traders using this method attempt to identify these phases on price charts to make more informed decisions.
Smart Money: The Composite Man is sometimes referred to as the "smart money" because it is assumed to have more information and resources than individual retail traders. Monitoring the actions of the smart money is believed to provide insights into potential market trends.
When I posted posts like this from the 65k high, it was due to these footprints being visible from space.
As the price moved up from the 28k region to the current ATH. Similar thing.
I am not here trying to drag it or you down, I am here trying to help see logic in the charts. As the move moved up, we had a fake ETF release, in essence thus pricing in the actual ETF.
This is why for me, this scenario is the most likely in the current environment.
Composite Man/Market makers are happy to use the fear and greed index, which is currently tilting heavy towards the greed side. Against retail traders who see ONLY UP as the only scenario available.
The space is becoming more like a cult and it's feel more and more like the simple definition of a pyramid scheme. Again, I am not saying that's what it is - I am in at the bottom my cards are on the table.
The space has become "if your friends join, they also need to invite more people, and the cycle continues. The person at the top gets money from everyone below, and the people at the bottom hope to make money by bringing in more people."
The problem is, there's no real product or service being sold. The only way people make money is by getting others to join. Eventually, it becomes harder for everyone to find new people, and those at the bottom end up losing money because there aren't enough new members to support the structure. This kind of scheme is not fair or sustainable and can cause a lot of people to lose their money. Especially when the big boys get involved with very little regulation covering the people at the bottom.
Just remember everyone was saying "anti banks, anti institutional yet celebrating the ETF's like a win" the issue here is it's likely to stabilise the asset, slowing the phases and cycles down to a more mellow growth curve over the next 20 years.
In the grand scheme of things, it's great for the industry, but we can expect more manipulation prior to regulation, post regulation the percentage gains will narrow.
Keep all of this in mind and remember it's what the majority wanted. Stay safe! have fun and see you on the next post.
Hate comments always welcome - just please back them up with some logic and show you have more than 3 brain cells. 😉
Disclaimer
This idea does not constitute as financial advice. It is for educational purposes only, our principle trader has over 20 years’ experience in stocks, ETF’s, and Forex. Hence each trade setup might have different hold times, entry or exit conditions, and will vary from the post/idea shared here. You can use the information from this post to make your own trading plan for the instrument discussed. Trading carries a risk; a high percentage of retail traders lose money. Please keep this in mind when entering any trade. Stay safe.

2024 Crypto SUMMER is here! PRICE, TRENDS & FORECASTSIn this video we lay out our short and long-term forecast for the entirety of 2024 Crypto Summer and beyond. Also, we do a little review and take a look at how our forecast stacked up against the eventful 2023 Crypto Spring. As always please feel free to leave your thoughts and ideas in the comments and thanks for watching!

BTC - It is a matter of time ⏱Hello TradingView Family / Fellow Traders,
📈 BTC has demonstrated an overall bullish trend, trading within the ascending channel outlined in red.
Following a rejection at the 48,000 - 50,000 resistance range, BTC experienced a decline and is currently approaching the lower red trendline.
Additionally, the zone between 44,500 and 45,000 serves as a robust support area.
🎯 Therefore , the highlighted red circle signifies a significant zone to consider for potential buy setups. This area is noteworthy as it marks the convergence of the blue support and the lower red trendline, acting as a non-horizontal support.
📚 In accordance with my trading style:
As BTC nears the red circle zone, I will actively search for bullish reversal setups to capitalize on the anticipated next bullish impulse movement.
📚 Always follow your trading plan regarding entry, risk management, and trade management.
Good luck!
All Strategies Are Good; If Managed Properly!
~Richard Nasr

Bitcoin sell the ETF news. 20% crash is comingBitcoin is crashing after the BTC ETF launched on Nasdaq - iShares (ticker IBIT on TradingView). This is not looking good; the crash looks really strong on the 1-minute chart. Everyone bought into the ETF News, and now the whales are taking advantage of it and want liquidity at approximately 39k. Why 39? We can see multiple swing lows in this zone. I turned bearish on Bitcoin today. Let me know what you think about my analysis, and please hit boost and follow for more ideas. Thank you, and I wish you successful trades!
Bitcoin is the first decentralized, peer-to-peer digital currency. One of its most important functions is that it is used as a decentralized store of value. In other words, it provides for ownership rights as a physical asset or as a unit of account. However, the latter store-of-value function has been debated. Many crypto enthusiasts and economists believe that high-scale adoption of the top currency will lead us to a new modern financial world where transaction amounts will be denominated in smaller units.
The smallest units of Bitcoin, 0.00000001 BTC, are called Satoshis (or Sats in short), in a nod to the pseudonymous creator. At Bitcoin price now, 1 Satoshi is equivalent to roughly $0.00048.
The top crypto is considered a store of value, like gold, for many — rather than a currency. This idea of the first cryptocurrency as a store of value, instead of a payment method, means that many people buy the crypto and hold onto it long-term (or HODL) rather than spending it on items like you would typically spend a dollar — treating it as digital gold. Let me know what you think about my analysis, and please hit boost and follow for more ideas. Thank you, and I wish you successful trades!

Bitcoin(BTC): ETF Is Live...Will We Dump Or Pump?ETF is live, and billions of dollars have been going into the crypto trading markets!!
Although this is a huge milestone for Bitcoin, we are not so optimistic for bullish markets to start yet! - Yes, we now have big institutions that can buy in on Rypto, but would they buy in on such a high price?
With that being said, we are still seeing that downward possible movement to happen, which would go towards at least $34K zone (where majority of liquidity is currently at)
Currently, fighting over the FWB:48K zone price is not seeing any strength to actually pursue that FWB:48K zone as of now. Let's see...
Greed and Fear Index: Extremely Greedy / 76

Will Bitcoin Make History?This post is more of documentation of the historical moment that the leading cryptocurrency Bitcoin has experienced today with the passing of Bitcoin ETF approval by the SEC. It was a long awaited event and it has finally happened. But what other major events are happening in the chart right now that also might be historical?
Well for one, we can see that BTC has retraced 61% of the way from its low around $15.5K to its all-time-high of $69k. The momentum Bitcoin has seen in the last 12 plus months has been fantastic from a bullish standpoint, but traditional technical analysis - based on Fibonacci - signals that the price of Bitcoin is officially in deep retracement levels, which makes longing the asset at this particular moment very high risk from a trader's perspective. Keep in mind that we are also a few months away from the Bitcoin Halving event as well, which historically has signaled the optimum buying window for the cryptocurrency. If BTC can maintain its support within the year-long rising channel (bearish), there is no reason to assume that an end to the trend is in site. On the contrary, if support begins to breakdown, there are plenty technical reasons for a correction in price to occur, that could send the price back to levels witnessed during the summer.
In the meantime, congrats Bitcoin! Perhaps its moment on the world stage as a legit and respected asset class has finally arrived.

Bitcoin ETFs coming soon: what could happen?Hello, folks! If this is your first time reading one of my ideas, welcome, hope you enjoy it. If you are a regular visitor of my ideas, thank you!
Let's discuss the fuss around Bitcoin Exchange-Traded Funds (ETFs). With 8 Bitcoin ETFs awaiting regulatory approval, decisions are anticipated between January and March 2024, let's consider how this could shake up Bitcoin's price, the wider crypto market, investor confidence, and the overall financial scene.
🧙🏽♂️ Spot ETFs: A Direct Link to Bitcoin's Supply
SPOT ETFs are unique because they require the actual holding of Bitcoin by the fund. In an environment where Bitcoin's availability on exchanges is at an all-time low, these ETFs could significantly influence the market's supply-demand dynamics.
The approval of SPOT ETFs is likely to ramp up demand significantly. Given Bitcoin's capped supply, this increased demand could lead to substantial price surges, potentially setting new all-time highs.
🧙🏽♂️ Investor Sentiment: A Confidence Boost
For investors, SPOT ETFs represent a more secure, regulated path to Bitcoin investment. This could draw in a fresh wave of investment, both from retail and (more importantly) institutional sectors, think pension funds for example. This could potentially result in elevating Bitcoin's price and market stability in a way never seen before.
🧙🏽♂️ The Financial Landscape: Embracing Digital Currencies
On a larger scale, SPOT ETFs indicate a significant stride in incorporating cryptocurrencies into mainstream finance. This move could spark further innovation and adoption of digital currencies in diverse financial services. While some banks are now known to block transactions related to crypto, or even entire accounts, it's not unimaginable that they will start offering crypto services themselves. An approval of several ETFs would incorporate crypto into Wall Street.
🧙🏽♂️ The First-Mover Scenario: A Case for Simultaneous Approval
In the realm of these ETF applications, the potential for a first-mover advantage looms large. Here's a breakdown of the key players and their decision dates:
Ark/21 Shares Bitcoin Trust: 1/10/24
Bitwise Bitcoin ETF Trust: 3/15/24
BlackRock Bitcoin ETF Trust: 3/16/24
VanEck Bitcoin Trust: 3/16/24
WisdomTree Bitcoin Trust: 3/16/24
Valkyrie Bitcoin Fund: 3/16/24
Invesco Galaxy Bitcoin ETF: 3/16/24
Fidelity Wise Origin Bitcoin Trust: 3/16/24
If one of these ETFs gets approval ahead of the others, it could dominate investor interest. To avoid this and foster a healthier, more competitive market, regulators might consider approving multiple ETFs simultaneously, ensuring no single fund unfairly corners the market. This means that we might see approval of several ETFs in January 2024, less than 2 months from now!
🧙🏽♂️ Conclusion: A Turning Point for Crypto?
The potential approval of Bitcoin SPOT ETFs marks a pivotal moment in the crypto narrative. It's a validation of Bitcoin's growing influence and a beacon for a more inclusive crypto market. For the crypto community, it's a period of pride and anticipation; for cautious investors, a new pathway into the crypto realm; and for the financial world, a step toward embracing the digital currency era.
Let's eagerly watch together how this story unfolds. Here's to the dynamic and ever-evolving world of cryptocurrencies! 🥂🚀🌕
❓ Questions for you:
What do you think will happen?
Do you expect one or more ETFs to be approved in January?
What do you think will be the effect on price of that happening?
How will you trade/invest based on your expectations?
Leave your answers to these questions in the comments below.
Oh, and if you enjoyed reading this, like/boost, follow and shares are highly appreciated!

Ripple - XRPUSDT - Sleeping GiantGreetings Everyone,
Today we are looking at Ripple's XRP.
Ripple is one of the oldest crypto project and the only project which flipped ETH for second spot in crypto ranking in 2017 bull run and is the only one that came closest to flipping Bitcoin for first spot during the same time period. Although it was a very short period but it happened and it speaks volume.
Later on SEC vs Ripple lawsuit came into play during last bull run which capped the projects adoption and growth potential significantly. Even with that it had 10x growth during last bull cycle peak. Last year, however, Ripple won the lawsuit and XRP had a short lived spike but we were not completely out of the bear cycle lows so it did not amount to much.
This time, with SEC troubles behind us, we expect to have bright days ahead for XRP.
For the last little while XRP has been trending in an up-slopping channel except for a short live spike mentioned before. It still maintains the elite top 10 crypto status which demonstrates the strength of the project and it made a significantly higher low compared to last cycle i.e., its holders have diamond hands. Additionally it has been in the news that there will be ETF filings for XRP in April 2024.
Based on all the history and factors indicated, we expect that XRP start to print great gains soon now that BTC ETF has successfully been approved and the market stagnation due to that is behind us.
Our target for XRP at the peak of bull cycle is around $12 mark which will be 20x return from current price level.
Please FOLLOW to stay up to date!
Note: This is not financial advise and shall only be used for educational and/or entertainment purpose. Please do your own research before investing. Crypto Markets are highly volatile and you are responsible for the risk of losing your entire investment.
