SPX500- SPY ETF trading idea -day tradeHi Traders,
SPY future running positive, Be Careful before taking any position as today will be GDP number out.
Market been choppy from last few days due Jackson hole conference
ETF

SPX500- SPY ETF trading idea -day tradeHi Traders,
Not much change from yesterday's idea.
same levels to watch

LIT - Lithium ETF setting up: 5 month basing patternBasing for 5 months. Confirmed breakout, pullback and reversing back up.
You don't need to know what's going to happen next to make money ~Mark Douglas
Lose like a pro and keep trading, or lose like a novice and quit ~Mark Ritchie

SPX500- SPY ETFHi Traders,
Market turning bearish but I believe its temporary . Just watch the level before play anything.
for swing trade wait for 1-2 positive day

Nasdaq- QQQ ETF Hi Traders,
Market turning bearish but I believe its temporary . Just watch the level before play anything.
for swing trade wait for 1-2 positive day

GLD: Cooling off 💦It is still summer, so no wonder GLD wants to refresh itself in the upper blue zone between $163.03 and $160.17, into which it has leaped so enthusiastically that we have to wipe droplets of water from our faces, watching the chart. Here, GLD should now finish wave (ii) in blue before resuming the overarching upwards movement. However, as part of our secondary scenario, there is a 40% chance that GLD might need more refreshment and thus could jump below the support at $158, diving into the lower blue zone between $159.23 and $152.88. There, it should then do a lap to complete wave alt.(4) in yellow before rising again.

SPX500- SPY ETF trading idea -day tradeHi Traders,
On daily timeframe market is still looking bullish minor pull back but it should HOLD 417 level, Jackson Hole Symposium starting Thursday. we might expect some volatility in the market

NASDAQ- QQQ ETF day trading idea Hi Traders,
On daily timeframe market has touched 50% Fib level, Jackson Hole Symposium starting Thursday. we might expect some volatility in the market
Future us running in negative - Market might gap down when open

SPX500- SPY ETF trading idea -day tradeHi Traders,
From last 2 days market is in range, watch out the support zone of Friday and 200 SMA resistance.
Market future running negative right now we might some change when EURO market will open,
Happy Friday !!

NASDAQ- QQQ ETF day trading idea Hi Traders,
Market is in range bound from last 2 weeks, Future us running negative at this stage but we might turn GREEN when EURO market open.
Watch the support level 323.33 and Major Resistance 335.63.

TLT Bond ETF Setup for Reversal to LONGNASDAQ:TLT
On the 4H Chart, TLT is sitting on minor support with major support below that.
It is near to the bottom of open Bollinger Bands and is inclined to move through
the basis line closer to the upper band.
Significant resistance is 5 and 15% upside.
I see a swing long trade with the stop loss below the major support and targets
before the major resistances, yielding a very good reward for risk.
Call options are another possibility to consider.

NASDAQ- QQQ ETF day trading idea Hi traders,
QQQ heading to 200 SMA resistance area
Future turning positive
watch out key level support - 328 and resistance 331 area.

SPX500- SPY ETF trading idea -day tradeHi Traders,
After getting 200 SMA rejection SPY facing some pressure and some other Macro news not helping the market. SPY can test the 423 and 420 level.
Be patience for the trade, market is very choppy from last few days.
Watch the premarket low and high as support and resistance.

SPY ETF - Short - ReversalS&P 500 ETF is displaying a reversal pattern where, the stock is overbought on RSI and Stochastic. Moreover, a bearish pin bar is apparent and connected with a previous swing high in the chart (trend line). In addition, MACD is making lower highs (may turn bearish soon).
Entry is at the potential retest of the Bollinger band as a resistance.
Exit is at the bottom of the Bollinger bands (support level)

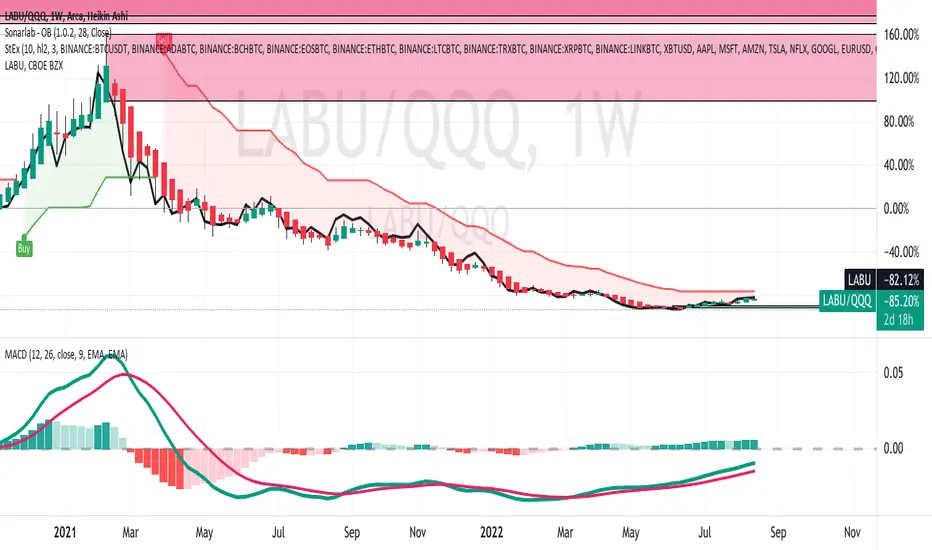
LABU 3X Leverage BIOTECHNOLOGY a potential Recession playLABU a 3x leveraged EFT in the biotechnology sector has diverse holdings.
My thesis is that biotechnology and healthcare are relatively unhinged from the broader general market.
Here I chart LABU / QQQ ratio to determine relative strength.
On this weekly chart, the ratio and so relative strength are at more than a 52 week low.
The MACD indicator shows the MACD and signal line ascending and below the histogram.;
moreover the MACD in green is running above the signal line. This favors a trend reversal.
All in all, this seems to be a setup for a long swing trade or investment.
I will take a trade in a call option with a strike 50% higher than current price
as I see a potential for a large percentage gain for LABU. The diversity of the ETF
will serve to mitigate some of the risk. A stop loss will be 1% below current price
with an expectation of more than a 50 % return in the remainder of the calendar
year but far more in the case of the call option scenario
SPX500- SPY ETF trading idea -day tradeHi Traders,
If market gap down watch the 427 level, market might find the support on 425 level.
Walmart and Home Depot earning will be out before the market open. it will influence the market sentiment.
Retails numbers will be out before market open, these are the key numbers for market. .

NASDAQ- QQQ ETF day trading ideaHi Traders,
QQQ ha broken major resistance level 330, sentiment is very bullish , market is waiting for retail sales numbers which will be out tomorrow before market open.
If market gap down watch the 330 level, market might find the support on this level.

BOIL / GUSH RATIO- Leverage 3X Natural Gas ETFsAMEX:BOIL
BOIL is the #X leveraged ETF for Natural Gas while KOLD is it inverse.
On this 30M chart I setup the ration between BOIL and KOLD.
This is to find precise swing entries without a lot of work for those only trading part time like myself.
At the highs, BOIL has peaked relative to KOLDAccordingly, this is the time to exit BOIL and enter a position
on KOLD. Conversely, when the ratio is at an inflection bottom, a trader should exit KOLD
and enter a BOIL position.
This chart shows several patterns including:
a double or triple top which may breakdown as there is a newer cup and handle potentially breaking
out above the handle in continuation of the prior uptrend. It the present chart, the Bollinger Band basis line
the uptrending of its boundaries and the MACD all favor the probability of an uptrend., the spot markeri
All in all, I am waiting to buy BOIL since natural gas is being liquified and shipped to Europe to
make electric power to supply to air conditioner for the long hot summer. XNGUSD has had dramatic
action in the past couple of months, all good for BOIL's price action.
Three evening stars or three-bar plays marked with red down arrows.
If not in a position at present, the chart should be observed for the cup and handle pattern completion
towards a resumption of the uptrend. IF so, a BOIL position could be entered.
If it fails the triple top controls the price action and
a KOLD position could be entered.
This chart demonstrates the importance of looking for patterns to help guide
higher probability setup.

YINN China 3X Leverage ETF Reverses off the bottom Swing Long
AMEX:YINN YINN is now in an uptrend with an increasing cloud score
and upgoing BB boundaries. Stop Loss at the double bottom
while the first target is the recent consolidation period
with about 15% upside to that take profit and about a
2.5 Reward to Risk
All this makes YINN a candidate for a swing long trade

LABU LEVERAGED BIOTECH ETFThis Daily Chart plots LABU to LABD ratios over time. LABU is 3X Leveraged ETF of a variety of biotechnology
stocks while LABD is the inverse.
By plotting the ratio of LABU to LABD, what can be found is the precise end of the LABU downtrend (LABD uptrend)
and reversal into LABU uptrend ( LABD downtrend).
In this case, the reversal occurred about June 17th while the SPY reached its current market bottom.
This type of analysis can be used to make trade decisions regarding a contrasting pair of stocks or forex pairs.
It makes the decisions more informed. IF going down to a 1H or 4H timeframe, the accuracies will be higher
and the pivots more frequent also making potential profits higher.
This can be used with other ETF inverses such as
GUST /DRIP
BOIL /KOLD
JDST / JNUG
YINN / YANG
SOXL/ SOXS
FAZ / FAS
TMF /TMV
By setting up all of these also with alerts such as ratio decreasing or ration increasing
a trader with very little time to trade and diversify and automate his/her trading
resulting in risk stratification and mitigation and economy of time.

SPX500- SPY ETF trading idea -day tradeHi Traders,
Watch out the key area of support/resistance I have point out on green horizontal lines.
Pre market High/Low treat as support/Resistance

NASDAQ- QQQ ETF day trading idea Hi Traders,
Watch out the key area of support/resistance I have point out on green horizontal lines.
Pre market High/Low treat as support/Resistance

STXRES Satrix Resources. Channel resistanceSTXRES reached the top of what looks like a descending channel. Some resistance is expected. Will the bottom of the channel be tested again or could we see a break of the upper channel resistance line ? Neutral right now.
