SARK The Most Profitable ETF !!If you haven`t bought SARK at the beginning of this year:
Then you should know that SARK or The Tuttle Capital Short Innovation ETF offers investors access to a short vehicle that may otherwise be difficult to execute on their own.
The fund attempts to achieve the inverse (-1x) of the return of the ARK Innovation ETF for a single day, not for any other period.
Looking forward to read your opinion about it.
ETF

SPY Inverse Head and Shoulders PatternI think SPY is forming an Inverse Head and Shoulders Bullish Chart Pattern with a target of $480 by the end of the year.
Today the Contrarian Investing is a good idea: "Buy When There's Blood in the Street"!
looking forward to read your opinion about it.

US500 1HR WK #18The final countdown... Of course there is some poor soul that went all in looking to make bank because they followed a youtube guru.

ARK Innovation ETF...Waiting for Tech to Bottom OutLooks like a solid buy near $34.00. Next buy-target below that is around the $19.00 mark.
Risk at these levels is fairly low since the upward potential is disproportionately larger based on history.

✅S&P500 WILL GO DOWN|SHORT🔥
✅S&P500 is going down currently
As the pair broke the key structure level
Which is now a resistance, and after the pullback
And retest, I think the price will go further down
SHORT🔥
✅Like and subscribe to never miss a new idea!✅

ARKK and Cathie Wood = trouble
AMEX:ARKK
Like many people, I've lost $$$ falling in love with Cathie
Cathie has literally destroyed my portfolio.
Does shares bought at $150-$130 are now worth a quarter of that.
What is going on with ARKK and are we going to see more lows?
News:
All ARKK ETF’s continue to underperform relative to the S&P 500 is growing and Teladoc Health, one of ARK Innovation ETF’s most overweight positions, just collapsed in value last week.
Unlike Bill Ackman who dumped his funds $1.1 billion investment in NFLX and taking a loss of around $400 million, Madam Cathie is adding more to her position.
Charts:
EMA ( Exponential Moving Average ): Price action is below the 200 EMA (discount buying opportunity) Price is also below 20/50/100/200 EMA and are all pointing downwards! Looks like we've been in a death cross since November 2021 and we're not coming out of it anytime soon.
TTM Squeeze: Squeezing to the bottom but it looks like it wants to change direction at the current support line (super trendline; at the bottom of the pattern).
Fib Levels: with the price below the 1 fib and headed towards the 1.618, if the current support support line doesn't hold, we could see $ARKK in the $30s...(bye bye to my $44K leap call option expiring in December).
Candle Stick: Summary of last 5 candles equate to a bearish movement; you might as well just call them a 3 black crow.
RSI: In a great position which also supports the TTM Squeeze movement... No matter what happens on May 3rd or 4th, I should just buy some more at this point.
Pattern: Falling Wedge and still falling; Need a savior.
History: ARKK seems to have lost it's hedge and it's now crashing and burning; a breakthrough will be nice.

IWM massive BreakIWM very weak in the larger time frames.
It has just broken below a very important support level opening some further targets.
If market continues to show weakness we could see IWM rolling over towards $172. Previous Support can be considered Resistance now and Stop loss.

New possible resistance level after losing the trendAfter breaking out of the upper trend channel where VEUR was trading for the last year we find a new lateral channel that finds support around 34.6 Eur and might find a resistance level around 36.95.
Looking at the volume profile on this sideways channel we can see how it is clearly P shaped, usually a sign that consensus exits on the upper part of the channel.
This could indicate that a price around 34.6 could be a great entry for a bullish investor. Personally i would wait for a breakout in the channel either to the upside or the downside. It is convinient to look at the fundamentals behind this ETF, the energyu crisis y hitting europe heavely specially the UK, the 21,7% of the holdings of this etf are located in the latter country and it is experiencing a lot of uncertanity around supply chains and energy supply.
Personally i'll wait for a breakout and a change on the situation in Europe towards year's end, and depending of its direction i would adjust my position.

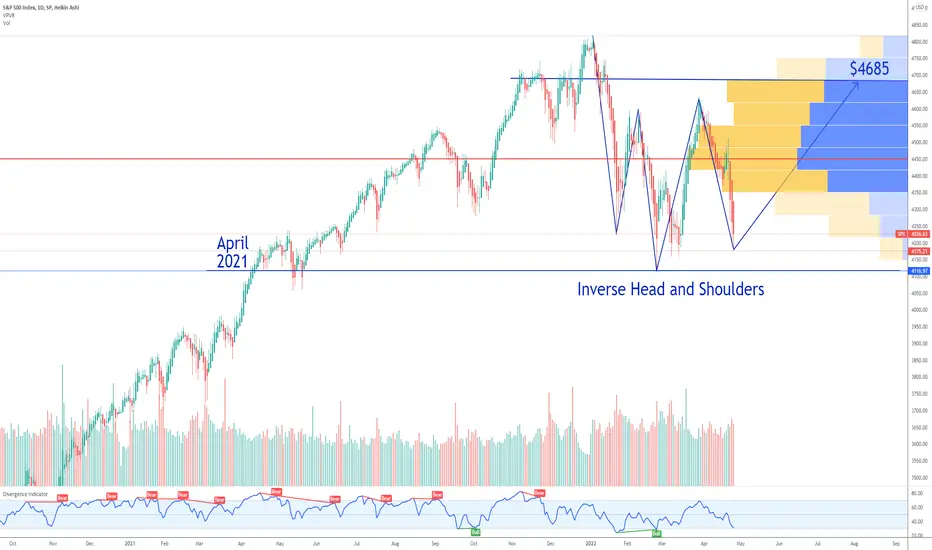
SPX S&P500 inverse Head and Shoulders Chart PatternIf you haven`t seen my last chart:
Then you should know that the inverse head and shoulders is a bullish chart pattern that can revers to the $4685 level by the end of the summer.
Looking forward to read your opinion about it.
$STXRES ETF. Fake break and a big dropLesson to all (including myself). In volatile markets adhere to what TA is telling you. The fake break (circle) indicated fading strength. This was followed by huge weakness in a very short period of time. It looks like we're on a bit of support right now. It would be interesting to see if support hold.

S&P500 Breakout Long! Buy!
Hello,Traders!
S&P500 broke out of the bullish flag pattern
Which makes me locally bullish biased
And I think that after the pullback
And retest of the broken level
We will see a move up
Towards the target above
Buy!
Like, comment and subscribe to boost your trading!
See other ideas below too!

✅S&P500 BULLISH BIAS|LONG🚀
✅S&P500 is going up now
And the pair has formed
A bullish flag pattern
Then made a bullish breakout
Which confirms by bullish bias
And I believe we will see bullish continuation
LONG🚀
✅Like and subscribe to never miss a new idea!✅

NIFTY 50 in a good state indicates by Fib RetracementFib Retracement indicates Nifty is a good for a long position
BUY ( E T F ) , Swing trade

$STXRES ETF. Resources consolidation breakoutAfter a period of some consolidation it looks like price broke the downtrend and the recent high of 9600 could become a target.

2022, the new 2018?2022 has so far left a bad taste in the mouth of many investors; the best international funds are for the most part negative, not to mention ETFs heavily exposed on the Nasdaq such as those of ARK Invest.
For this reason, having a portfolio that is not overexposed on certain assets is of vital importance.
This is why short-term speculations, led by Alibaba at a loss in my portfolio, are balanced by macro ETFs, short-term treasury ETFs, gold and commodities ETFs (for obvious reasons with great performances from the end of 2021).
The importance of diversification.
That's why, in the long run, apart from a few super solid companies like Apple and Amazon, I don't believe in heavy allocation to sector ETFs. Simply because they will hardly beat the indexes.
My year, for now, is slightly positive and I am 70% cash, because you have to be ready to enter, always with micro size, diluted over time.
We are facing 3 bad scenarios: the increase in rates by the FED and the European central bank, to counteract very high inflation (also pumped by the increase in raw materials), the coronavirus in China, with 20,000 cases per day, and a new lockdown that worries and last but not least, the war between Russia and Ukraine.
After a -10% from the high, the S&P 500 rebounded and then pulled back again. We have recently been accustomed to some pretty fast V shapes, perfect for those who have had the foresight to invest during the downturns and I really hope we can see new highs within this year.
Although, the similarities between 2022 and 2018 are starting to be evident.
Happy trading
Lazy Bull
DISCLAIMER: I am not a financial advisor nor a CPA . These posts, videos, and any other contents are for educational and entertainment purposes only. Investing of any kind involves risk. While it is possible to minimize risk, your investments are solely your responsibility. It is imperative that you conduct your own research. I am merely sharing my opinion with no guarantee of gains or losses on investments.


play $FEZ for a bounceFEZ bounced right off the volume shelf where the POC is as well. It looks like it's going to have another V-shaped recovery after selling off heavily. Its RSI is oversold, and MACD looks like it could be beginning to turn around.
Overall the weekly chart looks good. It may be smart to wait for FEZ to crack $40.50 or $41 on high volume for extra confirmation.
One could argue that there was a morning star reversal pattern if you look at the candles of the most recent potential V-shaped bottom.

BTC Prices To Watch Coming MonthsMajor events
There are two major events that will happen the coming months:
1. The merge of Ethereum from proof of work to proof of stake will happen in Q2 (if not delayed again). Then many coins will be unlocked and will cause probably a supply shock. Also a buy the rumour sell the news may happen.
2. The SEC is expected to reach a decision on Grayscale's Bitcoin spot ETF by July 6. Will this event be a pump or dump event?

HGU: Confirmed MACD Golden Cross on a monthly basisSince inception in 2007, this ETF has lost more than 90% of its value and it seems nobody is looking at it.
However, there is no denying that this ETF has been performing pretty well while techs are failing pretty badly these days.
As we can confirm MACD Golden Cross on a monthly basis, we might be facing a great opportunity to be in.
We should be aware of the risk of this ETF as it is leveraged.
Otherwise you can crack the shell and see its holdings to directly invest - extra analysis for each stock is recommended.
List of Holdings as of today
BARRICK GOLD CORP 25.28%
FRANCO-NEVADA CORP 17.69%
AGNICO-EAGLE MINES 14.22%
WHEATON PRECIOUS METALS CORP 12.45%
KINROSS GOLD CORP 3.94%
YAMANA GOLD INC 2.98%
B2GOLD CORP 2.67%
SSR MINING INC 2.64%
ALAMOS GOLD INC 1.82%
PRETIUM RESOURCES INC 1.73%

USOIL: Divergence in the slow stochastics (monthly)We have already seen about 25% decline from the $130 top in March 2022.
However looking at the monthly chart, we might be in the middle of further decline.
Notice the divergence of slow stochastics indicated in the chart, so we should be aware of further risk of decline with a strong support around $65 area.
2 interesting facts as of today:
- Interestingly MACD of weekly charts of Crude Oil Inverse ETFs, say HOD, are showing a possibility of trend change.
- Crude Oil future contracts are in backwardation. (Yahoo! finance would be a nice tool to see this.)

$TUR Turkey bullish breakoutNice breakout here on Turkey ETF TUR and close above 30week MA
I'm long shares
Technically looks like Wyckoff accumulation pattern with "Spring" action in DEC and now entering phase D
Expect a little LPS pullback , but I remain bullish above 20 zone.
First target 24 zone, implies 30 , and a possible break there , well it's been resistance since JUL 18 so would expect a massive move there.
Will add size as the trade works and on a nice pullback.

XLF (Financial Sector ETF) - Support Bounce Hammer Candle - 1DXLF (SPDR Financial Sector ETF) price has bounced up from 0.618 fibonacci support on the daily chart.
Entry (long): $37.53
Take Profit +3% (exit): $38.66
Stop Loss -1.5% (exit): $36.95
Note: Many Finance related stocks have a similar pattern on either the Daily or 4-Hour charts. Could see an industry-wide bounce up if fibonacci support levels hold this month.
-BAC (Bank of America)
-WFC (Wells Fargo)
-C (Citi Group)
-JPM (JP Morgan Chase)
-MS (Morgan Stanley)
All content is Not financial advice. Trade at your own risk.
