trend changing in vixUVXY is demonstrating higher lows and higher highs. the current pullback is likely a bounce in SPX, but if that fades we should see new low in indices with a new daily high vix keeping UVXY trending up. if were stronger in indices overnight and tuesday we should form a lower high and roll over UVXY. upper or lower horizontals are price targets, and dashed line is pivot. bottom or top of envelope are areas to close. over all the trend in vix remains bull until we breech new lows in uvxy, setting a lower high and demonstrating bear momentum.
Etfs

whether to go bull based on this daily bounce alonei onlywant to long bull breech of this pivot, short the upper horizontal, long the lower horizontal, or short a bear touch of this pivot. if sss and qqe go long, im long. if qqe and sss go short, im short. if trama gets touched,and heads down with price that adds to a bear case. if trama acts as support and rises that adds to the bull case. this applies to the full broader market spectrum, and the crypto space when the dollar is bearish for a bull crypto scenario, and dxy is bullish for a bear crypto scenario.

GDXJ: Shilly-shally…GDXJ is still hesitant to finally complete wave ii in magenta and is turning downwards again. As it can, of course, use the whole magenta colored zone between $37.26 and $24.77 to finish the overarching downwards movement, we give the ETF some more time to get its work done. However, as soon as wave ii in magenta is through, GDXJ should veer to the north, crossing the resistance at $36.58 and heading for the next at $51.92 from there. A 40% chance remains, though, that GDXJ could break through the magenta colored zone and drop below the support at $19.52, thus triggering further descent.

Today is a N/A Day (No cycle pattern) - what to expect...Today will likely be a carryover of yesterday, setting up tomorrow's TOP pattern. Because of this, I expect a bit of a rally phase today (rebounding off the lower support channel) and possibly attempting to move above 395 if there is substantial buying activity.
Yes, the Fed decision is near, but traders are still using the US equities market as a hedge against foreign market risks because of the stronger US Dollar.
Gold and Silver will likely setup another retest of recent support.
The markets are shifting and we could see a big move next week with the Fed decision.
Right now, I see the markets struggling to find support and attempting to hold above the Flag/Pennant lower channel.
Crude oil is lower - suggesting the global economic demand for oil is weakening.
Stay cautious. Follow my research. These cycle patterns are really incredible in how they predict days/weeks in advance.

Today is a Reversal/Reversion/Rally Day. Ready for it?My cycle patterns suggest today is a Reversion/Reversal/Rally day. I know it may seem strange to think that the US market may rally today after the CPI/PPI inflation data and the pending Fed rate increase - but it is what the cycle patterns say it is.
Remember, these patterns originate from a date 3+ years ago and just tell me what to expect from price on certain days. I read them like words making up a sentence. Multiple bullish cycle patterns suggest a broadly bullish price trend. Multiple bearish cycle patterns suggest a broadly bearish price trend.
Today is a Reversal/Reversion/Rally day. If we see a big rally in the SPY today - I will be content that my cycle patterns are really nailing these daily market cycles/setups.
I mean - where else can you know what is likely to happen weeks or months in advance of price actually DOING IT?
Follow my research.

TAN Solar Etf Breakout readyTAN Solar Etf Breakout ready. Since market is better perhaps we will see a nice breakout. Solar is Leading market group.

Are you ready for trading today (9-8) Inside-BreakawayAre you ready for trading today?
SPY Cycle Patterns for this week.
9-6: Breakdown
9-7: Carryover
--> 9-8: Inside-Breakaway
9-9: Breakaway
9-10: Rally
Follow my research.

SPY Cycle Patterns are incredible.Have you ever seen anything that can attempt to predict price trends 30 to 60+ days in advance? Other than Japanese Candlesticks, and quite possibly Elliot Wave, I've never seen anything have the predictive qualities of my short-term & long-term Cycle Patterns.
This is a Daily SPY chart highlighting the cycle patterns that aligned with certain days. As I'm watching these cycle patterns unfold, I'm seeing more and more details emerge.
For example, the current week showed the following:
9-4: Temp Bottom
9-5: Top/Resistance
9-6: Breakdown
9-7: Carryover
9-8: Inside-Breakaway
9-9: Breakaway
9-10: Rally
9-11: N/A
9-12: N/A
A temporary bottom, followed by a top/breakdown in trend on 9-5/9-6. The "carryover" pattern can act like a reversion price trend, or a continuation price trend. Today it resulted in a reversion higher.
Tomorrow the cycle patterns are predicting an Inside-Breakaway followed by a Rally on Friday (9-9 & 9-10).
I expect the US markets will rally higher on some news related to some moderate global crisis. This may send Gold/Silver higher and may drag Bitcoin higher as well. What I expect is a flood of moderate buying to close out this week - catching traders by surprise.

consumers starting to spend less money againin times where this is above 2 consumer defensive is winning out, and in times where this is below 2 consumers are spending more money and buying consumer discretionary goos/services. recently this chart peaked, and now weve retraced and it is reversing again. probably going to set a lower weekly high, but qqe is long and sss is green so the defensive funds are probably the best bet in terms of consumer goods.

need green sss for long term buy nasdaqrecent data suggesting the bottom is probably not in for the nasdaq means we need to see sss signal green on the monthly and cross above pivot for upper horizontals to be in play. till then were not averse to lower horizontals, or even touching the sss supply zone. qqe going long monthly would mean a long term entry averaging up into nasdaq funds would be profitable.

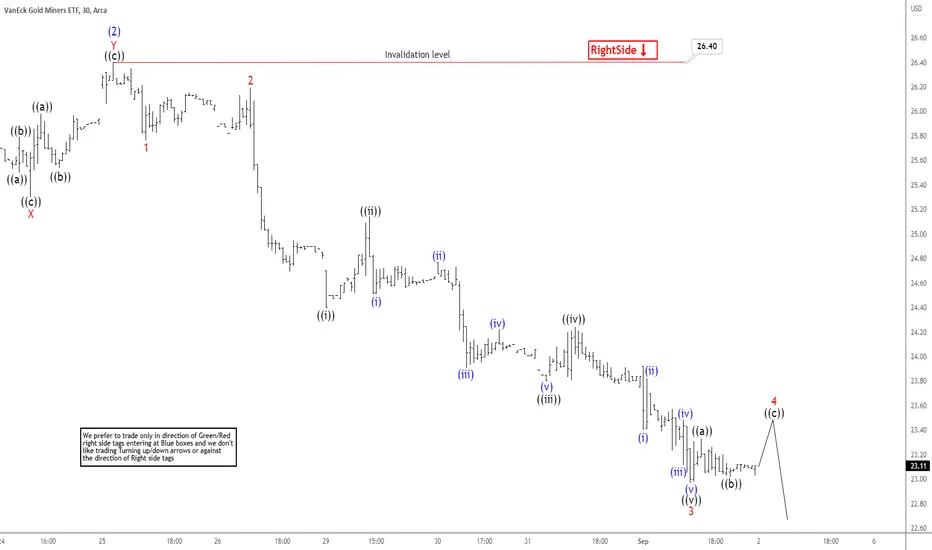
Elliott Wave View: Gold Miners ETF (GDX) Has Reached Inflection Short Term Elliott Wave View in GDX suggests rally to 26.40 ended wave (2). Wave (3) lower is in progress to complete a cycle from August 25th, 2022 high. Internal subdivision of wave (2) unfolded as a double three Elliott Wave structure. Up from wave (1), wave ((a)) ended at 25.23 and pullback in wave ((b)) ended at 25.44. ETF extended higher in wave ((c)) of W towards 26.22. Connector wave X completed as a zigzag correction at 25.30. GDX then resumed the rally in wave ((a)) ended at 25.98 and pullback in wave ((b)) finished at 25.53. Final leg higher wave ((c)) ended at 26.40 which ended wave Y of (2)
GDX turned lower in wave (3). Down from wave (2), wave 1 ended at 25.75 and bounce in wave 2 ended at 26.18. The ETF extended lower in wave 3 towards 22.96. Internal subdivision in wave 3 unfolded as an impulse. Wave ((i)) ended at 24.40 and bounce in wave ((ii)) ended at 25.14. The instrument extended lower in wave ((iii)) of 3 towards 23.80. Then a shallow rally completed wave ((iv)) at 24.24 and last leg lower ended at22.96 completing wave ((v)) of 3. Near term, we are developing a corrective wave 4 and afterwards, it should continue lower to end wave 5 of ((3)). As far as pivot at 26.40 high stays intact, expect any rally to fail for further downside.
vix spike losing steameverybody was ready for a spike in vix, and now that we got it UVXY looks like it might turn SSS signal red as it has fallen below sinking TRAMA hourly. horizontals mark out short, long and pivot and ive drawn a couple scenarios. i only long UVXY when qqe and sss are green.

How to manage Capital in an Economic DownturnThe Great Recession is not the first time that the economy has experienced downturn or recession. The last one occurred during the early 1980s, and it caused unemployment to spike and home prices to drop. However, that doesn’t mean that a similar situation cannot happen again. The effects of a recession have lasting implications for consumers and businesses. When consumers have less money to spend on goods and services, businesses must make adjustments in order to remain profitable. In fact, recessions can lead to innovation in industries like technology where creative minds come up with cheaper solutions for everyday problems. Here’s a look at how consumers are affected by recessions, what they’re doing about it, as well as how you can manage your money in these challenging times.
What Happens When the Economy Recovers?
When the economy recovers from a recession, there are typically two ways that consumers spend their money. One way is that consumers continue to spend on the same products and services that they bought before the recession. The other spending trend that occurs during a recovery is that consumers change the products and services that they spend money on. The reason for this change in spending habits is that consumers have changed their priorities during the recession. When a recession has caused consumers to have less disposable income, they tend to make their money go further. When consumers have less disposable income, they can no longer afford to spend money on certain products and services.
The Impact of a Recession on Consumers
A recession can have a lasting impact on consumers. Consumers who experience a recession tend to have less confidence in their ability to manage their money. This can cause lasting damage to their credit scores as they seek out lower interest loans or take out a repayment plan. A recession can also impact a consumer’s career and ability to earn a living wage. When a recession occurs, businesses have to make changes to remain profitable. This might include laying off employees or reducing the hours that part-time workers are scheduled for. A recession can impact consumers’ ability to buy a home as well. Mortgage rates tend to be higher during a recession as investors seek out higher returns because of the increased risk of default.
Consumer Responses During a Recession
When a recession occurs, consumers are likely to make changes to their spending habits in order to save money. The first thing that consumers are likely to do is reduce discretionary spending. Discretionary spending is the money that is spent on entertainment activities, eating out at restaurants, shopping for luxury items, and on travel. Another common response of consumers during a recession is to change how they get their services. When a recession occurs, consumers are likely to change how they get their banking, insurance , and healthcare services as well as how they pay their bills.
How Consumers Can Manage Their Money in a Recession
The best way for consumers to manage their money during a recession is to make a budget. A budget for spending should include all of the money that goes out of your bank account each month as well as how much money comes into your account. When making a budget, it is important to consider your expenses and income to see if there is any room in your budget to make changes. This can include looking at your monthly expenses and trying to reduce the amount that you spend on certain items. When you are making a budget, it is important to keep in mind that you will have to change it as time goes on. As your income changes, you may have more or less money available to spend each month. Likewise, you may also have more or less expenses to pay each month.
Investing in the Stock Market: The stock market is one of the riskiest investments you can make. It’s also one of the most profitable when things go right. The stock market has its ups and downs, but it always rebounds in the long run. Even during a recession, savvy investors know how to make money in the stock market by investing in stocks and other types of securities. Investing in the stock market may seem intimidating at first, but it’s not as complicated as you think! In this Educational article, we’ll show you how to invest in the stock market if you have less than $5,000 to invest. With these tips and tricks to invest in a recession, you’ll be on your way to becoming a successful investor with an impressive portfolio sooner than you think!
How to invest in the stock market with $5,000
Before you dive head first into the stock market, it’s important to know how much you have to invest. While the stock market can be rewarding, it’s also one of the riskiest investments you can make. Investing in the stock market is all about risk and reward — the more risk you take, the bigger your reward can be. Investing in the stock market requires at least $5,000 in order to diversify your portfolio. Diversification is key to long-term success in the stock market. Rather than putting all of your eggs in one basket, diversification allows you to spread your funds across many different investments.
Diversification is key
When you’re investing in the stock market, it’s important to diversify your portfolio. Diversification allows you to spread your funds across many different investments for two reasons: risk reduction and opportunity enhancement. Risk reduction is accomplished by not putting all of your funds into one investment. Instead, you’re spreading the funds across different types of investments. Opportunity enhancement allows you to take advantage of different types of growth opportunities.
Understand why you’re investing
Before you invest in the stock market, it’s important to understand why you’re investing in the first place. If you’re investing for growth, you’re looking for stocks that are currently undervalued to increase in value over time. If you’re investing for income, you’re looking for stocks that pay dividends.
Take advantage of no-fee investments
When you invest in the stock market, you pay fees for the management of your portfolio. Mutual funds and exchange-traded funds (ETFs) are mutual funds that are pre-packaged and purchased as a single unit. Mutual funds are professionally managed funds that are offered by financial institutions, whereas ETFs are professionally managed funds that are traded on a stock exchange. If you’re investing a small amount of money in the stock market, you’re better off choosing mutual funds or ETFs that have no or low management fees. Mutual funds and ETFs with no or low management fees are often referred to as no-load funds.
Shorting ETFs can be profitable (This strategy is best suitable for Professional Traders)
Shorting ETFs can be profitable if you’re investing a large amount of money in the stock market. Shorting ETFs allows you to profit from a declining market. Shorting ETFs is a very risky investment strategy and is not recommended for beginners. If you’re interested in shorting ETFs, be sure to talk to a financial advisor before making any investments.
Additional Note: When the global economy is on the verge of recession, investors are scared and their first thought is to run towards things that are safe. In recent years, markets have grown to distrust risky investments such as stocks and other volatile assets. When the global economy is about to go into recession, commodities like gold and oil usually become hot properties for investors wanting to preserve their capital. There are a number of asset classes that thrive during a recession: real estate, bonds, and value stocks—or anything with a low correlation to the stock market. However, at the same time there are also some that suffer: high-beta stocks; growth stocks; growth real estate; luxury goods; emerging market equities; and anything else with a high correlation to the stock market. In our next article we will analyze Gold and Silver as an hedge against inflation and their performance in an economic downturn.
Conclusion
The recession that took place in the early 2000s is a great example of how a recession can change the way consumers spend their money. During this recession, consumers were likely to spend more money on food and clothing since those were necessities that consumers could not do without. When the next recession occurs, consumers may change their spending habits once again. However, it is important to remember that a recession is a natural part of the business cycle. It is likely that consumers will continue to spend their money in the future even in the face of a recession. Investing in the stock market is a smart way to diversify your investment portfolio. It’s also a great way to earn passive income through dividends. The best way to invest in the stock market if you have less than $5,000 to invest is through mutual funds or ETFs with no or low management fees. Shorting ETFs can also be a great way to make money in a recession if you have a large amount of funds to invest.
Even though the technical definition of a recession has been changed/modified it is important to know that unemployment rate determines the condition of a recession.

is this daily rejection from resistance or a bear trap?SPY and emini es1! futures have signaled the start of daily consolidation for the S&P500, and a rejection from the monthly trendline. this idea is simple. if we confirm a lower monthly high, and the beginning of a reversal by remaining below the pivot i would aim for sss supports and lower horizontals. if we remain rangebound, and break out above pivot i would aim for upper horizontals. this resistance is stiff, and it would not be surprising to see SPXL a good 4-8% lower here. im tracking the underlying index with SPY, but the instrument i would use is SPXL. if we gap up id wager intraday turns bearish, and if we gap down i would look to close that gap with bearish activity to follow.

SPY ETF - Short - ReversalS&P 500 ETF is displaying a reversal pattern where, the stock is overbought on RSI and Stochastic. Moreover, a bearish pin bar is apparent and connected with a previous swing high in the chart (trend line). In addition, MACD is making lower highs (may turn bearish soon).
Entry is at the potential retest of the Bollinger band as a resistance.
Exit is at the bottom of the Bollinger bands (support level)

Commodities are back, $UNG near breakoutThe natural gas ETF is forming a cup & handle with pivot buy at $31.60. This behavior signals a comeback for stocks in the gas industry.
Some of them are NASDAQ:NFE , which I was stopped out in June. NYSE:VET and AMEX:LNG . These 4 are in the top of my watchlist.
All are in confirmed uptrends and leading the sector. Several oil stocks also look good but I think that they are just following the gas stocks. I say this as the oil ETF AMEX:USO isn't as near of a new high as AMEX:UNG .
Look for stocks with gas exposure.

money flowing into biotech sectorxbi is displaying strength on the daily as far as qqe and sss strategies are concerned. if we stay above pivot im targeting upper horizontals as rising 4hr triangle could bull pennant, and if we fall beneath that pivot resisting from rising 4hr triangle i would target lower horizontals.

one minor hickup for broader marketssemiconductors have been a lead bear in this downturn since december, and a lead bull on the monthly bounce from the lows since july. if we roll over here setting a lower high on this etf around the first upper horizontal i would look for broader markets to consolidate on the daily. if we treat pivot as support i would target the upper horizontal and look for continuation in broader markets. most likely scenario is a gap down followed by a rally to close with price action after to be determined.

semiconductors could be in for a huge bull moveif we stay above pivot, there is nothing stopping the top of the sss supply zone from being reached, and qqe rsi signaling bull with a green sss on the weekly. if we pivot higher i would aim for upper horizontals, if we fin ourselves making a bear cross at this key resistance i would aim for lower horizontals if sss stays red.

Watch Crude Oil, IYC, & GOLD. The Markets Entering New PhaseGold, Crude Oil, IYC are about to enter a new phase. Take a look at 2006~2014 as a perfect example of what's next. Got Gold?
This is going to be an epic run if you know what to expect.

perhaps vix will reach for the supply near $12if we get continuation over this pivot, and a consoladative effort is made finding a higher low on longer timeframes we should trend toward the upper bands and horizontals. if we find a lower high, and bears show up to vix around the pivot we should trend below the lower signal and horizontal.

vix coming to critical level of supportweve only seen this low in uvxy 3 times, they were all this year, and they all happened with broader markets in a downtrend. all im seeing right now is buys on uvxy, and if the selloff continues with multiple sectors like xlf, xlv, spy, qqq, iwm, and especially soxl hitting new lows of the day at the same time its almost a guarantee that vix pops once again at this level on the daily targeting the upper horizontal (high 13s/low 14s), and if the bounce continues with sector rotation occuring and consolidation forming in major indices this etf is headed for the lower horizontal (high 8s/low 9s).

either/or nasdaq breakout or bullltrapif we break out in tqqq above the 28.50 level, id be long targeting the 32.33 area. if we break down below 24.10 however id look to short it down to around 20.11. nothing fancy here but you can see we are on the verge of breaking out in the nasdaq, and if we fail this resistance area it will probably take us much lower.
