BTC: Bullish Breakout On The Brink of Daily Golden CrossBitcoin has set a clean series of higher lows creating a clear uptrend on the daily chart. If BTC is able to break out of the ascending triangle, I would watch for a 14% to 16% move to the next large resistance area around $59,000.
A Golden Cross is to follow and this could be a major indicator for short-term to medium-term strength.
RSI showing an attempt at a trend change as it looks to break above upper resistance. Look for RSI breakout above resistance as an indicator for strength. Strong continued volume will be a great second indicator to look to next.
If Bitcoin confirms breakout on strong volume, I would watch for the rest of the market to follow.
Monitor capital flows around the market ( BTC-->ETH-->ADA/LTC/XTZ) and ride the bull.
ETH-BTC

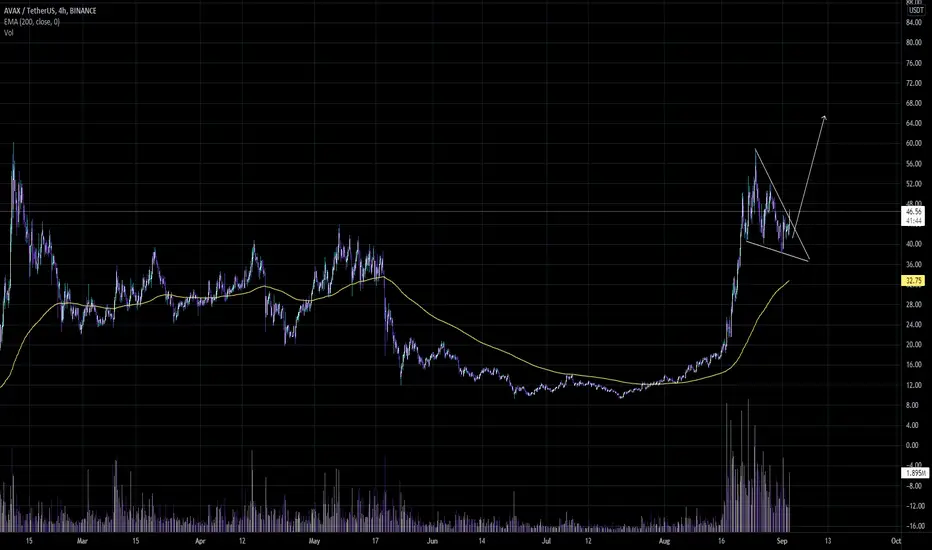
AVAX|USDTHey hey my friends👋
Do not miss out on AVAX, it is a top layer project that moves with other large caps - buyyyyyy
ETH/BTC Spread: Extended Fifth Underway!Readers who followed my calls know that I like to look at the ETH/BTC Spread because it serves as a risk on/risk off barometer to the crypto market. Ethereum has resumed its uptrend and is now significantly outperforming Bitcoin. The great decoupling is finally underway after weeks of it doing nothing. As the ratio became almost to the point of going out of my blue channel, I started to be worried that my analysis would be wrong but it's not the case with the latest developments. The ratio is now around 0.07 ETH per 1 BTC. I expect this ratio to go as high as 0.18 ETH per 1 BTC in the upcoming months!

Strong markets in Europe maintain risk-on sentimentMarkets in Asia and especially in Europe started September strongly after higher-than-expected inflation in the eurozone and very optimistic comments from ECB Vice President Luis de Guindos, who said that the eurozone economy is growing faster than the ECB expected, hinting at an upward revision of the central bank's growth forecast. On the downside, German retail sales disappointed in July, falling 5.1% month-on-month. Eurozone manufacturing PMI was lower than expected, but remained near record levels. August, normally a complicated month for the stock market, saw several record closes for the S&P 500 and Nasdaq 100, with US equities pointing to a positive performance on the first day of the new month. The important 10-year US Treasury yield rose well above 1.3% again (currently at 1.32%). The USD remains weak ahead of the US jobs report in focus on Friday. Oil prices remained in a sideways range ahead of today's OPEC+ meeting. Ethereum broke through $3,500, the highest level since May 18. Bitcoin continues to trade in the $47K - $48K range.
Despite rising expectations that central banks will gradually move away from pandemic-era stimulus programs, markets continue to rise, showing that investment banks remain confident that the sustained rise in the stock market will continue. Statements from ECB officials showed that the ECB is optimistic about economic developments in the eurozone, but also that the conditions for a gradual withdrawal of stimulus measures are almost met. Higher 10-year US Treasury yields can be seen as an indicator that US investors also believe that economic growth will continue for longer. September was the worst month for equities in the last two decades, and we also see hedge funds preparing for a reversal. For now, markets remain optimistic, waiting for more clues on the Fed's plans for the coming months. The ECB's optimistic comments have eased growth concerns for now. Risk sentiment remains positive, supporting risk-sensitive currencies such as the AUD, NZD and emerging market currencies. The rise in the EUR is likely to continue as expectations rise that the ECB has started internal talks on scaling back stimulus measures, which the ECB will then report on in detail at the upcoming ECB meeting (on Sep 9).

ETH Ahed Bitcoin... Strongly Grow of ETHEREUM -> 10,000in these times Ethereum has performed much better and stronger than Bitcoin
Wee looking onchain data every day and ethereum have strong data for its growth
Look at ETH/BTC' Chart
i waiting for ethereum's price 8,000 to 10,000 for next three months

ALT SEASON IS HERE WITH ETHEREUM LEADING THE WAY! Get your Lambo pre-orders ready! It's alt season baby!
Taking a look at the dominance charts for BTC, ETH, and the remaining alt pairs, you can see the transition that is happening. BTC's dominance is going down as ETH and the other alt pairs' dominance is climbing. You probably have noticed how well the alts were holding up in the most recent BTC dumps. This is probably why. I am anticipating BTC to fall to the mid-to-low $40k levels as alt/btc pairs continue to climb. I will probably time my alt entries toward the bottom of BTC sell offs to maximize in value. I am also going to be selective in the alt/btc pairs that I choose as I think certain alts with high market caps will outperform many of the lower cap alts. I'm just going to buy and hodl until we're lunar. Who's with me?!

Cryptomania Is Back - Afghanistan Is BullishThis week is the beginning of September 2021, the twentieth anniversary of the horrendous terrorist 9/11 attacks on the United States. Soon after, the US began military operations in Afghanistan, a hotbed of harboring terrorists under the Taliban.
It took twenty years, four US Presidents, trillions in military expenses, and many lives to achieve the goal of replacing the Taliban with the Taliban. On August 31, the US will officially leave Afghanistan, and it will not be the first superpower to learn a lesson in the mountainous, tribal country. The Russians paid a price in the 1980s when they left the nation after failing to achieve military objectives.
Bitcoin and Ethereum rise above the midpoint of a very volatile move since April and May
The market cap is back above $2 trillion
Afghanistan is bullish for cryptos- Portable wealth that transcends borders and scrutiny
The Taliban’s return shatters faith in foreign policy
Weak governments weaken currencies - Expect the evolution of the crypto revolution to continue
Tens of thousands of Afghans that assisted the US and NATO are now in a dangerous situation at the hands of the new leadership. While promising to be a “kinder and gentler” Taliban, the punishment for treason is likely to cost many lives. Moreover, the strict interpretation of Sharia Law will bring a return of brutal punishments and human rights violations.
Scenes of the crowds of Afghans descending on Kabul’s airport in the final days of the US and NATO presence and the terrorist attack at the hands of ISIS-K were heartbreaking. While tens of thousands left their homeland to start over, others are stuck as the borders have sealed. Over history, we have seen many events where refugees fled their homes carrying little more than the shirts on their backs. The events over the past weeks strengthen the case for means of exchange that transcend borders and are easily portable. The case for cryptomania may have never been more compelling than right now.
Bitcoin and Ethereum rise above the midpoint of a very volatile move since April and May
Bitcoin reached its most recent all-time high on April 14, the day of the Coinbase (COIN) listing. Ethereum followed, making its high in May. Over the past years, cryptocurrencies reached new peaks on the back of supportive events. In late 2017, the leading cryptocurrencies rose above the $20,000 level for the first time when futures contracts began trading. Meanwhile, the parabolic moves that took the two leading cryptos to highs in April and May ran out of upside steam, and both more than halved in value, reaching lows in late June.
China’s ban of crypto mining and trading and news that Elon Musk’s Tesla (TSLA) decided not to accept Bitcoin for its EVs because of the carbon footprint helped push crypto prices appreciably lower from the highs.
As the weekly chart shows, Bitcoin dropped from $65,520 to a lot of $28,800. The midpoint of the move stands at $47,160. At the end of last week at $48,030, the leading crypto was above the mean and had probed above the $50,000 level on August 23.
The market cap is back above $2 trillion
The overall market cap of the cryptocurrency asset class peaked above the $2.4 trillion level when Bitcoin and Ethereum were on the highs in April and May. The correction sent it well below $1.4 billion. As of the end of last week, the asset class’s value was back on the upswing, over the $2 trillion level.
According to CoinMarketCap, on Sunday, August 29, a total of 11,468 cryptocurrencies had a market cap of over $2.088 billion, with Bitcoin and Ethereum accounting for 61.8% of the value. Meanwhile, the other 38.2% was spread over 11,466 tokens. Only 94 tokens or 0.82% of the asset class have market caps above the $1 billion level, so there is plenty of room for growth.
While two trillion is a huge number, considering Apple’s (AAPL) market cap was $2.,456 trillion on August 27, cryptocurrencies remain an emerging asset class that poses little systemic threat to the financial system. However, the potential for disruptions will rise with the value over the coming months and years.
Afghanistan is bullish for cryptos- Portable wealth that transcends borders and scrutiny
Capital flight occurs when assets or money flow out of a country because of an event of economic consequence or as the result of economic globalization. There are many historical examples of people fleeing their homeland because of a change in the political landscape.
In 1930s Nazi Germany, many people fled to other countries with only the shirts on their backs. Some carried gold and diamonds as flight capital to assist in starting a new life in another home.
The latest example comes from Afghanistan, where the sudden takeover by the repressive Taliban caused panic to get western citizens and Afghans that assisted in the two-decade failed war effort out of the country. As the Taliban took control of Kabul, banks shuttered, and it became impossible to withdraw cash. Those with the foresight to open cryptocurrency accounts could carry a flash drive or secure password out of the country, protecting their wealth and savings.
Cryptocurrencies that sit in computer wallets in the cloud are portable wealth instruments that transcend borders and scrutiny and are likely to gain utility and acceptance in the aftermath of the situation in Afghanistan.
The Taliban’s return shatters faith in foreign policy
Meanwhile, the US and NATO defeat at the hands of the Taliban after a costly twenty-year war and the surrender of control, leaving many at risk, has divided allies. Criticism over the retreat logistics could change the US’s role as a world leader over the coming years. Afghanistan’s legacy could make countries think twice about the US commitment to world security.
We could see the event trigger other political changes as some interpret US foreign policy as weakened. China has made no secret of its desire to “unify” Taiwan, which it considers a part of Chinese sovereign territory. Russia has designs on influence in Ukraine and other bordering former Soviet bloc countries. After a twenty-year war where the Taliban and terrorist organizations believe the US occupied their lands, the potential for attacks in the US and NATO countries will increase. Afghanistan is back in the hands of a government with a history of harboring terrorists that seek to strike outside its borders.
Fiat currencies reflect the full faith and credit of the governments that issue legal tends. The dollar may still be the world’s reserve currency, but the standing along with all fiat currencies has taken a giant step backward. Monetary and fiscal stimulus have diluted the currency values, and the foreign policy missteps have taken the US down more than one notch in the world’s eyes. The bottom line is the faith has declined, and the credit is suspect, weighing on the dollar and all other fiat means of exchange.
Cryptocurrencies are the embodiment of libertarian ideology, returning power to individuals. The decline in faith and credit only bolsters the case for the burgeoning asset class.
Weak governments weaken currencies- Expect the evolution of the crypto revolution to continue
An almost perfect bearish storm has descended on fiat currency markets. It is challenging to watch them depreciate because the foreign exchange arena is a mirage.
We watch the value of one currency versus another; the dollar versus the euro, the euro versus the pound, the dollar versus the yen, and the many other cross-currency relationships. It is easy to identify when one currency weakens against another. However, what is not readily apparent is the decline of the entire fiat currency asset class.
Inflationary pressures erode currency values. In 2019 and 2020, gold rose to a new record high in almost every currency on the planet. Over the past months, commodity prices have increased to multi-year, or in some cases, all-time highs. The US Fed calls the inflationary trend “transitory,” blaming it on supply chain bottlenecks and other pandemic-related reasons. Meanwhile, the Fed, other central banks, and governments planted the inflationary seeds with a tidal wave of liquidity, artificially low interest rates, and a tsunami of fiscal stimulus to stabilize the US and global economy because of COVID-19. The currency markets were already under pressure from a credit perspective. Afghanistan is another blow to the faith component of their value.
Cryptocurrencies are in the right place at the right time, and timing is critical in markets. Expect the evolution of the cryptocurrency revolution to continue. The technical trends remain higher. Moreover, the underlying fundamentals on the political and economic landscapes favor the continued decline of fiat values, lifting the potential for gains in instruments that embrace fintech.
Cryptomania is back, and the events in Afghanistan add another reason for the asset class to thrive. As the prices rise, expect the speculative fever to reach even higher levels over the coming months and years as market participants search for the next Bitcoin or Ethereum.
Use the link below to sign up for early access to articles and more.
Trading advice given in this communication, if any, is based on information taken from trades and statistical services and other sources that we believe are reliable. The author does not guarantee that such information is accurate or complete and it should not be relied upon as such. Trading advice reflects the author’s good faith judgment at a specific time and is subject to change without notice. There is no guarantee that the advice the author provides will result in profitable trades. There is risk of loss in all futures and options trading. Any investment involves substantial risks, including, but not limited to, pricing volatility, inadequate liquidity, and the potential complete loss of principal. This article does not in any way constitute an offer or solicitation of an offer to buy or sell any investment, security, or commodity discussed herein, or any security in any jurisdiction in which such an offer would be unlawful under the securities laws of such jurisdiction.


ETH - Trend-Following Setup!Hello everyone, if you like the idea, do not forget to support with a like and follow.
ETH is approaching strong daily support in green so we will be looking for buy setups.
Before we buy, we want the buyers to prove that they are taking over again.
You don't want to buy a bearish market right?
on M30: ETH is forming a channel in red but our upper trendline is not valid yet, so we are waiting for a new swing high to form around it to consider it our trigger swing. (projection in purple)
Trigger => Waiting for that swing to form and then buy after a momentum candle close above it (gray zone)
Meanwhile, until the buy is activated , ETH would be overall bearish can still trade lower.
Good luck!
All Strategies Are Good; If Managed Properly!
~Rich

THETA can 4x your ETH bagTHETA against ETH on Monthly Time Frame:
- Clean Uptrend
- Approaching Support area currently
- Great RR
- Volume missing currently
I'd like to see BIG MONEY interest here through Volumes

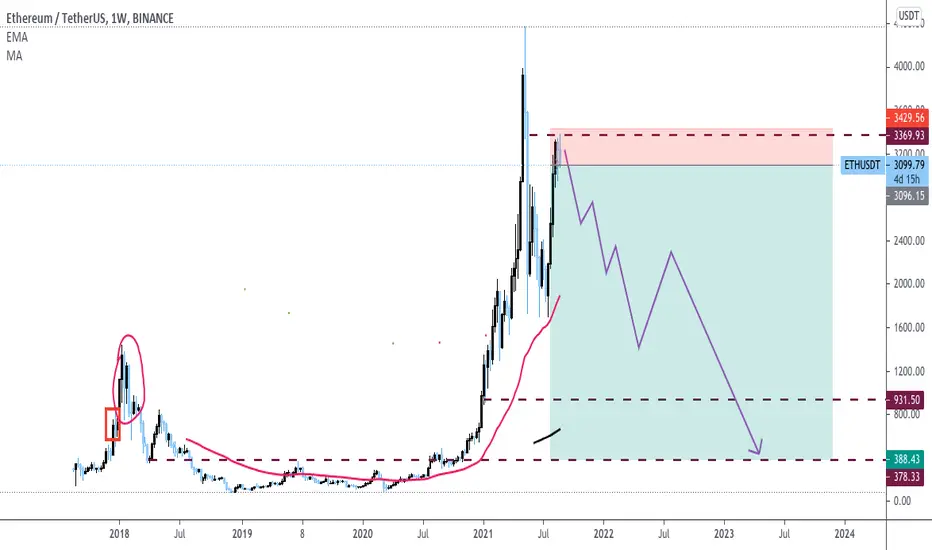
ETH/USD still worth the money to short itAnalysis: ETH looks overvalued just like the other altcoins on the market. BTC peaked as well together with most of the exchanges. I am not planning to buy ETH below 400$. We will come back to this chart after few years. Our community is growing due to our professional guidance, so take this chart as your best friend in the upcoming future.
Crypto Market Update 8.24.2021 Part II - AltcoinsIn this continuation, I talk more about the broader market, and include brief analysis for Ethereum, Cardano, NEO, XLM, UNI, and DOT.
This is not financial advice! This is meant for speculation and entertainment only. Thank you for watching.
-Victor Cobra

ETH/BTC- Broke out and confirmed supportEth/BTC to 0.115 by September 30th. IMHO
These are my personal notes for backtesting and reference. Giant bull pennant. strong tests and s/r confirmations.
0.115 eth/btc would put us very close to the flippening. Of course we can't put a number on it without a number on $BTC. But if we were to imply a $100K BTC that would equate to $11,500 ETH/USD pair.

7th Series of Altcoin Buying Areas!Hi followers and other TradingView users,
It's been a while since the last "episode" of this series. There was a reason behind that, obviously the market, the slow market. Now we have seen some volume and quite strong breakouts have occurred so it should be the correct time to catch some moves after the breakout or after the correction, the choice is yours!
So let's start it: comment TWO of your favorite altcoin, not ten not five, TWO :), hit the LIKE button, click follow to get the analysis of them as fast as possible. After you have done that your favorite named coins into the list!
Please, name ONLY ticker or full name and ticker.
Example: ADA, or CARDANO (ADA). Make it a bit easier for me ;) Thank you!
As always, Top mentioned altcoins get analyzed, pointing out breakout areas and if they get a correction then pointing out strong buying areas from lower prices!
Breakout areas are a bit riskier but whoever has been more patient than through the series the lower price ranges (buying areas after the correction) have been amazingly precise.
Stay healthy,
Vaido

BITCOIN - SCALP TRADING AND MOREHello trading friends,
This is an #Scalp trend for BTC coming time.
We have seen since the power volume trend line 44K increasing trend, The day update are still into uptrend since 44K + and will only change after #BTC hitting 48400 with time frame. when we enter that Price action as its the important trend zone, Bitcoin could open a new downtrend for the #SWING and day trade.
There are 3 different trends we chart.
#Scalp trading - the moment expecting
#Swing and day trend expecting: The expecting of next trend and day trend
#Main trend - This means the long-term trend. for example, Maintrend can take 3 months before it shows trends.
Back to the trend and to the chart.
This is a swing trade update, the trend at this moment looks to get a new breakdown trend #scalp, this means not that fully day trend is into breakdown trend, as it is still into an uptrend, this will only change after hitting 48400 with time frame.
#For an uptrend Scalp trend should confirm the 50667
Manage the risk always fine.
✅Like and subscribe to not miss a new idea!✅ Thank you
# Manage always your risk, nobody knows the future - all depending on Data, trends, and whale effect
All our charts are not advice and you are responsible for your own investment
Have a great day!

ETH - Trend-Following Setup!ETH is overall bullish trading inside our orange channel so we will be looking for Trend-Following Buy setups as it approaches the lower orange trendline.
Moreover, the area 2950-3000 is a "Resistance turned into Support".
So the highlighted purple circle is a strong area to look for buy setups as it is the intersection of the green support and lower orange trendline.
As per my trading style:
I will be waiting for it to approach the highlighted purple circle area to look for buy setups (like a double bottom, trendline break, and so on...)
Knowing that Ethereum can still trade higher from here.
And we would be overall bullish unless the sellers manage to break below the green zone.
Always follow your trading plan regarding entry, risk management, and trade management.
Good luck!
All Strategies Are Good; If Managed Properly!
~Rich

GRTUSDT GRT USDT complete the 2nd wave and making bull flag keep eyes on BTC and take entry after pullback

ETHBTC Consolidation will be the key for Altcoin strength. ETHBTC has been in consolidation for the past 4 months. Once this starts to breakout there can be alt season in which the likes we haven't seen before. ETH out performing BTC at these levels will be key to understanding when to take the bigger risk on plays. COINBASE:ETHBTC

$ETH is setting up for a double bottom 30 MIN chartWith #Ethereum possibly hitting the 55.8% FIB and the 200 EMA on the 30-minute chart, we could see a nice bounce.

$BTC Levels of support/resistance & FIB retracement levelsIf we can hold the current FIB level, we're looking at a bullish push towards 61.8%. Trade the ranges shown inbetween the grey and green lines.

ETHBTC still not the time to shineETHUSD has done great in last week, outperforming BTC as we can see with current rise of ETHBTC. But ETHBTC is still within a descending triangle, and descending triangles on the ETHBTC pair have not been kind, with almost 100% break down.

ETH/BTC wedeg pattern ETH/BTC chart in time daily so bullish
but in mid-term a little bearish...
tank a lot for attrntion
HOB
@PRO4SSOR
