Why Ethereum’s Will 10×🚀 Ethereum’s Next 10×: Why bank-grade adoption + the stable-coin avalanche make a moonshot look conservative
Big banks are building on-chain right now. JPMorgan & Bank of America began 2025 pilots for dollar-backed tokens that settle on Ethereum, while Societe Generale just unveiled its USD CoinVertible stable-coin on main-net.
Stable-coins already move more money than Visa + Mastercard combined. $27.6 trillion flowed through stable-coins in 2024—most of it routed over Ethereum block-space.
Ethereum clears four-fifths of that stable-coin volume. More than 80 % of all stable-coin transactions occur on ETH or its L2s, locking in network effects that rivals can’t match.
ETF wall-of-money is already hitting the gate. 2025 Ethereum ETFs posted a record $743 million month of inflows—the strongest vote of institutional confidence to date.
ETH supply keeps shrinking while demand spikes. Post-Merge burn has removed roughly 332 k ETH, flipping issuance negative; base-line inflation is now < –1.3 %/yr.
30 million ETH is locked in staking, slicing liquid float by 25 %. The yield engine tightens supply just as banks and ETFs need inventory.
Real-world assets are going token-native. Tokenized bond issuance jumped 260 % in 2024 to €3 billion, and virtually every pilot settles on ERC-standards.
Layer-2 roll-ups slashed average gas fees to <$4. Cheaper block-space makes day-to-day payments viable, driving still more stable-coin throughput (and fee burn).
User base is exploding toward mass scale. Active ETH wallets hit 127 million—up 22 % YoY—showing that retail, devs, and institutions are onboarding together.
Energy-efficient PoS removes the last ESG roadblock. With > 99 % less energy use than PoW chains, Ethereum checks the sustainability box that banks and asset managers need for wide-open deployment.
Bottom line: when TradFi giants plug directly into Ethereum rails and stable-coins dwarf legacy payment rails, every transfer torches a little more supply. Add the ETF flywheel and a vanishing float, and a 10× move shifts from “moon-boy” to math.
OTHER EXAMPLES
TSLA
www.tradingview.com
Total 2
www.tradingview.com
MartyBoots here—trading for 17 years, and I would like to hear YOUR take!
👉 Can Ethereum really 10× from here? Drop your best argument below, hit the 👍 if you learned something, and smash that Follow to stay in the loop on every crypto deep-dive I post.
ETH-D

ETHUSDTThis is very easy...
best support level 2300 to 2500 for jump price. but was needed for jump price for get enrgy for movement to high levels by fake breakout.
First level of resistance 2800 to 3000.
⚠️Control Money Management in your capital.

$ETH clear for an impulsive move to $3600?CRYPTOCAP:ETH has slowly but surely cleared resistance, with just the swing high to tackle which will activate another trade signal in my Trade Signals Substack.
Major support High Volume Node, daily pivot and daily 200 EMA proved tough support and demand continues to come in.
ETFs had an astonishing amount of inflows yesterday at $200M+
Analysis is invalidated below $2100
Safe trading

#ETH Update #2 – July 10, 2025🟢 #ETH Update #2 – July 10, 2025
Ethereum has formed a new high above its previous impulsive leg. Although this peak is lower than the one a month ago, the current structure looks healthy. During this move, ETH left an imbalance around the 2373 level, which aligns closely with a potential retracement zone. Volume appears to be decreasing or reaching exhaustion, suggesting the rally may be losing strength. A correction towards 2685 could be on the table. For now, the setup does not favor either a long or short position.

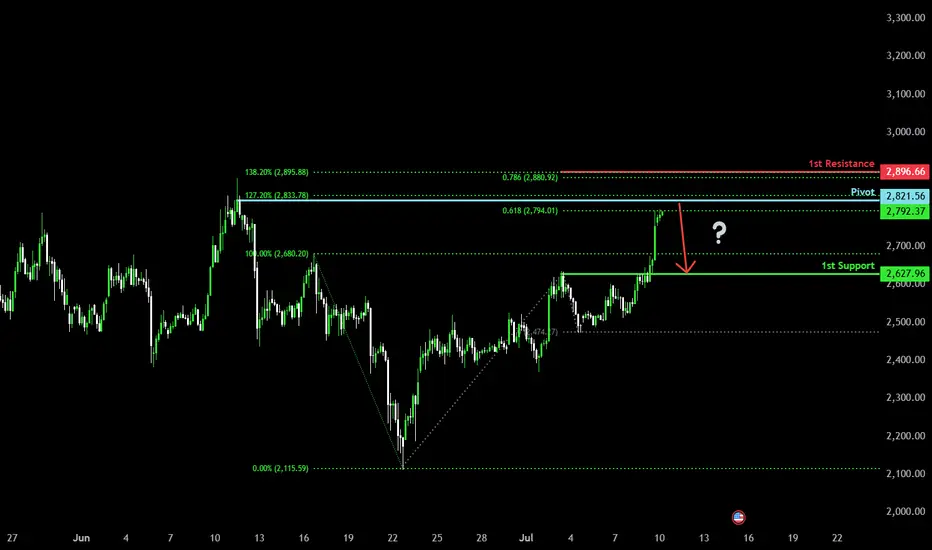
Heading into pullback resistance?Ethereum (ETH/USD) is rising towards the pivot, which has been identified as a pullback resistance and could reverse to the 1st support which acts as a pullback support.
Pivot: 2,821.56
1st Support: 2,627.96
1st Resistance: 2,896.66
Risk Warning:
Trading Forex and CFDs carries a high level of risk to your capital and you should only trade with money you can afford to lose. Trading Forex and CFDs may not be suitable for all investors, so please ensure that you fully understand the risks involved and seek independent advice if necessary.
Disclaimer:
The above opinions given constitute general market commentary, and do not constitute the opinion or advice of IC Markets or any form of personal or investment advice.
Any opinions, news, research, analyses, prices, other information, or links to third-party sites contained on this website are provided on an "as-is" basis, are intended only to be informative, is not an advice nor a recommendation, nor research, or a record of our trading prices, or an offer of, or solicitation for a transaction in any financial instrument and thus should not be treated as such. The information provided does not involve any specific investment objectives, financial situation and needs of any specific person who may receive it. Please be aware, that past performance is not a reliable indicator of future performance and/or results. Past Performance or Forward-looking scenarios based upon the reasonable beliefs of the third-party provider are not a guarantee of future performance. Actual results may differ materially from those anticipated in forward-looking or past performance statements. IC Markets makes no representation or warranty and assumes no liability as to the accuracy or completeness of the information provided, nor any loss arising from any investment based on a recommendation, forecast or any information supplied by any third-party.
ETH | Bullish Pattern - Cup and Handle +15%A Bullish pattern is appearing on the Ethereum chart.
From a Cup and Handle pattern, we can easily expect atleast a 15% increase. This is true for the near term. A +15% would put us here:
Just under $3K we may see heavy resistance. This is also the neckline resistance, as it was the previous support for the breakout that ultimately led to a new ETH ATH.
_______________________________
BYBIT:ETHUSDT

Ethereum Faces the 'Symplegades'– Will Pectra Propel It Through?Ethereum Faces the 'Symplegades' – Will Pectra Propel It Through?
⚔️🪨 Ethereum Faces the 'Symplegades' – Will Pectra Propel It Through? 🪨⚔️
In ancient Greek myth, the Symplegades — Clashing Rocks — tested Jason and the Argonauts with a narrow, deadly passage. Today, Ethereum faces its own mythic trial as price action presses into a critical zone.
📍 The $2,805–$2,848 resistance zone is acting like the Clashing Rocks — volatile, dangerous, and decisive. Beneath it, support rests near $2,616 and $2,565 . A breakout from this trap can open the way to $3,200+ , but rejection may mean another violent plunge. ⚠️
🔧 Enter: PECTRA – Ethereum’s Game-Changing Upgrade
Ethereum’s most ambitious upgrade since The Merge is nearly here. PECTRA isn’t just a backend update — it redefines how the network feels and functions:
🧠 Smarter Wallets
– Batch transactions
– Skip approval popups
– Pay gas in any token
⚡ Frictionless UX
– Fewer clicks
– No more endless “approve + confirm” loops
📉 Cheaper Transactions
– More blobs = better L2 scaling
– Lower fees, even during congestion
🌱 Staking Overhaul
– Validator cap raised to 2048 ETH
– Smart contract withdrawals
– Faster deposit recognition
🔓 Unlocking $490B in trapped value
– Assets become more accessible and usable
“The Merge changed how Ethereum works.
Pectra changes how it feels. ” – @ethereum
⛵ Will ETH Break Through the Clashing Rocks?
This is not just another consolidation box.
It’s a moment of mythic symmetry — where price action, fundamentals, and network transformation converge.
Sail through the Symplegades... or get crushed between them?
Stay sharp. Watch the breakout. The next move will be defining.
One Love,
The FXPROFESSOR 💙

CYBER is ready to move higherAfter big dump, bottoming pattern formed succesfully and CYBER can go easily to the upside.
Expecting targets 40-110% in the mid term.
THIS IS NOT A FINANCIAL ADVICE
MANAGE YOUR RISK AND SET STOPLOSS ALWAYS

ETHBTC Opportunity Buy: Major 2025 AltcoinSeason & Bull MarketThis is the big one and the good one. ETHBTC was bearish since December 2021 but this cycle finally came to an end in April this year. After the initial bullish breakout and higher low we can clearly see some bullish action developing; three consecutive weeks green. The bullish bias is now confirmed. It is still early.
We are looking at 200% potential. The "back to baseline" target. This is a price range where ETHBTC traded sideways as part of a distribution phase for more than two years. This is a must-to-be-tested resistance zone and thus opens up a sure 200% profits potential for this newly developing bullish wave.
Ethereum's ETFs are coming, Bitcoin already has its ETFs. This can mean Ethereum outperforming Bitcoin, and many altcoins, in so many ways. This also opens up the potential for a new all-time high on this pair.
The same sequence of 'low-higher low' happened in the last bull market. ETHBTC hit bottom in September 2019 then produced a higher low and this signaled the start of a major, long-term 447% rise. The conditions are similar now but the rise will be faster.
We have two main targets for the all-time high in late 2025 or early 2026.
1) 0.13207. With 442% profits potential from current price.
2) 0.20278. With 733% profits potential.
The entire bullish cycle for this pair can unravel within 4-6 months. If it becomes extended, it can last one year or longer. Both scenarios are possible.
It is 100% certain that ETHBTC will go on a major bullish cycle together with the rest of the altcoins market. Bitcoin will also grow.
Thanks a lot for your continued support.
If you are bullish on Crypto, comment below.
Namaste.

Bullish momentum to extend?Ethereum (ETH/USD) is reacting off the pivot which is a pullback support and could rise to the 78.6% Fibonacci resistance.
Pivot: 2,595.10
1st Support: 2,525.42
1st Resistance: 2,735.62
Risk Warning:
Trading Forex and CFDs carries a high level of risk to your capital and you should only trade with money you can afford to lose. Trading Forex and CFDs may not be suitable for all investors, so please ensure that you fully understand the risks involved and seek independent advice if necessary.
Disclaimer:
The above opinions given constitute general market commentary, and do not constitute the opinion or advice of IC Markets or any form of personal or investment advice.
Any opinions, news, research, analyses, prices, other information, or links to third-party sites contained on this website are provided on an "as-is" basis, are intended only to be informative, is not an advice nor a recommendation, nor research, or a record of our trading prices, or an offer of, or solicitation for a transaction in any financial instrument and thus should not be treated as such. The information provided does not involve any specific investment objectives, financial situation and needs of any specific person who may receive it. Please be aware, that past performance is not a reliable indicator of future performance and/or results. Past Performance or Forward-looking scenarios based upon the reasonable beliefs of the third-party provider are not a guarantee of future performance. Actual results may differ materially from those anticipated in forward-looking or past performance statements. IC Markets makes no representation or warranty and assumes no liability as to the accuracy or completeness of the information provided, nor any loss arising from any investment based on a recommendation, forecast or any information supplied by any third-party.

ETHEREUM ROADMAPI tried to predict based on previous time periods and elliot waves.
Please note that my analysis is not short-term. Of course, there may be short-term correction waves in Ethereum.
* The purpose of my graphic drawings is purely educational.
* What i write here is not an investment advice. Please do your own research before investing in any asset.
* Never take my personal opinions as investment advice, you may lose your money.

ETH/USDT 1W Chart📊 Trend structure (Price Action)
Downtrend (historical):
A series of Lower Highs (LH) and Lower Lows (LL) — a classic downtrend.
Confirmed by the orange downtrend line.
A change in structure — a possible beginning of an uptrend:
A Higher Low (HL) has recently been formed after a Lower Low (LL).
Suggests a possible end to the downtrend and an attempt to break out upwards.
Currently:
The price is testing the upper downtrend line.
A breakout above the orange line may confirm a trend change.
🟢 Key Resistance Levels (Green Lines):
Level Meaning
3.058 USDT Potential target after a breakout from consolidation
2.767 USDT Nearest strong resistance - currently being tested
3.427 USDT Deep resistance level from the previous high (HH)
🔴 Key Support Levels (Red Lines):
Level Meaning
2.234 USDT Nearest support - previous breakout
1.883 USDT Early 2023 support
1.507 USDT Local bottom
1.204 USDT Historical support - LL extreme
📉 Stochastic RSI (Momentum Indicator):
Currently in the overbought zone.
This may suggest a short-term correction before an actual breakout.
However, in a strong uptrend, the indicator may "hang out" in the overbought zone for a long time.
📈 Potential scenario:
If the breakout above 2.767 and the orange trendline holds:
A possible move to 3.058 USDT as the first target.
Extended target: 3.427 USDT (HH).
If the breakout fails:
Correction to 2.234 USDT or lower.
There is a risk of returning to a downtrend.
✅ Bullish signals:
Higher Low (HL) formation after Lower Low (LL).
Testing the upper downtrend line with an attempt to breakout.
Volume is increasing (based on candles).
⚠️ Bearish threats:
Stochastic RSI in the overbought zone.
Breakout not confirmed by 100% (needs a weekly closing candle above 2.767).
Resistance at 3,058 could halt the move.
📌 Conclusion:
Ethereum (ETH) could be on the cusp of a new uptrend, but a breakout above 2,767 USDT is needed for confirmation. If it does, a move to 3,058 and then 3,427 is possible. However, the current overbought level on the Stochastic RSI could signal a short-term correction before the trend gains strength.

ETH | Price PredictionI believe that COINBASE:ETHUSD is the most important ecosystem for crypto and am bullish on it. The price of many great assets is absolutely dependent on ETH, because those assets have ETH as the key liquidity. I love assets from the ecosystem: OKX:MORPHOUSDT , BINANCE:WLDUSDT , BINANCE:OPUSDT , BINANCE:ARBUSDT , BINANCE:LDOUSDT , $BINANCE:STRKUSDT.
Those levels are from my platform. I believe that up to "Bullish" is really easy to hit this "cycle".

ETH Long Swing Setup – Sideways Hold with Dip-Buy OpportunityETH continues to hold above the key $2,300 support, showing resilience and consolidating within range. We’re watching for one more dip into the $2,300–$2,375 zone to trigger a long entry, with momentum building for a potential breakout.
📌 Trade Setup:
• Entry Zone: $2,300 – $2,375
• Take Profit Targets:
o 🥇 $2,900 – $3,000
o 🥈 $3,300 – $3,400
o 🥉 $4,000 – $4,200
• Stop Loss: Daily close below $2,000

ETH to 3KETH is looking set to challenge the 3k level.
You can see by the small breakout and old resistance acting as new support levels at fig 1 that ETH is building towards a leg up.
Look for ETH to move higher with a small breakout (fig 2), retest (fig 3) before moving higher towards the 3K range.

Ethereum Faces Key Resistance: Potential Pullback AheadHello Guys!
What I see:
Head and Shoulders Pattern:
Left Shoulder: Formed
Head: Peak, followed by a drop.
Right Shoulder: Formed.
The neckline break around $2,450 initiated a downside move, confirming the bearish setup.
Current Price Action:
ETH is currently trading near $2,519, attempting to reclaim the broken neckline zone, which now acts as resistance.
The price action is showing lower highs, hinting at weakening bullish momentum.
Bearish Retest in Progress:
The chart shows an anticipated bearish retest of the support-resistance flip zone ($2,530–$2,550), with a probable rejection leading ETH back down toward the $2,440–$2,450 support zone.
Demand Zone:
A strong demand area is visible between $2,420–$2,450. Price may revisit this zone before making the next major move.
Trend Channel:
ETH is moving within an ascending channel, and the lower bound coincides with the highlighted demand zone.
________________________
Let's check this deja vu:
You can see that previously the price formed an H&S and after that did a hunting of the head! And after that price experienced a drop there! Same scenario here!

Ethereum setup with a 14 R:R.Let’s see if this time marks the beginning of bullish momentum.
This setup offers a 14:1 risk-to-reward ratio
Entry at 2560
Stop loss 2457
Target at 4000.

BRIEFING Week #27-28 : Distancing from US MarketsHere's your weekly update ! Brought to you each weekend with years of track-record history..
Don't forget to hit the like/follow button if you feel like this post deserves it ;)
That's the best way to support me and help pushing this content to other users.
Kindly,
Phil

$ETH Breakout this week?CRYPTOCAP:ETH local chart looks ready
I think were looking at a decent ETH breakout this week to the next resistance High Volume Node at $3600 minimum target.
👉 BTC is consolidating under all time high resistance after multiple tests which is usual a sign of bullish continuation. Usualy giving alts room to room.
👉 Ethereum is above the daily 200EMA, daily pivot and also consolidating under resistance once more after testing the 0.382 Fibonacci retracement and S1 daily pivot adding confluence to that being the local bottom. This appears to be Elliot wave 2, a shallow wave 2 retracement (less than 0.5) is a show of strength and investor impatience.
Analysis invalidated below the daily pivot and daily 200EMA as this will lock in 3 waves up and look corrective.
Safe trading

#ETH Update #1 – July 7, 2025🟢 #ETH Update #1 – July 7, 2025
Ethereum is currently testing a resistance level that dates back about 30 days . I’m seeing long upper wicks forming here, suggesting a potential rejection from this zone. Price still hasn’t cleared its previous impulsive high, and this resistance could push ETH back toward the $2,480 level.
As long as ETH holds above $2,480, I don’t see any major concern. But if it loses that support, I’ll be watching the $2,375 level next. Below that, there's a visible imbalance around $2,320, which could act as a magnet for price.
For me, a long position becomes valid above $2,635 with momentum and confirmation. On the flip side, if ETH breaks $2,480 to the downside with strength, I may consider a short setup toward $2,327 .
But for now, I’m staying out. No position until the chart speaks more clearly.

ETH – Next Stop 3D 200MA?ETH on the 4H closed the week strong after holding support at the 0.5 Fib and 200-day MA.
If price holds here, it could attempt another push toward the 3D 200MA.
Let’s see how the week unfolds on the macro and political fronts.
Always take profits and manage risk.
Interaction is welcome.

Ethereum | ETH | Long at $2,598.77Currently within my historical simple moving average area and consolidating. I suspect a move up is imminent, but 100% speculation. Crypto "bros" know more than I do.
Targets into 2028:
$4,000 (+53.9%)
$5,500 (+111.6%)

Banana zone starts when PMI is above 53.Check your charts to verify this fact.
Total 2 with the US Purchasing Managers Index overlain.
The PMI is one of the most reliable leading indicators for assessing the state of the U.S. economy.
Previous Banana zones have coincided with the PMI above 53.
so not just when the economy is growing, but when the economy has entered humming along approaching full acceleration.
This is when most people will feel confidence and WANT to take on more risk as they are most optimistic about the future when the economy is in this state of being.
