Ethereum $5,791 followed by $8,500 Late 2025Ethereum is due a major, major bullish wave. No new highs since March 2024. Double-top December 2024.
The bear market ended June 2022. April 2025 marks a long-term higher low.
So the peak remains flat, March 2024 vs December 2024. While the bottom is rising, June 2022 vs April 2025.
You could say the top is a lower high of course, November 2021 vs 2024. This is also valid. Even with a lower high top a bullish wave is due leading to a minimum of around $3,800 or $4,000; back to baseline.
Now, if we really want to talk about minimum because we really don't care about worst case scenario, the fundamentals are improving and everything is getting better, consider $5,791. This would be the minimum. With the Ethereum ETFs and the 2025 bull market, we then open up $8,500 and so on. Growth potential is unlimited and we will have to use our imagination. These numbers are good though and definitely a strong level where action will happen. You will see some resistance, some something going on when Ethereum reaches these numbers.
Ethereum is due a major, major bullish wave. It is not a question of "if," it is a question of "when." When will it happen? "If it happens?" No! When, will it happen?
It will happen in 2025. You can be certain about it... Just watch!
....
Ethereum (ETHUSDT) has been consolidating two months above support. Support being $2,425. One week it broke below this level just to recover the next week. More than 8 weeks sideways wicking lower and higher.
The 7-April low, candle and rounded bottom, as well as long-term higher low makes this date a clear bottom. From the bottom we grow. Once the bottom is hit, the trend changes. The trend has been bearish since March 2024. A long time in Crypto term. We are in the bull market year, 2025. What is not happening now, is what will happen next.
The market was bearish for a long time and that's ok. The good news are the waves within cycles... We just came out of a strong correction; we have a small recovery and consolidation. The initial breakout is being consolidated before additional growth.
Lots of thinking, lots of reasoning, lots of studying... Everything you need to know is already present on the chart. Ethereum will grow. Mark by words. It is already happening.
Thank you for reading.
Namaste.
ETH-D

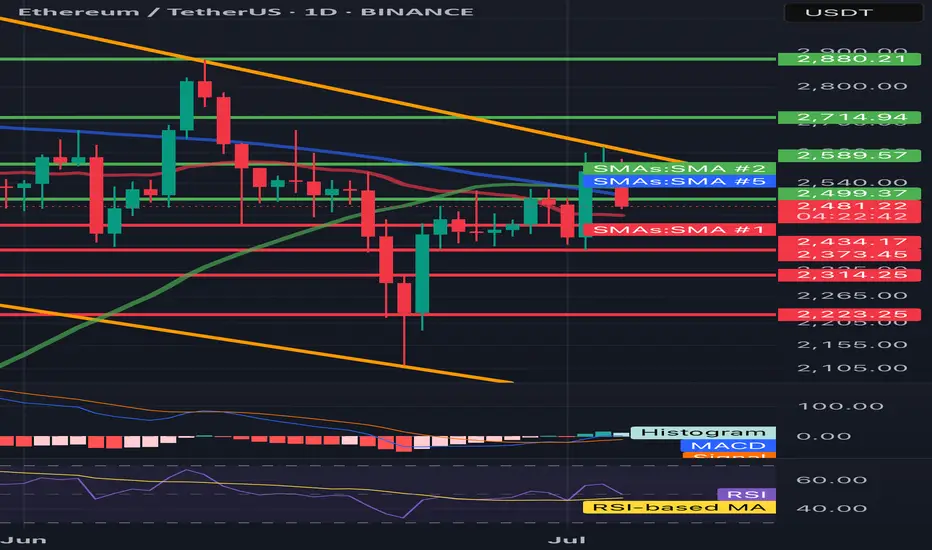
ETH/USDT 1D🔍 ETH/USDT - technical analysis (1D interval):
📉 Price: 2478 USDT (-4.36%)
🔧 Resistance:
• SMA 200 (green): ~ 2589
• Resistance zone: ~ 2715 → 2880 USDT
• SMA 100 (blue): ~ 2500 (just rejected)
🔧 Support:
• SMA 50 (red): ~ 2434 - currently tested
• Strong support: 2373, 2314, 2223 USDT
📊 indicators:
• MacD: freshly intersected, but the momentum is weakening
• RSI: ~ 45 - neutral/weak, under 50 (no bull strength)
• Trend: Still in the downward channel (yellow trend lines)
⸻
⚠️ Conclusions:
• Price rejected from 2500 (SMA 100) and flies down.
• If 2434 falls, a further discount is possible to 2373–2314.
• Lack of bulls with key resistance - the inheritance scenario dominates.
• Watch behavior at 2434 - this is now a key level.

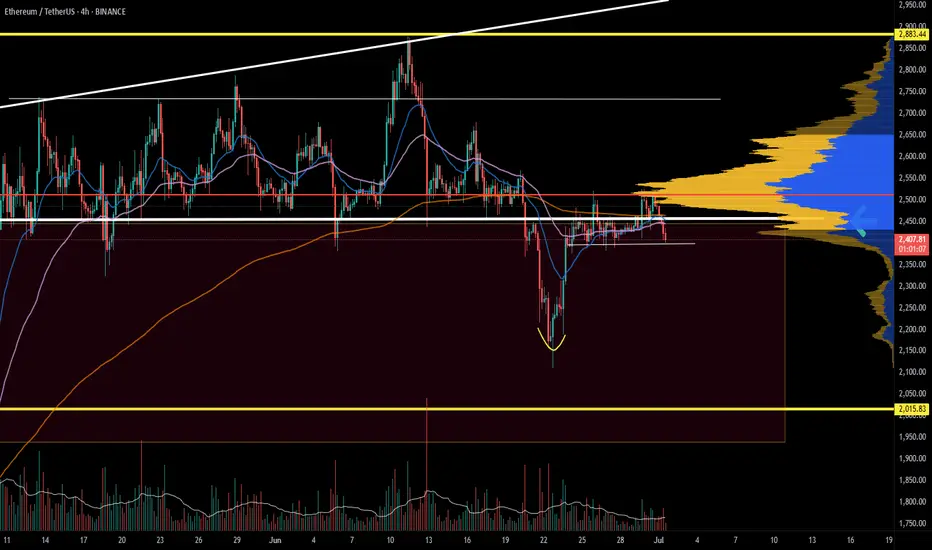
ETH could be about to rip into a short-term rallyWhile the stock market has seen surprising upside in the past weeks (presumably due to pricing in rate cuts / a more positive liquidity picture / high expectations for Q2), crypto has lagged behind. I don't believe anything significantly above current prices - no matter in which market - is sustainable for now, but we can certainly milk it for whatever it's worth.
Notably, BTC has shown way more resilience and dominance in the current cycle so far. This makes sense in a high interest environment. However, within the bias of the markets pricing in expectations for rate cuts and as such more liquidity, we could also assume that demand for assets other than "safe havens" would now increase as well, leading us to the biased conclusion that we could see altcoins wildly outperforming BTC over the next weeks.
Indeed, if we look at the BTC chart, technicals such as VWAP stddevs show significantly less potential for upside if compared to ETH in the current moment in time. We therefore would focus on ETH at this point (as money flow seems to cycle BTC->ETH->Others).
PLEASE NOTE: SL and TP are not accurate. This is not a precise trading idea. Please use your own judgement in accordance with your trading style.

Bearish reversal off major resistance?The Ethereum (ETH/USD) is rising towards the pivot which acts as a pullback resistance and could reverse to the 1st support which is a pullback support.
Pivot: 2,655.32
1st Support: 2,506.53
1st Resistance: 2,820.60
Risk Warning:
Trading Forex and CFDs carries a high level of risk to your capital and you should only trade with money you can afford to lose. Trading Forex and CFDs may not be suitable for all investors, so please ensure that you fully understand the risks involved and seek independent advice if necessary.
Disclaimer:
The above opinions given constitute general market commentary, and do not constitute the opinion or advice of IC Markets or any form of personal or investment advice.
Any opinions, news, research, analyses, prices, other information, or links to third-party sites contained on this website are provided on an "as-is" basis, are intended only to be informative, is not an advice nor a recommendation, nor research, or a record of our trading prices, or an offer of, or solicitation for a transaction in any financial instrument and thus should not be treated as such. The information provided does not involve any specific investment objectives, financial situation and needs of any specific person who may receive it. Please be aware, that past performance is not a reliable indicator of future performance and/or results. Past Performance or Forward-looking scenarios based upon the reasonable beliefs of the third-party provider are not a guarantee of future performance. Actual results may differ materially from those anticipated in forward-looking or past performance statements. IC Markets makes no representation or warranty and assumes no liability as to the accuracy or completeness of the information provided, nor any loss arising from any investment based on a recommendation, forecast or any information supplied by any third-party.

HolderStat┆ETHUSD seeks to the $2750 levelBINANCE:ETHUSDT is holding above 2,350 and breaking out of consolidation within an expanding wedge. With structure pointing to bullish continuation, a move toward 2,800 is likely if this support level continues to hold.

$ETH Wave 3 of 3 Underway?CRYPTOCAP:ETH is back into the range EQ as alt coins pump on the back of CRYPTOCAP:BTC breakout
Price caught a strong bid after testing quadruple support: the major High Volume Node (HVN), daily 200EMA, 0.5 Fibonacci Retracement and daily S1 Pivot. Last week I posted about this area holding to kick off wave 3.
There is still work to do to overcome the recent swing high at HVN major resistance but things are certainly looking bullish. The daily pivot point sits at $3150 as the next target.
Long term terminal target for wave 3 is still the R4 daily pivot at $7340, I don't expect the terminal wave 5 to extend much beyond this, perhaps a wick above to trap retail at the top with a lot of media hype attached.
Analysis is invalidated if we fall below wave (2) swing low $2050.
Safe trading

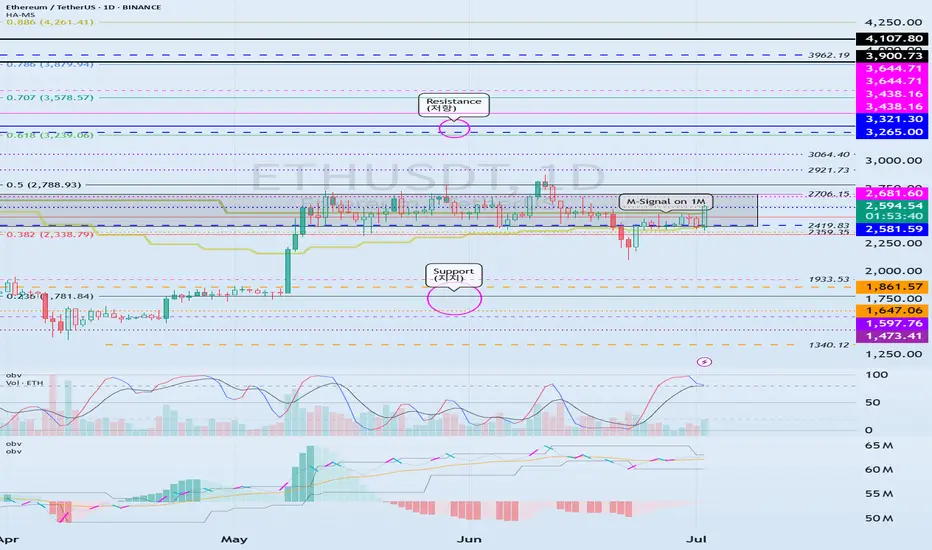
Important Support and Resistance Areas: 2419.83-2706.15
Hello, traders.
Please "Follow" to get the latest information quickly.
Have a nice day today.
-------------------------------------
(ETHUSDT 1D chart)
The key is whether ETH can find support in the 2419.83-2706.15 area and rise.
This is because this section is the section that needs to be supported in order for a full-fledged uptrend to begin.
Therefore, if you are trading ETH, you can proceed with a purchase when support is confirmed in the 2419.83-2706.15 section.
-
Thank you for reading to the end.
I hope you have a successful transaction.
--------------------------------------------------
- Here is an explanation of the big picture.
(3-year bull market, 1-year bear market pattern)
I will explain the details again when the bear market starts.
------------------------------------------------------
ETH 50MA Reclaims 0.5 FibInteresting take on ETH daily using just the 50MA and Fib levels.
Notice how the 50MA has interacted with the Fib levels since June 2021.
In May 2025, the 50MA crossed below the 0.618 Fib level, marking the bottom of the December 2024 drop.
The 0.5 Fib acted as support in October 2024 during the double top formation at the 0.236 Fib.
Now, the 50MA has crossed back above the 0.5 Fib.
As long as price holds above this 0.5 Fib level, the odds of further upside remain stronger.
Always take profits and manage risk.
Interaction is welcome.

Ethereum - ETH - Heading towards the CME Gap - 3200 Target+ After a significant crash, Ethereum has shown a strong recovery.
+ A large CME gap exists between $2,880 and $3,270.
+ Historically, 90% of CME gaps tend to get filled sooner or later.
+ Current price action suggests Ethereum is heading directly toward this gap.
+ High probability that the CME gap will be filled during this move.
+ Next target for ETH: $3,200.
Stay tuned for more updates.
Cheers,
GreenCrypto

ETH 30min: Bearish Triangle Forming After RSI Divergencehelo guys
Ethereum is currently trading within a clear range, and recently formed a bearish triangle pattern near the top of the consolidation. A visible RSI divergence confirmed the loss of bullish momentum as price made a higher high, but RSI printed a lower high — a common sign of exhaustion.
Now, ETH is moving downward within the triangle, and pressure is building near the lower edge of the range. If the pattern breaks down as expected, the next likely move is a drop toward the support zone around $2,370–2,380, which marks the bottom of the range.
This setup shows a typical structure:
Divergence → Triangle → Breakdown toward range low
Unless price reclaims the triangle top quickly, bears have the upper hand in the short term.

SharpLink Gaming Inc (SBET) - Falling Wedge & Inverse H&S🚀 SharpLink Gaming ( NASDAQ:SBET ) – Ethereum, Joe Lubin & a Bullish Setup
SharpLink Gaming has undergone a bold transformation: the company is now the largest public holder of Ethereum (ETH), with ~198,000 ETH acquired since June 2025. Over 95% of it is staked, already earning 200+ ETH in rewards – turning ETH into a yield-bearing treasury asset.
Driving this shift is Joe Lubin, co-founder of Ethereum and CEO of ConsenSys, who recently became Chairman of SharpLink. Under his leadership, SBET is betting big on Ethereum as “digital capital”, aiming to merge iGaming and Web3.
📊 Technical Setup:
SBET is forming a falling wedge and an inverse head and shoulders – both classic bullish reversal patterns. After a post-announcement retracement, the chart suggests growing potential for a breakout as fundamentals strengthen.
🧠 My thesis: This is MicroStrategy playbook 2.0 – but with ETH instead of BTC. SharpLink gives equity exposure to Ethereum + staking yield + visionary leadership.
🔔 Worth watching closely.
⚠️ Always do your own investment research and make your own decisions before investing.

CULT DAO ON ITS WAY TO A BILLION DOLLAR MARKET CAPIf you want an in-depth look at everything CULT DAO, check out the TA below:
This is just a technical update.
A massive breakout occurred as expected. I’ve been highlighting the divergence forming in the MACD for months — it’s all detailed in the TA above.
Over the last 1,096 days, CULT DAO has formed a giant descending wedge — both in price structure and on the MACD. The path was clear.
Onwards and upwards.
A billion-dollar market cap is very possible by Q4 2025.
Breakthrough tech.
Mainnet launch around the corner.
Rocket ship loading.

Bitcoin summer of fun...If we are in a continuation pattern, and Bitcoin breaks the neckline soon.
We could be on the cusp of a very interesting and strong few months of price action.
Continuation upward sloping #inverseheadandshoudlers

HYPEUSDT Probably CookedToken driven by demand from trading on Hyperliquid. Crypto looks set for a few month long consolidation probably into Q4.
That loss in trading volume will reduce demand for the token and the company may be forced to sell the token to come up with large gains for its clients. Either way it's a bearish catalyst for the token which has really ran hard. Ugly head and shoulders as well as a topping pattern in an overall financial market that looks like it wants a pull back

ETH needs support now. ETH is holding up by a thread. There are signs of weakness in the market, and if the Ethereum price breaks below support, it is likely we will see follow-through.
Full TA: Link in the BIO
ETHEREUM Perhaps the easiest long out there.Ethereum (ETHUSD) is consolidating just above the Buy Zone of the Mayer Multiple Bands (MMBs) where it rebounded on its April bottom.
Throughout its historic price action, every time it hit this Zone and rebounded, it reached at least the bottom of its Mean MM zone (red Zone).
As a result, $4000 towards the end of the year may be the easiest Target in the market right now.
-------------------------------------------------------------------------------
** Please LIKE 👍, FOLLOW ✅, SHARE 🙌 and COMMENT ✍ if you enjoy this idea! Also share your ideas and charts in the comments section below! This is best way to keep it relevant, support us, keep the content here free and allow the idea to reach as many people as possible. **
-------------------------------------------------------------------------------
💸💸💸💸💸💸
👇 👇 👇 👇 👇 👇

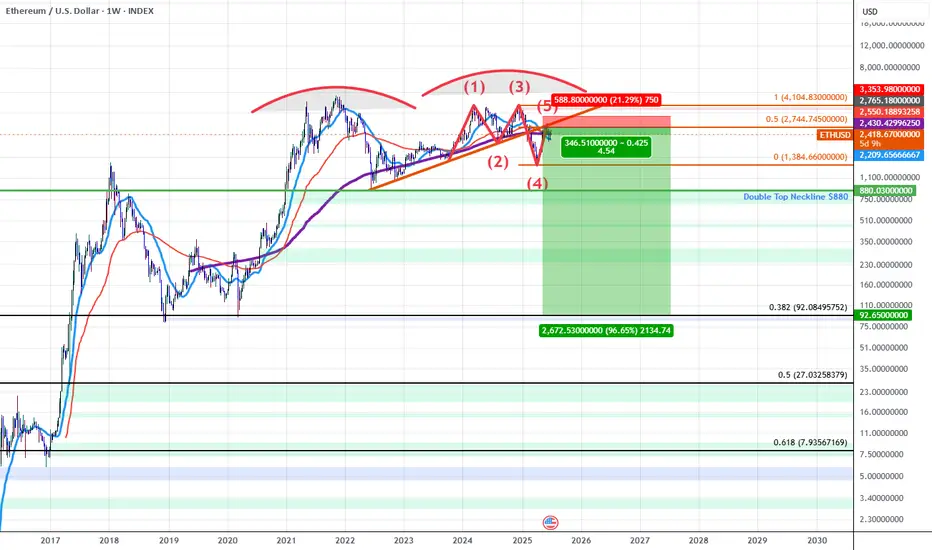
ETHUSD: Double Top into A Bearish 5-0 BreakdownETH for the last 5 years has been developing a Double Topping pattern which has put in a series of lower highs during the most recent 2nd run up. As we've confirmed these lower highs we've broken down below trendline and found resistance at the trendline which happens to have confluence with the PCZ of a Bearish 5-0 wave formation.
As we begin to find weakness and Bearish price action begins I suspect price will make it's way towards the neckline of the double top aligning with the $880 price level if ETH breaks below that level there will be no significant support until it reaches the all-time 0.382 retrace down at around $92.10.
In short it seems ETH is in the early stages of a macro breakdown which could result in value declines greater than 80%.
HolderStat┆ETHUSD fixed above the supportBINANCE:ETHUSDT broke out from a triangle and is holding above the 2,447 zone. The current ascending structure targets 2,700 in the near term. Reclaiming short-term resistances confirms a bullish reversal from recent lows, similar to past triangle breakouts.

ETH Pushed Back, Support in Sight
ETH on the 4H just closed below the last daily close and the 0.5 Fib again, after getting pushed back from the 4H 200MA and daily 200MA resistance zone.
The next key supports are the weekly 200MA and the local support zone.
Also worth noting: Trump and Musk are stirring things up again. The last time this dynamic appeared, it triggered a selloff a few weeks ago, even before the conflict began.
Always take profits and manage risk.
Interaction is welcome.

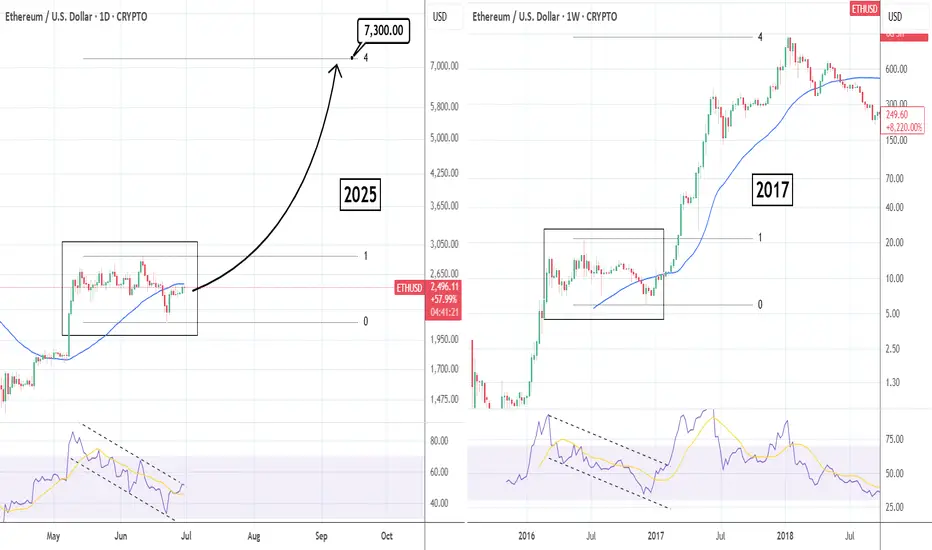
ETHUSD: Parabolic rally similar to 2017 targets $7,300Ethereum is neutral on its 1D technical outlook (RSI = 50.960, MACD = -24.810, ADX = 18.527), attempting to break over the 1D MA50, while still being inside a 6 week consolidation. This is no different than the 2016 consolidation on the 1W chart, that turned out to be just an accumulation pattern before a massive 2017 bullish breakout to the 4.0 Fibonacci extension. Time to go heavily long on ETH with TP = 7,300.
## If you like our free content follow our profile to get more daily ideas. ##
## Comments and likes are greatly appreciated. ##
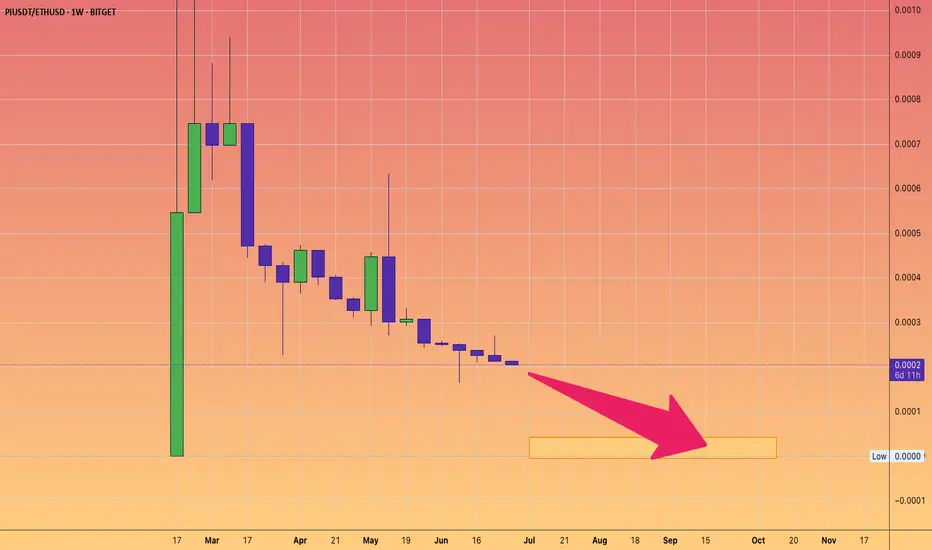
DON'T BUY Pi Network. It's a PUMP and DUMP.But feel free to short it if you desire.
This is Pi v ETH chart
It will continue it's trend to near ZERO.
Market makers will keep dumping into oblivion.
Ethereum Leveling Map — ETH/USDT 1DNo directional bias for Ethereum, but will use levels to spot entries for intraday.
Right now located at POC and seems balanced for both sides.
Potential Adam&Eve setup in development.
Quality levels for support $2150, 2000, 1800, 1500.
Resistances $2700, 3000, 3500, 4000
Keep in mind it will follow BTC price action by most of time.
Happy trading
