BTCETH parabolic run pointing towards 100:1Historically, during bull markets, Ethereum frequently surpassed Bitcoin at various moments.
However, this time around, that trend has not materialised, leading to a decline in investor confidence.
With capital exiting the ETH market, sentiment has soured, and critical indicators are revealing significant losses.
Unless a robust bullish turnaround occurs, Ethereum's struggle may persist, as the market currently favors Bitcoin as the more secure option.
However once this parabola breaks, we could see a strong snap back reaction in favour of the more riskier #ALTS, #DEFI and #MEMES as #ETH is still the home for stablecoin issuance and still the most trusted secure smart contract blockchain available.
ETH-D

Where is Ethereum's target? (1D)This analysis is an update of the analysis you see in the "Related publications" section
The previous analysis has expired, and the price moved up without any correction. This type of movement is usually intended to attract liquidity, and once liquidity is absorbed, the price often goes through a correction.
From the point where we placed the green arrow, Ethereum has entered a bullish phase.
It now appears that we are in wave B of this bullish phase. The price may get rejected from the red zone.
Price can be rejected from the red box.
Do not enter any positions without confirmation, as the price may even continue moving up to the top of the red box.
For risk management, please don't forget stop loss and capital management
When we reach the first target, save some profit and then change the stop to entry
Comment if you have any questions
Thank You

The Charts Never Lie [Well, almost never]So many reasons to be Bullish on Alts right now.
Historically, BTC will peak first, and then ALTS will have their turn. It looks like they are prime for a run at least to the middle of the range, although why stop there?

Ethereum Looks Identical to Early-Day AmazonToday I look at Ethereum versus early-day Amazon and the similarities between the internet bubble and the 2021 crypto bubble. Everyone talks about how the internet bubble popped, but few people talk about what came afterward. There was a strong recovery in the markets, and the internet was mass adopted by the public—along with the technology of home computers.
I believe we are heading into a mass adoption phase for crypto. We've had a bubble-and-pop scenario, and now that major institutions are investing in crypto, we are set up for mass adoption—very similar to what happened with home computing and the internet as a technology. I see Ethereum as being the "Amazon" of this new wave, and Bitcoin as being the "Apple." Big things are coming in these markets.
As always, stay profitable.
– Dalin Anderson

ETH Bullish Setup: Pullback to 200_SMA(D) May Launch Next Rally Ethereum ( BINANCE:ETHUSDT ) seems to have finally managed to break the Resistance lines and the 200_SMA(Daily) in the fifth attack . However, the number of Resistance lines inside the Heavy Resistance zone($2,929_$2,652) is high, and Ethereum will find it difficult to break through them.
In terms of Elliott Wave theory , it seems that Ethereum is completing microwave 4 , and we should wait for this wave to complete. Microwave 4 could act as a pullback to the resistance lines and 200_SMA(Daily) .
I expect Ethereum to start rising from the Support zone($2,745_$2,650) again and rise to at least the Potential Reversal Zone(PRZ) .
Note: If Ethereum touches $2,537 , we can expect further declines.
Please respect each other's ideas and express them politely if you agree or disagree.
Ethereum Analyze (ETHUSDT), 1-hour time frame.
Be sure to follow the updated ideas.
Do not forget to put a Stop loss for your positions (For every position you want to open).
Please follow your strategy and updates; this is just my Idea, and I will gladly see your ideas in this post.
Please do not forget the ✅' like '✅ button 🙏😊 & Share it with your friends; thanks, and Trade safe.

Bad Time Over for ETH? Second Wave Toward $4,000 Incoming!!🟢 Bad Time Over for ETH? Second Wave Toward $4,000 Incoming
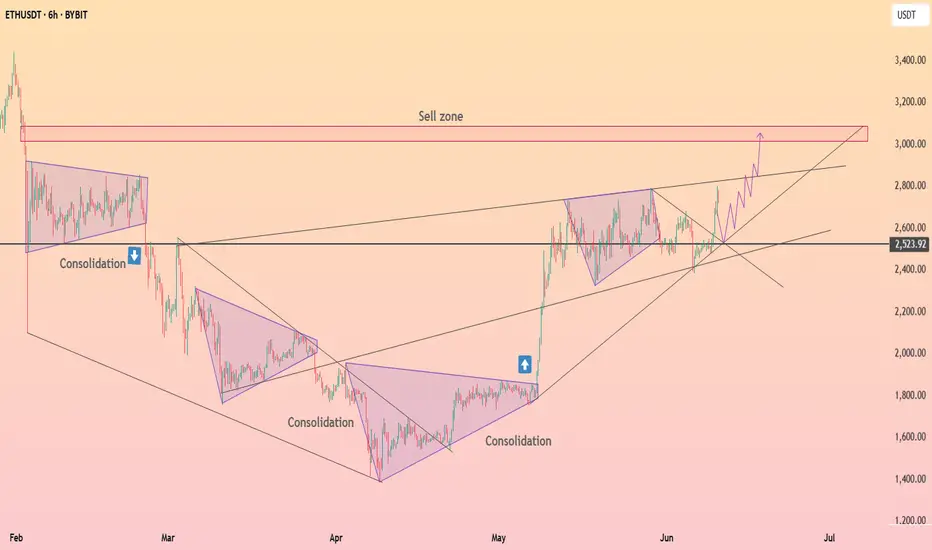
MARKETSCOM:ETHEREUM ( CRYPTOCAP:ETH ) appears to be leaving its consolidation phase behind, and all signs point to a fresh bullish wave. After outperforming Bitcoin in recent days, CRYPTOCAP:ETH has now broken out of a key structure — signaling the potential start of a major uptrend.
We’re also witnessing rising CRYPTOCAP:ETH inflows, suggesting growing investor confidence. This kind of accumulation behavior has historically led to significant rallies. Previously, ETH consolidated between $1700–$1800 before a strong move up. More recently, it ranged between $2400–$2700, and now that it’s broken out, we’re anticipating another powerful leg — possibly the second wave of this trend.
If the current momentum continues, a move toward $4000 looks likely, and with enough strength, even a new all-time high isn’t off the table.
BINANCE:ETHUSDT Currently trading at $2795
Buy level : Above $2750
Stop loss : Below $2305
Target : $4000
Max leverage 3x
Always keep stop loss
Follow Our Tradingview Account for More Technical Analysis Updates, | Like, Share and Comment Your thoughts
HolderStat┆ETHUSD move in accumulation zoneHolding CRYPTOCAP:ETH in the range of 2,520 - 2,750 formed an accumulation zone. Breakout of this range gives an opportunity for growth of 3,000+
ETHEREUM BULLFLAGA nice bullflag structure has presented itself on this daily timeframe
I think this bullflag will allow ETH to catch up to BTC in term of alts vs BTC
I expect a very strong bullish move to be coming in the next month or next month breaking out of this bullflag
Green horizontal has been seen previously as a point of support.

ETHEREUM This Megaphone emerged on all previous Cycles.Ethereum (ETHUSD) is showing incredible strength at the moment as it broke above its 1W MA50 (blue trend-line) and its goal now will be to close the week above it.
This resembles May 2020 and January 2017 when again the price was struggling to break above its 1W MA50, all within a similar Megaphone pattern, and eventually succeeding. The similarities among those 3 patterns so far are striking despite being formed on different Cycles.
As you can see, we are currently on the 0.618 Fibonacci level of the Megaphone, which is exactly where ETH was during the other 2 Cycles when it tested the 1W MA50 and broke out. Once the 1W MA50 turned into Support, the market never looked back and initiated the parabolic rallies of 2020/ 2021 and 2017.
Based on that, we expect ETH to test the 1.5 Fibonacci extension, around $7000.
-------------------------------------------------------------------------------
** Please LIKE 👍, FOLLOW ✅, SHARE 🙌 and COMMENT ✍ if you enjoy this idea! Also share your ideas and charts in the comments section below! This is best way to keep it relevant, support us, keep the content here free and allow the idea to reach as many people as possible. **
-------------------------------------------------------------------------------
💸💸💸💸💸💸
👇 👇 👇 👇 👇 👇

ETH - Finally Support!Hello TradingView Family / Fellow Traders. This is Richard, also known as theSignalyst.
📈ETH has been overall bullish trading within the flat rising channels marked in blue.
Moreover, the green zone is a strong support zone!
🏹 Thus, the highlighted blue circle is a strong area to look for buy setups as it is the intersection of support and lower blue trendlines acting as non-horizontal support.
📚 As per my trading style:
As #ETH approaches the blue circle zone, I will be looking for bullish reversal setups (like a double bottom pattern, trendline break , and so on...)
📚 Always follow your trading plan regarding entry, risk management, and trade management.
Good luck!
All Strategies Are Good; If Managed Properly!
~Rich

ETH/USDT 4HOUR CHART UPDATE !!ETH/USDT – 4H Chart Update
Ethereum is trading near an ascending channel's upper boundary, around the $2,790–$2,800 area. This level has historically acted as strong resistance, and we are seeing early signs of price hesitation.
ETH is testing the top of the channel. Rejection from this area could lead to a reversal towards the lower channel trendline near $2,450–2,500.
First Support: $2,600–2,620 (25MA and 100MA area).
Deep Support: $2,450 (Channel Bottom).
Strong Demand Area Below: $2,050–$2,150 (highlighted yellow box).
Moving Averages:
The 25MA (black) and 100MA (purple) are currently bullishly aligned.
Thanks for your support!
DYOR. NFA

You can't unsee itThere is something to be said for the simplicity.
The historical price action is clear.
The RSI trend/cycles are just as clear.
There is not much space left for compression.
A BIG MOVE IS COMING.
The only question is, are you ready?

Is Bitcoin Ready to Launch? In-Depth Analysis of BTC, ETH, XRP, Hello everyone, I hope you're doing well.
Due to time constraints, I won't be analyzing each asset individually. Instead, I’ll provide a collective technical overview in this post.
This analysis includes the following cryptocurrencies: **Bitcoin, Ethereum, Ripple, Solana, Sui, and Chainlink**.
⚠️ **Please note:** On the **daily timeframe**, most of these assets are forming different patterns. However, the **weekly timeframe** provides a clearer and more reliable outlook.
---
### 🔍 **Technical Overview:**
📌 **Bitcoin (BTC)**
Currently forming a **"V" pattern**.
If BTC closes **above \$110,500 on the weekly timeframe**, the first target is **\$131,500**, and the second target is **\$165,000**.
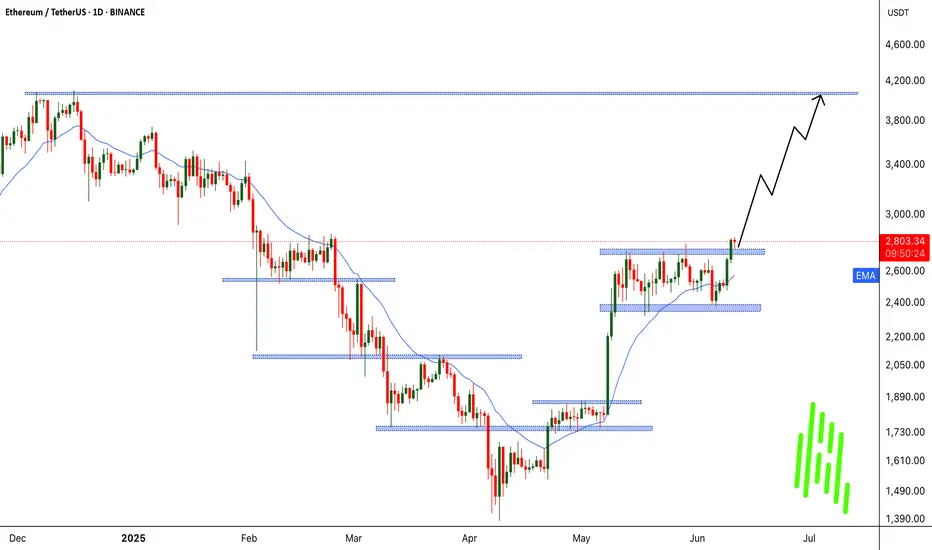
📌 **Ethereum (ETH)**
Also in a **"V" pattern**.
If ETH closes **above \$2,833 on the weekly timeframe**, the first target is **\$4,200**.
📌 **Ripple (XRP)**
Forming a **bullish flag** pattern.
If XRP closes **above \$2.65 on the weekly timeframe**, the first target is **\$4.22**.
📌 **Solana (SOL)**
Forming a **"V" pattern**.
If SOL closes **above \$190 weekly**, the first target is **\$282**.
📌 **Sui (SUI)**
Also forming a **"V" pattern**.
If SUI closes **above \$4.26 weekly**, the first target is **\$6.97**.
📌 **Chainlink (LINK)**
Needs a **weekly close above \$18** to confirm breakout.
First target: **\$25**.
---
### 🧠 **Brief Fundamental Insights:**
* **Bitcoin** is being heavily accumulated by institutional investors and whales. On-chain metrics suggest we are **not at a cycle top**, and the ongoing **supply shock** and **massive exchange outflows** are strong bullish signs.
* **Ethereum** is under **strong accumulation** from both retail and institutional investors, as confirmed by recent **CoinShares reports**.
* **Ripple** is awaiting resolution of its ongoing lawsuit with the **SEC**.
* **Sui** is consistently rolling out updates and shows **unstoppable DeFi ecosystem growth**, giving it strong fundamental support.
* **Solana** is being accumulated by institutional players, including **SOL-specific strategies** and funds.
* **Chainlink** is seeing buying pressure supported by **positive news and strategic partnerships**, some of which are from **anonymous large players**.
---
🧠 Updated Fundamental Analysis (June 2025)
Bitcoin (BTC)
New Investment Record: In May, total investments in crypto funds reached $167 billion, with Bitcoin accounting for $5.5 billion, signaling strong institutional demand.
Institutional Buying Surge: ETF purchases, entries by institutions like Paris Saint Germain, and even countries like Pakistan have contributed to declining exchange reserves of Bitcoin.
Favorable Macro Conditions: Rising bond yields, stock market volatility, and a weakening U.S. dollar have made Bitcoin more attractive as a hedge asset.
Ethereum (ETH)
Consistent Inflows: Ethereum funds have seen seven consecutive weeks of capital inflows, with nearly $296 million added in the past week alone.
Institutional Confidence: Assets under management (AUM) in ETH funds have reached approximately $14 billion, indicating strong long-term faith by institutions.
Solana (SOL)
Strong Institutional Demand: Firms like Société Générale and Siebert Financial have recently invested in Solana.
On the Verge of ETF Approval: Franklin Templeton filed for a spot Solana ETF back in February, potentially boosting demand.
Whale & DeFi Growth: Increased whale activity, growing DeFi ecosystem, and rising developer engagement hint at a potential price rally to $200 and beyond.
Ripple (XRP)
While there is no major new fundamental data recently, the listing of XRP futures on CME and broader access for institutional investors may have a positive impact.
The ongoing legal case with the SEC remains a crucial factor in XRP’s future outlook.
Sui (SUI)
DeFi Expansion: Active daily users have grown by over 14%, and decentralized exchange volume has reached around $34 million per day.
TVL Growth: Suilend’s Total Value Locked (TVL) has hit $700 million, ranking 8th among all blockchains.
Institutional Attention: There are reports suggesting that an ETF for SUI may be under consideration, with on-chain utility continuing to expand.
Chainlink (LINK)
Collaboration with Major Financial Institutions: Chainlink is participating in CBDC pilots between Hong Kong and Australia, working with Visa, ANZ, and the Hong Kong Monetary Authority.
Ecosystem Growth: Development is supported via grants, like the $150K funding provided to Lightchain AI, strengthening Chainlink’s infrastructure.
Strategic Partnerships: Collaborations with JPMorgan, Ondo Finance, and Swift highlight Chainlink’s growing influence in connecting real-world data to blockchains.

ETH Daily Close Signals Entry
On the daily, ETH is closing above both the 200MA and the previous tops. PSAR on the original system has flipped, though the free-to-use version hasn’t yet.
This is a trading idea. If you choose to allocate real capital, be prepared for the possibility of loss. But if you trust the system enough to allocate capital, trust that the PSAR has flipped and today’s close marks the entry.
It’s exactly how the system defines a valid setup:
Daily close above the 200MA, with MLR > SMA > BB center.
The 12H timeframe acts as confirmation from the lower TF, and the 4H is already green and ripping.
So buckle up—this could be a ride worth taking.
Always take profits and manage risk.
Interaction is welcome.

ETH – System Trigger Hit
ETH on the 12H has just reclaimed the green line: resistance from the previous tops.
This level sits roughly midway between the 0.5 and 0.382 Fib levels, with \$3000 now looking closer than \$2500.
PSAR has just flipped above the last tops, and price is now above MLR > SMA > BB center > 200MA.
All system conditions are met for a long entry on this timeframe.
This also comes as confirmation of the daily signal entry at today closing
Always take profits and manage risk.
Interaction is welcome.

Ethereum Is About to Start Making Its Move to $4100Trading Fam,
Lot's of good patterns occurring on the crypto charts recently, Ethereum is no exception. Here you can see a valid inverse head and shoulders pattern has formed. 85% of the time, these patterns play out.
If we do break that neckline to the upside, I would suggest that $4100 will come fairly quickly. We do have a few resistance areas ahead of us where I expect some pause. But this will only give the market enough time to recognize they may be missing the rocket ride and hop in.
If we don't break that neckline this week, we could pull back for another week. But I think by the end of June our neckline will break and we'll be on our way.
Best,
Stew

ETH - mega dump and mega ultra pumpI found a fractal for Bitcoin, and Ethereum is currently similar to it. If we want to see a truly strong upward movement, then there is a high probability of such a helicopter, as similar situations have already occurred before the strongest growth.

Ethereum sooner or later + $10kEthereum overdue major run will be there sooner or later and my expectation of + $10k for the local peak has not changed

ETH/BTC : Ready to Lead the Altcoin Season?Hey Traders!
If you’re finding value in this analysis, smash that 👍 and hit Follow for high-accuracy trade setups that actually deliver!
Ethereum just broke out of a multi-week symmetrical triangle against Bitcoin — a classic continuation pattern! After consolidating for over a month, this breakout could signal a major shift in market dynamics.
Pattern: Symmetrical Triangle
Measured Move Target: +38.7% from the breakout
Timeframe: 12H
Current Ratio: 0.02517 BTC
🔍 Why ETH/BTC Matters for Altcoins:
When ETH/BTC rises, it often marks the beginning of an altcoin rally. Here's why:
✅ ETH leads altcoins — It’s the largest alt by market cap, and capital often rotates from BTC → ETH → mid/small caps.
✅ Rising ETH/BTC = Bitcoin dominance weakening, giving altcoins room to breathe.
✅ Confidence returns to the broader alt market when ETH outperforms BTC.
If this breakout sustains, we may be entering a strong altcoin season. Keep an eye on ETH strength and look for high-potential setups across the altcoin board!
What are your top altcoin picks for this potential rally? Drop them below 👇

Ethereum's Price Action Reveals A Bullish Bitcoin, $8,513 Next!The strongest possible bullish signal has been confirmed. Ethereum just moved daily above MA200. This is the first time this happens coming from a low point since November 2024, this is massive.
This signal reveals two things: (1) Bitcoin is bullish and set to continue growing. You've never seen Bitcoin and Ethereum going in different directions. If Ethereum is set to continue up, Bitcoin will also do the same. The market is one. (2) Ethereum is now ready to grow for 6 months straight, minimum, and this opens the doors for $5,790 followed by $8,513 in this bullish wave. There can be more of course.
This is one of the strongest signals (MA200) but also one of the easiest to spot. It works with high accuracy, never fails. The market is bullish when the action happens above this indicator long-term.
So now you know, for sure—for certain, what will happen next. Knowing that Ethereum will be trading above $5,000 soon, how are you going to maximize profits from this knowledge? Do what it takes to increase your profits and trading success. This is the opportunity of a lifetime, it can be life changing.
Thank you for reading.
I am wishing you tons of profits, great luck and amazing success.
Namaste.

Ethereum breaking out!Two days ago, I've posted that we're most likely trading in a 2K-4K range on Ethereum. There was a slight deviation below 2K but the bulls swiftly regained control.
As for now, it's seems obvious we are heading towards, at least, 3K. I'm confident 4K is on the horizon, though I prefer to take it level by level.
ETH is breaking out off this bull flag and this chart looks more and more like one of those charts you study in textbooks.

ETH will 5X from HERE! Hit the Like to manifest this.I'm serious hit the like to turn this #HVF into a reality.
I have been monitoring this pattern build out for years now.
BUT we are on the verge on triggering this pattern any day now, and triggering a massive Altcoin run which sucks in capital from all parts of the globe.
@TheCryptoSniper

BTC Dominance looking real heavy up hereWouldn't be surprised in the least if we see a freefall on BTC Dominance over the next few months.
Of course there is no guarantee, and things may look different in a month, however as it stands, I think there is a potential ALT cycle on the cards for 2025.
RSI needs a reset, amongst other things.
