Ethereum Late 2025 Targets Simplified —$7,331 & $11,318We are getting closer and closer to the bull run phase. We are getting closer to a period where the entire Cryptocurrency market will be extremely bullish. I wanted to simplified Ethereum's targets for you.
Having a long-term perspective can make your trading, your holding, much easier.
Imagine Ethereum goes to $4,500 and starts a strong retrace. As prices move up, you wouldn't feel compelled to sell, you would just be happy looking at the numbers on the screen and waiting for more. As soon as the correction comes, doubt can start to creep in. Should I sell now? Will it continue lower? Is this the end? How far down can it go?
We can plan ahead but the market impulse, the energy, the mass, the group, the herd, the news; things can shake us out of our hands, knowing in advance how high prices can really go, can make it easier for us to hold strong.
If Ethereum trades at $5,000 and stats to retrace, and you know that a minimum target of $7,300 is expected, then you can easily hold. But without this information it would be hard to do so when prices are down 30% from the top. The worst part is that we tend not to sell at the top, ignore the top and the impulse becomes really strong to sell when prices are low.
Ok. That's not the situation now. We bought early, we caught the bottom and it is the start of the bullish wave. Having 20 different targets can be as hard as having no targets, how much to sell and when?
So here are the targets simplified, these are the main targets for Ethereum in this upcoming bullish phase.
1) $3,345 ($3333). Easy target. Can be easily ignored. Resistance can change and instead of $3,345 it shows up at $4,015. Nobody cares, we are aiming higher.
2) The ATH. Ignore it will be broken.
3) $7,331. Now this will be a strong target and can even be the top, so this is one to watch out for. If the market reacts strong and there is huge bear volume, securing some profits wouldn't be a bad idea at this point, but there is more.
4) $11,318. This is full blown-bull market with major bullish force in place. If we get a great bull market, we can hit this target or even higher.
What I mean is that there is no point in selling at $3k, $4k or $5k. When the market shakes, ignore. When there is a retrace or correction, feel free buy-in, rebuy and reload.
Namaste.
ETH-D

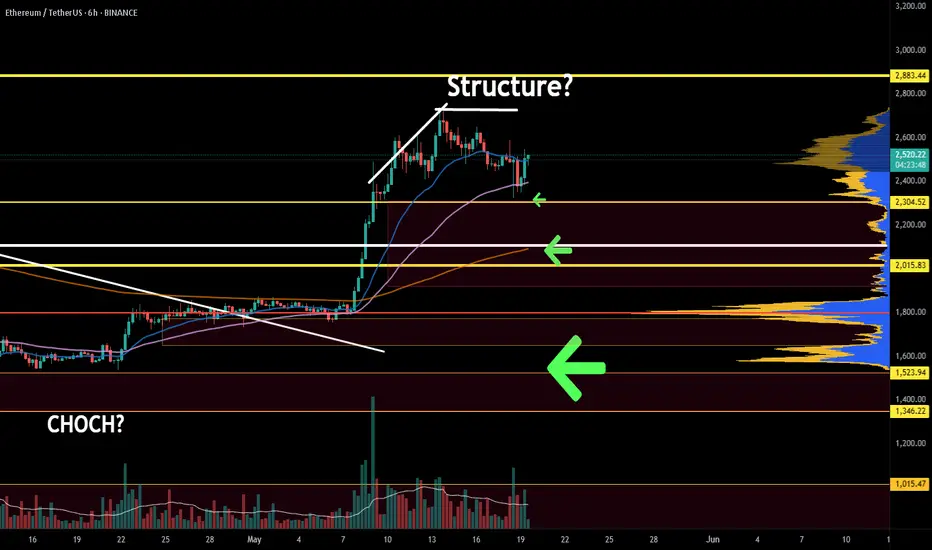
ETH/USDT Potential UpsidesHey Traders. in today's trading session we are monitoring ETH/USDT for a buying opportunity around 2420 zone, Ethereum is trading in an uptrend and currently is in a correction phase in which it is approaching the trend at 2420 support and resistance area.
Trade safe, Joe.

BTC - Why THIS TIME is DIFFERENT (⊙ˍ⊙)This time IS DIFFERENT. Bitcoin has made a new ATH as I predicted in a few previous posts, but something's off...🤔
If we look at BTC from a macro view, the dates for this run up was quite extended. We do see some similarities in terms of the retracement (highlighted in blue) but from a timeframe analysis, there is no comparing this high to the previous:
stretching from March to October where classical bear market symptoms were show - lower highs and lower lows, with a duration unlike any of the previous cycles.
Interestingly, the previous season we increased not even 7% from the previous peak. And if we were to look at the same fractal, that places us around $116k.
But the ONE thing, that has had me suspicious this entire time (🥁) was ETH. Overlaying the ETH chart, we see that historically, ETH peaked a week or two after the BTC ATH - until this time.
The fact that BTC made such a dramatic ATH and Ethereum didn't? That was a new one. And even up to now, ETH is still 80% away only from it's previous ATH - imagine the altseason we will have IF ETH makes a new ATH... or will this time just be , different ?

ETH ROAD TO 3000$ BUT.,,In the review, he told his vision of the price within the coming weeks on the ether asset.
A small correction and entry into the monthly premium zone is the target of large capital, in my opinion.
What are your ideas about the air?

ETHUSD - Strong Move UpLooking at past price movement for ETH this area shows a strong upward movement which probably will repeat
Very bullish time for altcoins especially after BTCUSD finishes its run
Lets go

Crypto update for 2025.05.22Bitcoin hits a new all-time high, but others are lagging. What's the deal?
Let's dig in...
CRYPTO:BTCUSD
CRYPTO:BCHUSD
CRYPTO:ETHUSD
CRYPTO:XRPUSD
CRYPTO:LTCUSD
CRYPTO:DOGEUSD
CRYPTO:DOTUSD
CRYPTO:TRXUSD
Let us know what you think in the comments below.
Thank you.
77.3% of retail investor accounts lose money when trading CFDs with this provider. You should consider whether you understand how CFDs work and whether you can afford to take the high risk of losing your money. Past performance is not necessarily indicative of future results. The value of investments may fall as well as rise and the investor may not get back the amount initially invested. This content is not intended for nor applicable to residents of the UK. Cryptocurrency CFDs and spread bets are restricted in the UK for all retail clients.

ADAUSDT WeeklyLet's see the chart on higher timeframes a bit also for once. Let us examine the bigger levels and bigger picture.

$ETH / $BTC Inverse Head and Shoulders Confirmed! NGL pretty much every chart i'm looking at rn looks crazy bullish 🐂
Inverse Head and Shoulder confirmed on ETH / BTC 🤯
The real test comes at the 200DMA as CRYPTOCAP:ETH has not traded above it in the past 307 days.

Caught the pivots up, now what?If you find this information inspiring/helpful, please consider a boost and follow! Any questions or comments, please leave a comment!
After catching the directional turn and key pivot level ahead of the recent move, Ethereum delivered the reaction we were anticipating. But what comes next?
The current W2 corrective structure isn’t textbook, so what do we do?
At this stage, we’re anchoring our analysis off the Wave 3 price action, which likely completed before the latest correction. That sets us up to track a potential Wave 4 development.
Here’s what’s still on the table:
We have a sideways style W2
For a wave 4, based off of alternation, we should be looking for a:
A sharp zigzag
Or a contracting triangle coiling up for the next breakout
Key Level to Watch:
👉 A clean break below 2159 would invalidate the more bullish interpretations and open the door to deeper corrective action. ⚠️
Until then, staying patient and letting the structure develop will be key.
Trade safe, trade smart, trade clarity.

Going Short on EthereumBINANCE:ETHUSDT
Ethereum has moved up strongly in the last 6 weeks to a key resistance level, which is the 50% Fibonacci Retracement, leaving a huge Fair Value Gap between the $2,400 USDT and the $1,900 USDT level. Most Fair Value Gaps get filled, and I expect it to be the case this time. The Gap closes at around $1,900 USDT.
I also see this move overextended in the short term and do for a correction, so I am going short here.
I hope you find this interesting.
Good luck to you

ETH - This will take time Part IIAs previously outlined, the fourth wave of the Primary degree in Ethereum (ETH) is forming a large triangle pattern, consistent with the corrective structure observed in XRP. This pattern is likely to extend over time, with the fifth wave of the Primary degree expected to begin around November or December 2025. A potential sharp breakout could occur starting in February 2026, signaling the start of a significant bullish move. If this breakout materializes, ETH could experience a substantial price increase, potentially exceeding current expectations, with a target significantly higher than anticipated.

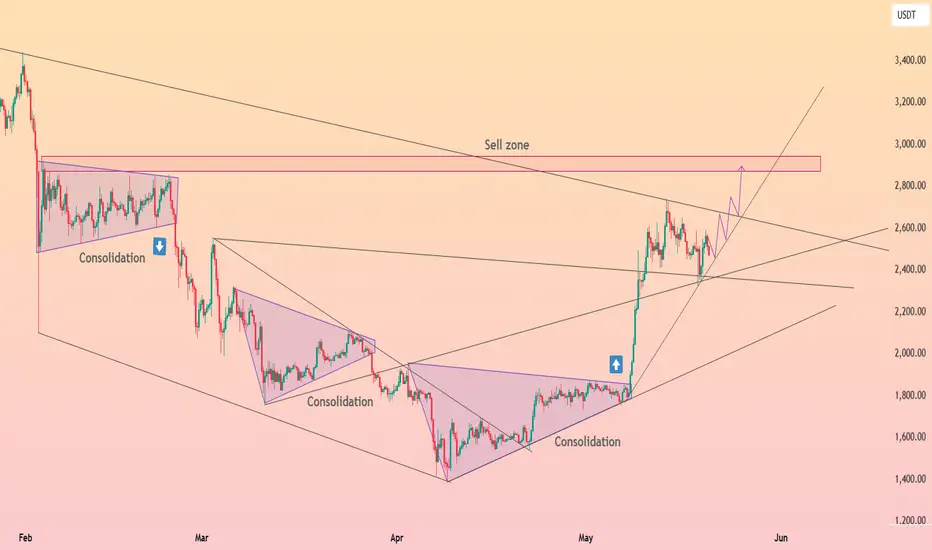
HolderStat┆ETHUSD reboundedCRYPTOCAP:ETH exploded out of its multi-month falling wedge, racing from 1.8 k to 2.7 k. It now straddles the broken wedge roof plus a fresh rising guide at 2.45-2.50 k. Hold that shelf and the chart still projects into the 2.9-3.0 k sell zone; slip beneath 2.35 k and bulls will likely regroup at deeper support near 2.2 k. 🎯
THESE ALTS can +100% | ALTSEASON PART2️⃣Altseason usually happens when BTC trades close towards a new ATH, as it is doing now, and takes some time to stall/trade sideways
Now this season is working a little differently. Usually ETH makes its way towards new highs, but we haven't seen that just yet. Ethereum has HUGE upside potential still.
It's hard to say just how high Ethereum can go, but what we do know is that it's still 88% away from the previous ATH, and due for a new one...
ENA is another alt with big upside potential, from it's previous peak its more than 200% away:
Solana has made a strong V-shaped recovery and if ETH is primed for new ATH, SOL is sure to follow:
TRUMPcoin may be memecoin, but the again so is PEPE! Still big upside after a long while of range trading here:

ETHUSDT is Breaking Out!! Is the Bull Run Finally Here?After a long period of consolidation within a descending channel, BINANCE:ETHUSDT is showing signs of life as it finally breaks out with bullish intent. This technical breakout could mark the beginning of a fresh bull run, reminiscent of past explosive moves we’ve seen from MARKETSCOM:ETHEREUM following major corrections. Historically, CRYPTOCAP:ETH has experienced drawdowns of over 90%, only to bounce back stronger and reach new all-time highs.
Currently, BITSTAMP:ETHUSD remains deep in the oversold zone, suggesting it’s still undervalued relative to its potential. As momentum begins to pick up, we could see targets being hit one by one, driven by renewed investor interest and favorable market conditions.
Moreover, the recent surge in COINBASE:ETHUSD ETF inflows adds fundamental weight to the technical setup. This institutional participation could act as a catalyst for a sustained rally, reinforcing the bullish bias.
That said, risk management is key. Always trade with a clear stop loss and position sizing to protect capital. The opportunity is brewing – the question is, are you ready to ride the wave?
BYBIT:ETHUSDT Currently trading at $1790
Buy level : Above $1750
Stop loss : Below $1490
Target : $4000
Max leverage 3x
Always keep stop loss
Follow Our Tradingview Account for More Technical Analysis Updates, | Like, Share and Comment Your thoughts

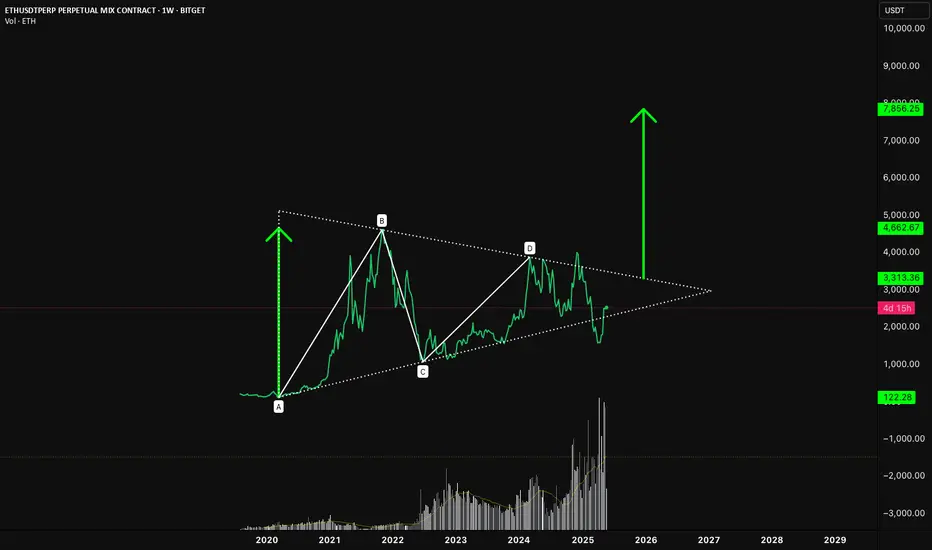
ETH/USDT – The Ethmuda TriangleZoom out.
Since the 2021 highs, Ethereum has spent years grinding sideways, printing what now looks like a textbook symmetrical triangle. Labeled here as an ABCD compression pattern, this structure has been tightening since the macro top (B), slowly building energy within narrowing volatility.
🔺 Structure Breakdown:
• A to B: The explosive bull run from the March 2020 low to the all-time high.
• B to C: A deep correction that shook out weak hands and set the bottom.
• C to D: A multi-year coil of consolidation, forming higher lows and lower highs.
• D to ?: We’re now nearing the apex, where compression typically leads to expansion.
📍 The Trigger Zone
The key level to watch is $4,000–$4,200. A clean breakout above this zone would invalidate the downtrend line and break the triangle to the upside. From a pattern-measured move perspective, the height of the triangle (A to B) projected from the breakout point suggests potential upside into the $7,800–$8,000 region.
🧠 Why This Matters
• Volume has been tapering throughout the structure — classic behaviour in large triangles.
• Market sentiment remains uncertain, making a breakout all the more impactful.
• Ethereum fundamentals are arguably stronger than they were in 2021 — Layer 2s, institutional use cases, and new ETH ETF speculation all add fuel.
📊 Potential Target:
• Immediate resistance: $3,300
• Breakout trigger: $4,000–$4,200
• Projected move: ~$8,000
🕰️ When? Well.. who knows but it does sort of line-up with my previous idea using a SOL/USDT chart that says early next year.. and not this year.
This is the type of setup plays out pretty well on lower timeframes, why not a massive one? The real question is: Are we on the verge of expansion after compression?
Let the chart do the talking.
⚡️ Not Financial Advice
Check if the price can hold above 2627.18
Hello, traders.
If you "Follow", you can always get the latest information quickly.
Have a nice day today.
-------------------------------------
(ETHUSDT 1D chart)
The M-Signal indicator on the 1M chart has risen above.
Accordingly, the key is whether it can find support near 2677.18 and rise.
If OBV rises above the A line, the price is expected to rise significantly once more.
Then, it is expected to rise to around 3265.0-3321.30.
-
If it falls without being supported near 2627.18, it is necessary to check whether it is supported near the right Fibonacci ratio 0.5 (2295.84).
Since the M-Signal indicator on the 1W and 1D charts is passing near that point, it is expected to play an important role.
-
Since the StochRSI indicator is in the overbought zone, it will eventually show a downward trend.
It is not known how much this decline will occur, but since the StochRSI 50 indicator is currently formed near 2359.35, it is important to check whether there is support near that area.
Therefore, in order to proceed with a new transaction, I think it is better to check the support point when the StochRSI indicator shows a downward and then upward trend in the overbought zone.
-
Thank you for reading to the end.
I hope you have a successful transaction.
--------------------------------------------------
- Here is an explanation of the big picture.
I used TradingView's INDEX chart to check the entire range of BTC.
I rewrote the previous chart to update it while touching the Fibonacci ratio range of 1.902 (101875.70) ~ 2 (106275.10).
(Previous BTCUSD 12M chart)
Looking at the big picture, it seems to have been maintaining an upward trend following a pattern since 2015.
In other words, it is a pattern that maintains a 3-year bull market and faces a 1-year bear market.
Accordingly, the upward trend is expected to continue until 2025.
-
(Current BTCUSD 12M chart)
Based on the currently written Fibonacci ratio, it is displayed up to 3.618 (178910.15).
It is expected that it will not fall again below the Fibonacci ratio of 0.618 (44234.54).
(BTCUSDT 12M chart)
Based on the BTCUSDT chart, I think it is around 42283.58.
-
I will explain it again with the BTCUSD chart.
The Fibonacci ratio ranges marked in the green boxes, 1.902 (101875.70) ~ 2 (106275.10) and 3 (151166.97) ~ 3.14 (157451.83), are expected to be important support and resistance ranges.
In other words, it seems likely that they will act as volume profile ranges.
Therefore, in order to break through these ranges upward, I think the point to watch is whether they can receive support and rise near the Fibonacci ratios of 1.618 (89126.41) and 2.618 (134018.28).
Therefore, the maximum rising range in 2025 is expected to be the 3 (151166.97) ~ 3.14 (157451.83) range.
In order to do that, we need to see if it is supported and rises near 2.618 (134018.28).
If it falls after the bull market in 2025, we don't know how far it will fall, but based on the previous decline, we expect it to fall by about -60% to -70%.
Therefore, if it starts to fall near the Fibonacci ratio 3.14 (157451.83), it seems likely that it will fall to around Fibonacci 0.618 (44234.54).
I will explain more details when the bear market starts.
------------------------------------------------------

ETHUSD: Consolidation before the Megaphone targets 4,100Ethereum is on a strong bullish 1D technical outlook (RSI = 63.675, MACD = 190.470, ADX = 31.885) despite the current technical pullback which is happening due to the rejection on the 1D MA200. Once crossed, we expect a test of the Megaphone's top (TP = 4,100).
## If you like our free content follow our profile to get more daily ideas. ##
## Comments and likes are greatly appreciated. ##

ETH going up... 🚀 ETH/USDT Current Analysis 🚀
Ethereum (ETH) is currently trading around $2535. The ongoing bullish trend suggests potential target levels at $2780 and $2900.
🔄 However, a corrective phase is anticipated, which could pull the price back towards $2290 and $2120.
📈 In the long term, our price targets are set at $3200, $3800, and $4500.
Always exercise caution in the cryptocurrency market and stay informed about the latest developments! 💹
#Ethereum #ETH #Crypto #Investment

Ethereum is on Bullish TrackFenzoFx—Ethereum resumed its bullish trend after testing last week's low at 2,340. Price action and candlestick patterns support the current momentum.
The Stochastic Oscillator at 65.0 suggests the market is not overbought, indicating a likely continuation of the uptrend. The next bullish target is last week's high at 2,755.
Bearish Scenario : If ETHUSD falls and holds below 2,340.0, the downtrend from 2,755 may extend to 2,130.0.
Trade ETH/USD at F enzo F x

Binance Blinked! High level of USDC volume across Binance..Binance has for many years tried their own versions of buying US debt with USD made from selling a stablecoin of their own. This has been squashed nearly every time and has most likely hindered the flow on binance itself.
It seems binance may have blinked. USDC has been flooding into Binance this year maintaining often very high levels of relative volume. This flow is overall better than if neither party capitulated. Must be careful of different streams of volume fragmenting both bullish and bearish data. While USDT is seeing all time highs its market share is falling with the wider adoption of stablecoins on chain and in traditional finance.
All this is occuring as stablecoin regulation is being passed in the US www.tradingview.com and Dimon says NYSE:JPM will be buying COINBASE:BTCUSD for clients soon

ETH pulling back will be an opportunity. ETH is showing some weakness after a strong rally. This is normal. Expect profit taking and re-accumulation at lower levels. Picking up bullish bits on dips is how ETH makes a higher high.
Full TA: Link in the BIO
Solana – Speculative Long Trade Setup Ahead of Narrative CatalysDespite BTC and ETH rallying, SOL has lagged, making it a potential rotation play as capital moves across majors. With attention building around the Internet Capital Markets narrative, SOL may soon attract speculative inflows, especially given its historical performance during sector-wide momentum shifts.
🔹 Entry Zone:
$152 – $154
🎯 Take Profit Targets:
🥇 $172 (local resistance / prior rejection zone)
🥈 $181 (next HTF resistance and possible momentum breakout zone)
🛑 Stop Loss:
$144 (invalidates current short-term bullish structure)

ETH + ALTSEASON | NEW All Time Highs Soon ??This would have been the first time that BTC made a new ATH during a bullish cycle, but ETH didn't - are we too hasty?
Very interesting to compare the two side by side and see that ETH has much more to gain than BTC:
The BTC new ATH update can be found here:
______________________
BINANCE:BTCUSDT BINANCE:ETHUSDT
