If Ethereum behaves like $BTCIf Ethereum behaves like CRYPTOCAP:BTC , which after breaking through the downward channel continued to grow without a rollback, then soon we will see our Favorite Ether at $2500.
The altcoin season will come after the growth of Ether, but there will not be enough Liquidity for everyone!
Projects that are alive, working, and earning will grow.
Projects should have realized - It's time to take responsibility and independently ensure the Liquidity of their Tokens at the expense of income from the Business Model, and not live at the expense of VCs with a printing press.
#RateXAI #RAA token
ETH-D

$ETH has woken up!Usually very busy on Thursday, volunteer work, & didn't find the post on us being bullish on CRYPTOCAP:ETH while many have soured on it.
Targets? Purple Arrows!
We bought leveraged ETF AMEX:ETHT CBOE:ETHU very close to the recent lows.

ETH - Is $3,000 next?Today marked a significant milestone for Ethereum as it successfully rolled out its much-anticipated Pectra upgrade. The update, which introduces a number of technical enhancements aimed at improving scalability, security, and developer experience, has already had a noticeable impact on market sentiment. In the hours following the upgrade, Ethereum (ETH) surged more than 13%, breaking through key resistance levels and igniting fresh bullish momentum.
From a technical standpoint, ETH is currently breaking out of a descending wedge pattern, a structure often seen as a bullish reversal signal. The price action has decisively pushed through the wedge’s upper boundary, signaling a potential end to the recent downtrend. Additionally, ETH is now testing a significant resistance zone, often referred to as the "resistance box," which has historically served as a key battleground between bulls and bears.
Should Ethereum manage to secure a clean breakout above this resistance area with strong volume. The next major upside target lies around the $3,000 level, a psychologically and technically important price point. This move could mark the beginning of a larger bullish cycle if market conditions remain favorable and momentum continues to build.
With the broader crypto market showing signs of recovery and Ethereum's fundamentals strengthening post-upgrade, traders and investors alike will be closely watching to see whether ETH can sustain its breakout and confirm this bullish trend.
-------------------------------
Thanks for your support.
- Make sure to follow me so you don't miss out on the next analysis!
- Drop a like and leave a comment!

ETH/USDT – Ascending channel. Breakdown below support?Ethereum - is a smart contract platform that allows developers to build decentralized applications (DApps) on its blockchain.
CoinMarketCap : #2
↗️ Ethereum is moving within an ascending channel, and the bullish trend remains intact.
Inside the channel, there are two triangles.
The first triangle, with a base of 88%, has played out—its third wave broke through the triangle.
Liquidity grabs and shakeouts before the growth in the inner channel zones are marked with yellow circles.
Currently, we see a mirrored situation with a new triangle, this time with a 156% base. However, if this pattern plays out, it will break the ascending channel.
At the moment, the price has been dragged below the channel support, and there is a lot of negative sentiment in the news and opinions. Few believe in an upward move, and many have been liquidated. To me, this looks like a strong trigger.
⤵️The bearish scenario implies a -61% drop. (A less likely scenario.)
I've marked everything on the chart—consider this in your trading strategy. Remember, there's a lot of negativity around Ethereum, just like with all altcoins...
I also believe that on the monthly chart, it will end up being just a wick of the candle.

SHITCOIN index to 11X - No crying in the CASINO!I see grown men on my timeline expressing despair, claiming that altcoins are finished!
Come on, get a grip!
Volatility is simply the cost of chasing the highest potential returns in the most speculative market the world has ever seen.
Yet, many are unwilling to wait just one more year.
They’re turning into Bitcoin maximalists, hesitant to promote their favourite coins and reluctant to introduce friends and family to their preferred ecosystems.
This is just ridiculous.
Take a look at that chart.
I mean really study it.
It shows a stunning continuation pattern of an inverse head and shoulder.
Is that bearish or bullish?
You decide.
Embrace the cost of those future returns.
The Others index going to Trillions of dollars.
Means many millionaires will be freshly minted.
From memes to mansions.

Super bullish ETH now. ETH.D, ETHBTC, ETHUSD all bottom signalsMy forecast for ETH Dominance. I believe it will come back with vengeance relative to BTC. CRYPTOCAP:ETH.D BINANCE:ETHBTC BINANCE:ETHUSD COINBASE:ETHUSD BITSTAMP:BTCUSD

U scared, I'm eyeing $100k by May.What beautiful price action.
We are going higher.
disagree if you want.
But you should probably hedge that viewpoint, with a bullish bet.
BALLA JI!
WE WILL WIN.

Crypto update for 2025.05.08A quick little technical crypto update for 2025.05.08.
Let us know what you think.
CRYPTO:BTCUSD
CRYPTO:BCHUSD
CRYPTO:ETHUSD
CRYPTO:XRPUSD
CRYPTO:DOGEUSD
CRYPTO:DOTUSD
CRYPTO:TRXUSD
Let us know what you think in the comments below.
Thank you.
77.3% of retail investor accounts lose money when trading CFDs with this provider. You should consider whether you understand how CFDs work and whether you can afford to take the high risk of losing your money. Past performance is not necessarily indicative of future results. The value of investments may fall as well as rise and the investor may not get back the amount initially invested. This content is not intended for nor applicable to residents of the UK. Cryptocurrency CFDs and spread bets are restricted in the UK for all retail clients.

Ethereum ETH price analysisThe #Ethereum network has successfully activated the #Pectra update, one of the factors that JPMorgan previously called a bullish driver for CRYPTOCAP:ETH
The update contains 11 improvements, including: support for smart contracts in wallets (simplified use and recovery, payment of fees in different tokens), an increase in the staking limit to 2048 ETH, optimization of validators and management of withdrawals through smart contracts.
All of this should make #Ethereum more convenient, scalable, and accessible.
📊 If we look at the OKX:ETHUSDT chart, I want to believe that the price will not go below $1500-1600 and this will be the “last carriage” buying zone
📈 And then - a smooth “acceleration of a heavy locomotive”, which, let's hope, will reach the $3800 “station” already in 2025.
_____________________
Did you like our analysis? Leave a comment, like, and follow to get more

Bitcoin (BTCUSD) – Bullish Continuation SetupBitcoin is showing strong bullish structure on the daily timeframe, having broken out of a key range and now approaching a potential retest zone.
Price is currently hovering around 96,990, and we’re anticipating a possible retracement into the demand zone between 91,856 – 88,533. This area aligns with a previous consolidation and breakout range, offering a high-probability buy zone if price reacts with bullish intent.
📌 Key Technical Highlights:
Break of structure confirms bullish bias
Demand zone identified between 91.8K – 88.5K
Anticipating a retracement for continuation
Bullish targets toward 100K+
We’ll be watching lower timeframes for confirmation (engulfing candles, bullish BOS, or SFPs) before entering long.

ETH Summer BearishA potential path for ETH before resuming a bullish major trend, is drawn with a purple arrow.
I don't think the FED will cut rates today. In fact, maybe in September. Maybe. If the FED cut rates, then the target scenario (green box in the chart) would not play out, we would shift to a bullish movement. I wish for that, but I don't think is near yet.
That being said, the current potential risk, I calculated it to -30% from current levels. Exact prices are impossible to predict, rather I focus on target areas.
DISCLAIMER:
Do Your Own Research, don't use mine to invest! This is not a financial advice, it is only a mere opinion of mine. I own several cryptocurrencies, including ETH.

ETH (Ethereum)–High-Risk, High-Reward Setup Near Fair Value GapEthereum is showing early bullish signals within a broader downtrend, and a pullback toward the $1,700 zone—where it meets the underside fair value gap and 21-day moving average—may set the stage for a higher low and potential trend reversal.
🔹 Entry Zone:
$1,700
🎯 Take Profit Levels:
🥇 $2,000
🥈 $2,200
🥉 $2,400
🛑 Stop Loss:
$1,550 (below structure and invalidation point)

ETH/USDT – Weekly Chart AnalysisETH/USDT Unique Technical Structure: Large Accumulation + Recovery Setup
This chart shows Ethereum’s price action over the past few years, highlighting key support and resistance areas. A strong visual signal (blue arrow) indicates bullish potential.
Chart Pattern Implications:
The pattern on this chart is not a classical shape (e.g., cup and handle), but it does show a Wyckoff-style accumulation phase followed by a failed breakout and reaccumulation:
Strong base formed between $1,000-$1,400
A series of lower highs and a range-bound structure after the 2022 peak
The bullish projection illustrated by the arrows shows a potential recovery towards the ATH again
This setup suggests that Ethereum is at a critical juncture – either:
It retests current support and begins a new uptrend.
Or it risks another test of the $1,400-$1,050 range before a breakout.
Risk-Reward: Current levels ($1,796) offer attractive long-term entries if you’re bullish.
Caution Zone: If ETH breaks below $1,400 with volume, $1,050 becomes the next key defense.
If you found this analysis helpful, hit the Like button and share your thoughts or questions in the comments below. Your feedback matters!
Thanks for your support!
DYOR. NFA

ETHEREUM: Will Go Up! Long!
My dear friends,
Today we will analyse ETHEREUM together☺️
The price is near a wide key level
and the pair is approaching a significant decision level of 1801$ Therefore, a strong bullish reaction here could determine the next move up.We will watch for a confirmation candle, and then target the next key level of 1810$ Recommend Stop-loss is beyond the current level.
❤️Sending you lots of Love and Hugs❤️

AI Prediction ETH/USD for 24 hour! Intraday trading!May 5, 2025 6:36 pm. ETH/USD. ETH/USD Trading Plan
Long Scenario
- Entry: $1,815 (confirmed by Supertrend long + RSI rising above 40).
- Stop-Loss (SL): $1,790 (below $1,800 support).
- Take-Profit (TP): $1,840 (below $1,850 resistance).
- Trailing Stop: 13 points (2x ATR).
Short Scenario
- Entry: $1,795 (confirmed by breakdown below $1,800 + MACD bearish crossover).
- Stop-Loss (SL): $1,820 (above $1,810–$1,820 resistance).
- Take-Profit (TP): $1,750 (above $1,780 support).
- Trailing Stop: 13 points (2x ATR).

BTC (Post Weekly Close Update)BTC has seen a weekly close above the 93700 support, suggesting bullish strength and likely continuation if this level holds on the weekly. We remain bullish as long as 93700 is maintained; a drop below it would be the first SOW on the HTF, potentially targeting 89K–90K, and possibly 1D OB at 83K–85K. Technically, this remains a LH until the 99500 SH is convincingly reclaimed, ideally on a weekly close.
On the daily, however, we’ve observed the first SOW, closing below the SH at 95K after a rejection from the 1D supply zone, refined into MTF HOBs, where whales initially sold off aggressively. This isn’t alarming, but it warrants attention. With the SPX at resistance, the DXY at support, USDT.D closing the weekly well above the SL at 5.03, and TOTAL at resistance, these are signs of caution, in my view, despite the series of bullish news we’ve seen. That said, with the HTF remaining bullish, we’ll focus on exploiting LTF and MTF moves. The FOMC meeting on Wednesday could certainly bring volatility in the markets, particularly as BVOL24H and BVOL7D, as mentioned in the last update, are at support.👀
To further examine the weakness, note the contrast between the two horizontal ranges (grey boxes). The first range saw a BO followed by impulsive PA, smashing through the 90K key level. In contrast, the second range produced a BO but encountered an HTF supply, resulting in a notably weaker bounce compared to the first BO from the lower range. This could potentially manifest as a deviation if the price closes below the RL, making the 8D HOB at 89K–90K our next target.
On the LTF/ MTF, we’ve also seen a break below the TL, with the other resistance TL being respected, indicating further weakness. Although we haven’t yet seen HTF weakness, I believe a scalp-sized short from the 11H OB, refined into a 2H HOB at 95500 SH, makes sense with a tight invalidation, or from the MTF level around 97500, if provided. If the daily closes above 95500 again, I might consider a scalp long into the 1D supply for a potential DT or even the 100K psychological level.

Breakout trading point: 1861.57
Hello, traders.
If you "Follow", you can always get new information quickly.
Please click "Boost" as well.
Have a nice day today.
-------------------------------------
(ETHUSDT 1D chart)
The 1861.57 point is the HA-Low indicator point on the 1W chart.
The key is whether it can receive support and rise around the A section, that is, 1861.57.
Since the HA-Low indicator on the 1D chart is formed at the 1647.06 point, it is important whether it can receive support and rise in the 1647.06-1861.57 section.
If it shows support in the 1647.06-1861.57 section, it is a time to buy.
-
If it falls from 1647.06, there is a possibility that a stepwise downtrend will continue, so you should also consider a response plan for this.
In the case of a decline, the Fibonacci ratio section of 0 (1190.57) ~ 0.786 (1259.39) is expected to be an important support and resistance section.
-
Since the price is located below the M-Signal indicator on the 1M chart, it is recommended to conduct trading from a day trading or short-term trading perspective.
When it breaks through the 1861.57 point, a breakout trade is possible, but as I mentioned earlier, trading requires a short and quick response.
-
If the StochRSI indicator is above the midpoint, it is recommended to focus on finding a time to sell, and if it is below the midpoint, it is recommended to focus on finding a time to buy.
When creating a trading strategy by referring to the movement of these auxiliary indicators, you must check whether there is support at the support and resistance points drawn on the 1M, 1W, and 1D charts.
-
Thank you for reading to the end.
I hope you have a successful trade.
--------------------------------------------------
- Here is an explanation of the big picture.
I used TradingView's INDEX chart to check the entire range of BTC.
I rewrote the previous chart to update it while touching the Fibonacci ratio range of 1.902 (101875.70) ~ 2 (106275.10).
(Previous BTCUSD 12M chart)
Looking at the big picture, it seems to have been maintaining an upward trend following a pattern since 2015.
In other words, it is a pattern that maintains a 3-year bull market and faces a 1-year bear market.
Accordingly, the upward trend is expected to continue until 2025.
-
(Current BTCUSD 12M chart)
Based on the currently written Fibonacci ratio, it is displayed up to 3.618 (178910.15).
It is expected that it will not fall again below the Fibonacci ratio of 0.618 (44234.54).
(BTCUSDT 12M chart)
Based on the BTCUSDT chart, I think it is around 42283.58.
-
I will explain it again with the BTCUSD chart.
The Fibonacci ratio ranges marked in the green boxes, 1.902 (101875.70) ~ 2 (106275.10) and 3 (151166.97) ~ 3.14 (157451.83), are expected to be important support and resistance ranges.
In other words, it seems likely that they will act as volume profile ranges.
Therefore, in order to break through these ranges upward, I think the point to watch is whether they can receive support and rise near the Fibonacci ratios of 1.618 (89126.41) and 2.618 (134018.28).
Therefore, the maximum rising range in 2025 is expected to be the 3 (151166.97) ~ 3.14 (157451.83) range.
In order to do that, we need to see if it is supported and rises near 2.618 (134018.28).
If it falls after the bull market in 2025, we don't know how far it will fall, but based on the previous decline, we expect it to fall by about -60% to -70%.
Therefore, if it starts to fall near the Fibonacci ratio 3.14 (157451.83), it seems likely that it will fall to around Fibonacci 0.618 (44234.54).
I will explain more details when the bear market starts.
------------------------------------------------------

Ethereum: Sell Or Hold? Panic Buy, Panic Sell or Panic Hold?If I were you in this situation, what would you do?
What would you do if you were not you in this situation?
Ethereum hit bottom on the 9th of April and the bottom is confirmed based on the same candle. It ended full green and with really high volume.
The action moved back above support on 22-April when the 3-Feb. low resistance was conquered. Ethereum now trades within a tight price range.
This range's support has been tested four times and it holds, Ethereum now trades higher but what will happen next? What would you do if I were me?
Market conditions can change in a day. Two days green, two days red it is all sideways, nothing changes and nothing has changed.
If you are still wondering if you should panic sell or panic hold right now all you have to do is panic buy because Ethereum is going up.
Ignore the short-term nothing because this chart isn't showing even noise. It is the consolidation of the higher low before additional growth.
Ethereum's chart looks very different to Bitcoin, it is incredible. Ethereum is no longer "#2" but more like an Altcoin, Bitcoin has its own chart while Ethereum has the chart of a medium sized Cryptocurrency pair. This is good, it tells us that Ethereum is about to grow really strong and will produce a new All-Time High in 2025. This All-Time High will be higher than 2021 because while this isn't Bitcoin it is still a very strong chart. Expect lower no more, panic buy followed by panic hold while you rest easy and relaxed because there is no panic when the market grows.
The only panic right now is on the short side because the bottom is in and the bears are gone.
Rest easy, do not let go of your coins. Hold strong.
Never ever use a stop-loss. Think long-term and the market will bless you with amazing results.
Namaste.

WBETHUSDT D1 | RANK #8👀 Welcome to my Trading View Analysis and Trading Channel Here , we share the latest market analysis, trading signals, and key insights together .
Ready for smarter trades ? ⭐️
⚡️Today , we're going to analyze the WBETH ( Wrapped Beacon ETH
) coin together on the daily timeframe and find triggers for our positions .
The breakout of the descending channel has already been confirmed, as expected. This is a very positive sign for investors! 🚀
1. With this confirmation of the breakout, we can anticipate a solid bullish wave in the coming days. 📈 The market seems to be gaining momentum, indicating the potential for significant price growth.
2. These conditions give us the opportunity to remain optimistic about the increase in asset values and explore exciting opportunities ahead. 💡 It's crucial to stay alert during these thrilling times.
3. Analyzing market trends and staying informed can help us make the most of this favorable situation. 📊 We should leverage this positive momentum to enhance our investment strategies.
4. I hope that with this new trend, we witness even more successes and growth! 🎉 Let's embrace this wave of optimism together and make the best out of the upcoming potential!
I researched this coin on CoinMarketCap on your behalf , and I'm sharing a summary of the information I gathered .
Read carefully , as you need to have this information . 🌈
The WBETH (Wrapped Beacon ETH) token is a protocol token designed to facilitate the use of Ethereum 2.0 on the Ethereum 1.0 blockchain. 🌟 Its primary goal is to enable access to staked Ethereum within the Proof of Stake protocol in the Ethereum 1.0 ecosystem and other decentralized finance (DeFi) protocols. 💼
### Features of WBETH:
1. Usability: WBETH allows users to utilize their staked Ethereum in the ETH 2.0 protocol without actually withdrawing it from its staked status. 🔄
2. Trading and Exchange: Users can trade WBETH just like other tokens on exchanges and decentralized finance platforms. 📈
3. Reward Generation: By holding WBETH, users can benefit from the staking rewards of Ethereum 2.0. 🎉
4. ERC-20 Architecture: WBETH is typically issued as an ERC-20 token, making it suitable for use within the Ethereum ecosystem. 🛠️
### Important Notes:
- While WBETH allows users to have liquidity from their Ethereum assets, they should remain aware of the associated risks and complexities related to regulations and technology. ⚠️
- The conversion rate between ETH and WBETH may vary and be influenced by supply and demand. 💱
Overall, WBETH is an innovative way for users to take advantage of Ethereum 2.0 benefits while still participating in the Ethereum 1.0 ecosystem. 🚀
I love you all so much . 👀
don't forget about capital management and risk management .
Be careful with your positions . 🥇

AI ETH Prediction for Next 6–24 Hours!May 4, 2025 4:21 pm. ETH/USD Trading Strategy
Timeframe: Short-Term (Next 6–24 Hours)
Long Scenario
- Entry: Break above 1833.50 (confirmed bullish momentum).
- Confirmation: MACD bullish crossover + RSI > 50.
- Stop-Loss (SL): 1818.00 (below support zone 1820–1825).
- Take-Profit (TP): 1838.00 (below resistance 1840).
- Trailing Stop: Activate at 1835.00, trail by 0.5%.
Short Scenario
- Entry : Drop below 1825.00 (bearish breakdown).
- Confirmation: Supertrend remains short + Stochastic RSI reversal.
- Stop-Loss (SL): 1836.00 (above resistance 1833.50).
- Take-Profit (TP): 1815.00 (above support 1815).
- Trailing Stop: Activate at 1820.00, trail by 0.5%.

ETHEREUM New Update (1D)Price has approached a supply (flip) zone. It is not expected to break this zone on the first attempt, and bears are likely to regain control for now.
If Ethereum returns once again to the lower zones marked on the chart, it could present a low-risk opportunity for buy/long positions.
The main target can be the upper supply zone.
A daily candle closing below the invalidation level would invalidate this analysis.
Do not enter the position without capital management and stop setting
Comment if you have any questions
thank you

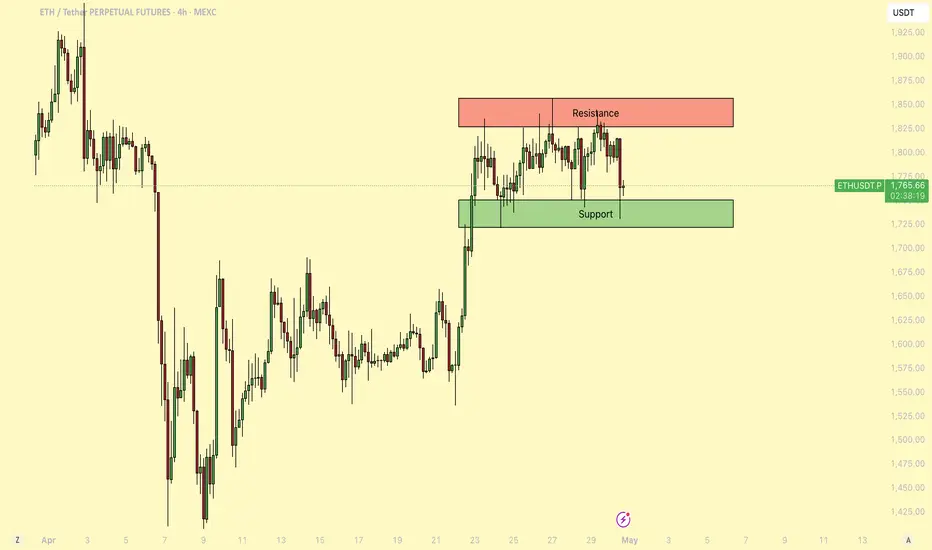
ETH - Consolidating before a major breakout!About a week ago, Ethereum (ETH) saw a strong upward move, pushing the price up with notable momentum. Since then, it has entered a period of consolidation, trading within a tight range as the market awaits the next decisive move.
-------------------------------
Which Direction Will ETH Break?
After such a strong rally, this kind of consolidation is normal. It could signal a continuation to the upside, especially if this is part of a broader relief rally. However, it's important to note that during the rapid move up, ETH left behind a 4h Fair Value Gap (FVG), which may attract price back down for a potential fill in the event of a breakdown.
-------------------------------
Stochastic RSI insight
On the daily chart, the Stochastic RSI remains in the overbought zone. Historically, when this indicator lingers in such territory, ETH has seen notable pullbacks. This could be an early sign that a downward move is more likely unless momentum changes soon.
-------------------------------
ETH vs. the 50-Day Moving Average
ETH is currently struggling with the 50-day Moving Average (MA), trading just below this key resistance level. As long as ETH remains under the 50-day MA, bearish pressure could continue. However, a reclaim and sustained hold above this level would likely indicate a shift toward bullish momentum.
-------------------------------
My Outlook
This range is tricky to trade, and a breakout in either direction is possible. Personally, I think there's a chance ETH could sweep the recent highs before a larger move down. The overbought Stochastic RSI and resistance at the 50-day MA both suggest that the rally might be losing steam in the short term.
-------------------------------
Thanks for your support.
- Make sure to follow me so you don't miss out on the next analysis!
- Drop a like and leave a comment!
Ethereum ETH Is Gaining Strength Agains BitcoinHello, Skyrexians!
BINANCE:ETHUSDT was a huge underdog last 4 month on the bearish phase, but recently it started to gain power, on the recent dump it has not showed correction.
On the daily chart we can see that price has printed 5 waves Elliott cycle. Wave 3 corresponds to the minimum Awesome oscillator. After that wave 5 has finished this cycle with divergence. The conservative bounce target is $3000 at 0.61 Fibonacci level, but we have one problem here. AO did not crossed zero line at wave 4, so we can be in wave 4 only now, in this case another one lower low will happen. We need to count sub waves every day. Wait for our updates.
Best regards,
Ivan Skyrexio
___________________________________________________________
Please, boost this article and subscribe our page if you like analysis!
