BITCOIN AND ALT COIN ANALYSIS!I hope you guys enjoyed the video! If you have any questions or comments feel free to comment down below!
ETH-D

Altcoins, Crypto is different since institutions came inHow long have we been saying this? Yet the masses have not grasped this concept. Neother have influencers. But that makes sense because they need clicks to survive. People tend to "graze" where pasture seems greener, even if it isn't.
CRYPTOCAP:TOTAL 3 = NO CRYPTOCAP:BTC or CRYPTOCAP:ETH
Altcoins have been in a steady incline since Nov 23.
Daily
The last 2 consolidation phases lasted AROUND 6 months, depending on where you begin the consolidation phase.
Weekly
Not important going further as Crypto landscape has changed & the back data is irrelevant. However, let's be nosey & see how it looks in comparison.

Bullish bounce off 50% Fibonacci support?Ethereum (ETH/USD) is falling towards the pivot and could bounce to the 1st resistance.
Pivot: 1,671.81
1st Support: 1,547.72
1st Resistance: 1,829.87
Risk Warning:
Trading Forex and CFDs carries a high level of risk to your capital and you should only trade with money you can afford to lose. Trading Forex and CFDs may not be suitable for all investors, so please ensure that you fully understand the risks involved and seek independent advice if necessary.
Disclaimer:
The above opinions given constitute general market commentary, and do not constitute the opinion or advice of IC Markets or any form of personal or investment advice.
Any opinions, news, research, analyses, prices, other information, or links to third-party sites contained on this website are provided on an "as-is" basis, are intended only to be informative, is not an advice nor a recommendation, nor research, or a record of our trading prices, or an offer of, or solicitation for a transaction in any financial instrument and thus should not be treated as such. The information provided does not involve any specific investment objectives, financial situation and needs of any specific person who may receive it. Please be aware, that past performance is not a reliable indicator of future performance and/or results. Past Performance or Forward-looking scenarios based upon the reasonable beliefs of the third-party provider are not a guarantee of future performance. Actual results may differ materially from those anticipated in forward-looking or past performance statements. IC Markets makes no representation or warranty and assumes no liability as to the accuracy or completeness of the information provided, nor any loss arising from any investment based on a recommendation, forecast or any information supplied by any third-party.

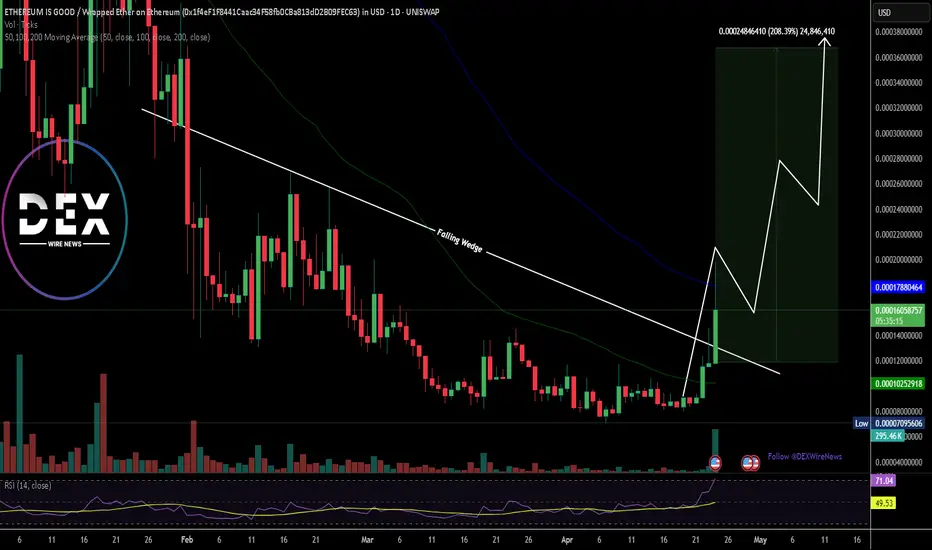
Breaking: $EBULL Spike 70% To Reclaim $1 Million Market Cap The price of Ethereum is Good token ticker name ($EBULL) has seen a notable surge of 70%, breaking out of a falling and setting the stage for a 200% leg-up.
Lunched Oct 06, 2024 (7 months ago) with a price of $0.00005729, $EBULL hit its all-time-high Aug 31, 2024 (8 months ago) and has since plunge losing about 94% of market value.
Ethereum is good coin ($EBULL) has been a ticking time bomb in the crypto market with cryptic post by Vitalik Butetrin Ethereum's founder, $EBULL might just be on the cusp of a breakout.
Another bullish thesis is the fact that $EBULL is only listed on one CEX which is Poloniex. With more exchange listings, $EBULL might be the catalyst for the next bull run.
With growing momentum and reduction of fees on the Ethereum chain, we will see an influx of traders back to the Ethereum ecosystem, leading to massive adoption of Ethereum chain coins.
$EBULL's RSI is at 71, making it a prime contender of the continuation pattern as the memecoin has already broken the ceiling of a falling wedge.
ETHEREUM IS GOOD Price Data
The ETHEREUM IS GOOD price today is $0.000166 USD with a 24-hour trading volume of $307,290 USD. ETHEREUM IS GOOD is up 40.90% in the last 24 hours. The current CoinMarketCap ranking is #1721, with a market cap of $1,658,645 USD. It has a circulating supply of 10,000,000,000 EBULL coins and a max. supply of 10,000,000,000 EBULL coins.
ETH - New ATH Approaching?Bitcoin has been full of surprises over the past few days, and this will most definitely affect Ethereum as well - which has not made a previous ATH when BTC did , a point we should not be forgetting.
This would also bring about the beginning of a new ALTSEASON.
But before we get too excited about all of the above - let's first see if Bitcoin can continue to CLOSE daily candles above the key support zone, as pointed out in the video.
_______________
BINANCE:ETHUSDT
BINANCE:BTCUSDT

ETHUSD - IdeaCould the triangles be comparable?
With the first leading to a strong break out upwards
Have we hit the bottom of the next triangle?
I think these would be ascending triangles
Saw this chart or a similar version floating around and thought it would be a good post
Weekly timeframe

Ethereum Hits Critical Resistance — Is a Drop to $1400 Next?Introduction
Ethereum has been in a sustained downtrend over the past weeks, struggling to gain any real bullish traction. After a sharp decline last Sunday, the market remains under pressure, and although we’ve seen short-term attempts to recover, the broader trend still points downward. Technical indicators and price structure suggest this may not be over, with both Fibonacci levels and momentum oscillators hinting at further downside potential.
Resistance from the FVG and Fibonacci
Last Sunday, Ethereum dropped over 10% in a single move, forming a large 4-hour Fair Value Gap (FVG) in the process. This gap signaled a strong imbalance between buyers and sellers, with sellers clearly in control. Earlier this week, ETH managed to retrace up to the 50% level of that FVG but faced immediate rejection, highlighting the strength of the resistance. Currently, price is once again moving into the FVG zone and has reached the golden pocket Fibonacci level between $1650 and $1664. This area often acts as a key pivot for price direction. If bulls manage to break through, the next logical target would be the 0.786 Fibonacci retracement at $1724, potentially completing the fill of the FVG.
Stochastic RSI weakening on the daily timeframe
While the short-term price action shows some bullish effort, the daily Stochastic RSI tells a different story. It has now almost entered the overbought zone, suggesting that Ethereum’s current upward move may be running out of steam. This indicator often precedes a shift in momentum, and if history repeats itself, we could soon see bears stepping back in. With ETH still unable to break recent highs, the setup favors a continuation of the downtrend. If selling pressure resumes, we could be looking at a move down to the $1400 level, or potentially even lower.
Thanks for your support.
- Make sure to follow me so you don't miss out on the next analysis!
- Drop a like and leave a comment!

(ETH) ethereum "rays - month by year pattern(s)"I drew lines between each year connecting each month one year at a time using rays so that the lines would continue on through the chart. I was hoping this would give me some indication of a pattern or view on the chart that would reveal something ideal to see into the future.
...I do see one tiny pattern.
At the beginning of 2022 the previous early months rays were ascending but by the second quarter the rays were descending. That is the same thing that happened this year. The hopeful becomes the hopeless.
Are we in for a horrible Ethereum year?

(ETH) ethereum "years - phases"The phase of the Ethereum chart in years using colors to represent each year and to visually show what happened during those years. So far this year is cold and losing. Will Ethereum recover and create a new pattern never before seen or will this entire year be in vain while wishing and hoping and believing that the price will turn itself around? The year of 2025 the year of AI.

ETH gives a strong exit from the descending channel!Hello everyone, I invite you to review the current situation on ETH, because you can see a significant rebound at the level of 30% from the last low. When we enter the four-hour interval, we can see how the ETH price moved in the local downtrend channel, from which we got an exit at the top, such a scenario often gives increases at the level of the channel height, which would bring the price closer to the levels of $ 2100.
Here you can see how the current rebound brought the movement closer to the resistance at the level of $ 1830, and then resistance is visible at the price of $ 1950, where the ETH price must then face a strong resistance zone from $ 2060 to $ 2100, where there could potentially be an upward movement after leaving the channel as in this case.
Looking the other way, you can see that when the trend reverses, we first have support at the level of $ 1730, but if it is broken, the ETH price may continue to fall and return to a strong support zone from $ 1480 to $ 1380.
It is worth paying attention to the MACD and RSI indicators because you can see how in the 4H interval we have gone beyond the upper limits of the ranges, which may translate into visible price consolidation on the chart in order to cool the situation.

Ethereum - CME Gap fill before going up ?Ethereum has formed a classic CME Gap between $1,707 and $1,765, following a strong breakout. CME gaps, especially over the weekend, are statistically likely to be filled before the next major move.
We’re watching for a retest of this gap zone with a potential bounce at the lower boundary, creating a solid long entry opportunity.
Entry: 1,710–1,725 (inside the CME gap)
TP1: 1760
TP2: 1800
TP3: 1900
SL: 1,667 (below gap & invalidation of bullish structure)
Like and support us for more such idea.
Cheers
GreenCrypto

We might be seeing a short-term correctionWe might be seeing a short-term correction, as the USDT supply is rising again and both ETH and BTC failed to break through their resistance levels — while Solana did. A brief pullback is possible, especially considering that the main reason behind the breakout was recent news about Trump. That could mean the breakout was a fake move or part of a temporary trend.
The three major currencies that usually drive the market are currently showing less bullish momentum for the coming days — except for Solana , which successfully broke its resistance . However, Solana isn’t continuing to climb either, likely because we still need a breakout from both ETH and BTC to confirm the move.

ETH Rejection Incoming? Don’t Fall for This Bull TrapYello Paradisers, are you watching how ETH is reacting right now at this key zone? This could either turn into a textbook bearish setup… or catch everyone off guard. Let’s break it down 👇
💎ETHUSDT is currently hovering at a critical resistance area, perfectly aligned with both a key Fibonacci retracement zone and the 200 EMA—classic confluence. What makes it even more concerning is the bearish divergence, which is strengthening the probability of a downside rejection from this level.
💎To add fuel to the fire, the price action has just taken liquidity (inducement) above the previous highs, another bearish signal that supports the idea of a potential reversal from here.
💎However, this bearish bias will be fully invalidated if ETH manages to break and close a candle above the resistance zone. That kind of price action would suggest strength from buyers and a likely continuation to the upside.
💎In that case, it’s wiser to stay patient and wait for a cleaner setup at a better price. Rushing into a trade at this stage, especially in a moment of indecision, is not how pros operate.
If you want to be consistently profitable, you need to be extremely patient and always wait only for the best, highest probability trading opportunities.
MyCryptoParadise
iFeel the success🌴

Landwolf ($WOLF) Surged 40% Breaking Out of a Falling Wedge The price of Landwolf ( NYSE:WOLF ) a coin created and deployed on the Ethereum chain saw a notable uptick of 40% breaking out of a falling wedge gearing foe a 100% legged up.
Since early March 2025, NYSE:WOLF has been constricted in a falling wedge pattern losing about 66% of market value, but present chart metric hints at a 100% price surge in the short term.
With the RSI at 80 we might experience a bit of a respite before picking liquidity up again. However, on a bearish tone, should NYSE:WOLF experience consolidatory move to as low as the base of the wedge or ceiling formed? it might resort to selling spree for NYSE:WOLF albeit the crypto industry is exercising bullish momentum with CRYPTOCAP:BTC reclaiming $94k pivot enroute to $100k.
As per data from CMC, NYSE:WOLF has experience an uptick of 65.69% in 24-hour trading volume. With these and many more metrics, NYSE:WOLF might be on the cusp of a breakout.
What is Landwolf 0x67?
Landwolf 0x67 (WOLF) is a memecoin that stands out with its unique character created by Matt Furie. Unlike many other cryptocurrencies, WOLF is deeply rooted in community values and transparency. The project boasts a total supply of one trillion coins, with the contract renounced and no taxes imposed on transactions.

Could the price reverse from here?Ethereum (ETH/USD) is rising towards the pivot which is an overlap resistance and could reverse to the 1st support which is a pullback support.
Pivot: 1.851.36
1st Support: 1,683.61
1st Resistance: 1,945.78
Risk Warning:
Trading Forex and CFDs carries a high level of risk to your capital and you should only trade with money you can afford to lose. Trading Forex and CFDs may not be suitable for all investors, so please ensure that you fully understand the risks involved and seek independent advice if necessary.
Disclaimer:
The above opinions given constitute general market commentary, and do not constitute the opinion or advice of IC Markets or any form of personal or investment advice.
Any opinions, news, research, analyses, prices, other information, or links to third-party sites contained on this website are provided on an "as-is" basis, are intended only to be informative, is not an advice nor a recommendation, nor research, or a record of our trading prices, or an offer of, or solicitation for a transaction in any financial instrument and thus should not be treated as such. The information provided does not involve any specific investment objectives, financial situation and needs of any specific person who may receive it. Please be aware, that past performance is not a reliable indicator of future performance and/or results. Past Performance or Forward-looking scenarios based upon the reasonable beliefs of the third-party provider are not a guarantee of future performance. Actual results may differ materially from those anticipated in forward-looking or past performance statements. IC Markets makes no representation or warranty and assumes no liability as to the accuracy or completeness of the information provided, nor any loss arising from any investment based on a recommendation, forecast or any information supplied by any third-party.

Will ETH do it again?Looks like we are in a decent spot to scale in for the next mark-up phase.
ETH has retraced a bit further/deeper than originally anticipated, however that just makes the entry all the better.

ETH/USDT Falling Wedge Breakout ETH/USDT Falling Wedge Breakout Summary
Ethereum (ETH) against Tether (USDT) has recently broken out of a falling wedge pattern, a bullish technical formation characterized by converging trendlines sloping downward, often signaling a reversal from a downtrend to an uptrend. This breakout, observed on the 12H chart, suggests potential for a significant rally as buying momentum increases.
Breakout Context:
The falling wedge formed as ETH consolidated, with lower highs and lower lows, indicating diminishing selling pressure.
A breakout above the upper trendline of the wedge, as noted in recent market analysis, confirms bullish sentiment, potentially driven by increased buying volume and market optimism.
Price Targets and Resistance Levels:
The breakout has set the stage for ETH/USDT to target several key resistance levels, based on technical analysis and historical price action:
$1,750: A near-term support-turned-resistance level, previously acting as a strong support zone. A retest or consolidation around this level may occur as the price stabilizes post-breakout.
$1,816 ($1,830 zone): This level aligns with a key support/resistance zone within the descending channel. Sustaining above this level is critical for confirming short-term bullish momentum.
$1,948 ($1,950): A significant resistance level identified in recent posts, marking the first major target post-breakout. Breaking this could accelerate upward momentum.
$2,119 ($2,120): The next resistance zone, aligning with prior highs and technical projections. This level may pose a challenge, requiring strong buying pressure to breach.
$2,777 ($2,800 zone): A longer-term target, potentially achievable if ETH breaks through the $2,200-$2,400 resistance zone. This aligns with projections for a rally toward $2,800-$3,000 if momentum persists.
Market Outlook:
Bullish Scenario: For the rally to continue, ETH must hold above $1,830 to confirm the breakout’s strength. A break above $2,200-$2,400 could pave the way for targets at $2,777 and potentially $3,000, as suggested by historical patterns and Fibonacci extensions.
Bearish Risks: Failure to sustain above $1,830 could lead to a pullback toward $1,750 or lower, with $1,600 as a critical support if the breakout fails. Rejection at higher resistance levels ($2,200-$2,400) may also trigger short-term corrections.
Indicators: Bullish divergence on RSI and weakening bearish momentum on MACD support the breakout’s validity, while the 50-day moving average acts as dynamic resistance above current levels.
Conclusion:
The ETH/USDT breakout from the falling wedge signals a bullish shift, with immediate resistance at $1,750 and $1,816, followed by higher targets at $1,948, $2,119, and $2,777. Traders should monitor volume and price action around $1,830 to confirm sustained momentum, while remaining cautious of potential rejections at key resistance zones. For real-time updates, platforms like TradingView or Binance’s ETH/USDT charts can provide further insights.

Short-term uptrend conversion point expected: 1647.06
Hello, traders.
If you "Follow", you can always get new information quickly.
Please also click "Boost".
Have a nice day today.
-------------------------------------
(ETHUSDT 1D chart)
The HA-Low indicator on the 1D chart is formed at the 1647.06 point.
Therefore, the key is whether it can receive support and rise near 1647.06.
-
However, since the M-Signal indicator on the 1M chart is falling near 2500, you should trade with a relaxed mind.
This is because in order to continue the uptrend, the price must be maintained above the M-Signal indicator on the 1M chart.
-
Since the M-Signal indicator on the 1D chart is passing near the HA-Low indicator on the 1D chart, if it rises above 1647.06 and maintains the price, it is likely to turn into a short-term uptrend.
Since the trend line is showing a downward channel and the StochRSI indicator is above 50, the increase is likely to be limited.
Therefore, when the StochRSI indicator shows an upward trend below 50, it is a buying period when the price is maintained above the HA-Low indicator.
If it rises above 1647.06 and continues to rise further, it is expected to touch the Fibonacci ratio of 0.618 (1868.21).
-
Thank you for reading to the end.
I hope you have a successful trade.
--------------------------------------------------
- This is an explanation of the big picture.
I used TradingView's INDEX chart to check the entire range of BTC.
I rewrote the previous chart to update it by touching the Fibonacci ratio range of 1.902 (101875.70) ~ 2 (106275.10).
(Previous BTCUSD 12M chart)
Looking at the big picture, it seems to have been following a pattern since 2015 and has been rising.
In other words, it is a pattern that maintains a 3-year uptrend and faces a 1-year downtrend.
Accordingly, the uptrend is expected to continue until 2025.
-
(Current BTCUSD 12M chart)
Based on the currently written Fibonacci ratio, it shows up to 3.618 (178910.15).
Fibonacci ratio 0.618 (44234.54) is not expected to fall again.
(BTCUSDT 12M chart)
I think it is around 42283.58 when looking at the BTCUSDT chart.
-
I will explain it again with the BTCUSD chart.
The Fibonacci ratio ranges marked in the light green boxes, 1.902 (101875.70) ~ 2 (106275.10) and 3 (151166.97) ~ 3.14 (157451.83), are expected to be important support and resistance ranges.
In other words, it seems likely to act as a volume profile range.
Therefore, in order to break through this section upward, I think the point to watch is whether it can rise with support near the Fibonacci ratios of 1.618 (89126.41) and 2.618 (134018.28).
Therefore, the maximum rising section in 2025 is expected to be the 3 (151166.97) ~ 3.14 (157451.83) section.
To do that, we need to look at whether it can rise with support near 2.618 (134018.28).
If it falls after the bull market in 2025, we don't know how far it will fall, but considering the previous decline, we expect it to fall by about -60% to -70%.
So, if the decline starts near the Fibonacci ratio 3.14 (157451.83), it seems likely that it will fall to around Fibonacci 0.618 (44234.54).
I will explain more details when the downtrend starts.
------------------------------------------------------

#ETH Update – April 22, 2025
Current Price: $1,700.02 (+7.8%)
📊 Technical Snapshot
• Trend: Downtrend (last 4 months)
• Support: $1,500 & $1,350
• Resistance: $1,750 & $2,150
• Range: $1,557 – $1,630 → Moderate volatility
• ETH has dropped ~65% from its all-time high of $4,107
🔗 On-Chain Metrics
• Exchange Inflows: Large positive netflow to derivatives in March → Selling pressure
• Wallet Profitability: Only 20.94% of wallets in profit → Weak sentiment
• Active Addresses: Down to 400K from 650K → Lower usage
• Staked ETH: Over 25.6M ETH → Long-term confidence remains strong
🧭 Fundamentals
• SEC Approved ETH ETFs (no staking allowed) → Institutional inflow potential
• Galaxy Digital moved $100M from ETH to SOL → Institutional rotation
📈 Forecasts
• Short-Term (by Apr 27): ~$1,635.87 (−0.51%)
• Mid-Term (by May 22): ~$1,725.30 (+4.93%)
✅ Summary:
ETH is still in a downtrend, but fundamentals like staking and ETF approval show long-term strength. Short-term movement may be choppy. Watch $1,500 support and $1,750 resistance.

ETH/USDTWe can see clear consolidation boundaries. The coin made a deviation below the range, and after returning to the consolidation zone, the targets are set for growth.
Target 1 = 3000
Target 2 = 4500

Sign of a bullish trendAs we can see here, this could be a sign of a bullish trend. If the price rises to $1690, we will have broken through the resistance level, indicating a clear upward movement. We would initially set the take profit level at $1815. The news is also positive — Bitcoin has recently experienced a breakout as well.

Bitcoin call from March comes into fruition, Almost to the day!Not looking to toot horn but, did we state anything about buying CRYPTOCAP:BTC or CRYPTOCAP:ETH until recently? NO! (pls see our profile for more info on that)
We have been analyzing Bitcoin & Ethereum and posting suggestions. But until recently we did not state any buy recommendations.
In fact, om March 25th we stated that there would be a big move coming by mid April!
We then changed our stance on #Bitcoin. We noticed, far to frequent anomaly using
@tradingview charts, trendlines MOVE on their own, that the move COULD be until the 8th of May! HOWEVER, less than 2 weeks ago, we stated that A MOVE was coming before then. It has happened almost to the T!!!

Bitcoin Bearish Dead Cat BounceI am not a financial advisor. This is not meant to be and does not constitute financial, investment, trading, or any other types of advice or recommendation.
